ฝึกอ่านกราฟหาจุดเข้าให้คมที่สุด ช่วงนี้เจอคนใหม่ทักส่วนตัวมาเยอะผมให้แนวคิดภาพรวมแบบนี้ดีกว่านะครับ
เราเห็นคนเทรดแล้วรวยเราก็อยากทำได้อยากรวยมีรายได้เพิ่มเพื่อความสุขของครอบครัวผมเองก็เหมือนกันอยากรวยเลยแหละครับ แต่อยากให้มองหลักความเป็นจริงโดยแยกมุมมองดังนี้ครับ เราทุกคนเกิดมามีกรรมเป็นของตนเอง เกิดมาจากกรรมบันดาล คนที่เทรดได้บางคนสัปดาห์เดียวก็เทรดได้ มันไม่ใช่ความบังเอิญครับ มันคือกรรมจัดสรร กรรมดีของแต่ล่ะคนตั้งแต่อดีตภพชาติ และแรงอธิษฐานจิตมันก็มีไม่เท่ากันแล้ว บางคนไม่ได้อธิษฐานอะไรเลยด้วยซ้ำเขากลับเทรดได้เลยออกจะออกแนวขี้เกียจซะด้วยซ้ำ แต่ทั้งหมดมันคือผลจากกรรมเก่าที่เขาสร้างมาส่งผลมาให้เขาทำอะไรได้โดยไม่ต้องออกแรงแม้แต่น้อยแต่คำว่าไม่ออกแรงก็ไม่ใช่ทั้งหมดเราไม่รู้หลอกว่าก่อนที่เขาทำได้ก่อนนั้นเขาเจออะไรหนักหนาสาหัสมามากเพียงใด เราเห็นแต่ตอนนี้ที่เขาทำได้แล้วรวยมากไง
แต่บางคนอยากรู้อยากเข้าใจ แต่ก็ไม่คิดจะเรียนรู้และหาคำตอบ จ้องแต่จะตั้งคำถามแบบไม่หาคำตอบรอให้คำตอบมันลอยมาหา ซึ่งมันเป็นไปไม่ได้ครับ กรรมส่งผลได้จริงแต่ก็ต้องอยู่ที่ตัวเราปัจจุบันนี้เป็นอย่างไรด้วยนะครับ อยากเทรดได้อยากรู้แต่ไม่คิดหาจุดเริ่มต้นก็จะไม่เข้าใจอะไรเหมือนเดิมนะครับ สิ่งที่จะบอกทั้งหมดมันขึ้นกับตัวเราตั้งใจทำสิ่งไดในวันนี้ผลของกรรมที่สะสมไว้ก็จะช่วยสนับสนุนเราให้ประสบความสำเร็จ
เชื่อเรื่องบุญมีแต่กรรมบังไหมครับ ขอยกตัวอย่างตัวเองเลยนะครับ บุญมีที่ได้รู้จักกราฟ แต่กรรมบังคือเรียนรู้มาจนวันนี้10กว่าปีตั้งแต่ลูกคนโตเรียนเตรียมอนุบาล จนวันนี้ลูกจะเรียนจบมหาวิทยาลัยแล้ว ยังวนในอ่างไม่ไปถึงไหนเลย เพราะอะไรครับเพราะตัวเราเองไม่คิดจะหาความรู้จากการเรียน(กรรมบังตา)แต่เลือกที่จะหาความรู้เองทั้งหมดนั้นคือสิ่งที่ตัวเราเลือกเองขวากหนามระหว่างทางเต็มไปหมด ต้องอดทนเท่านั้นครับถ้าไม่ไหมก็กลับไปทำงานเหมือนเดิมถ้ายังเชื่อมั่นกับสิ่งนี้ก็ตั้งใจฝึกฝนต่อไปเรื่อยๆครับ มองดูตัวเองว่าเราบกพร่องตรงไหนส่วนนี้เราต้องพิจารณาตัวเองให้ได้แล้วค่อยๆแก้ไป
สรุปข้อความทั้งหมดคือ
ไม่รู้อย่าเสียเวลาหาข้อมูลครับลงคอร์สเรียนเพื่อลดเวลา คอร์สมีให้เลือกเยอะมากๆหาใน google ai Youtube fb tt tele เลือกเอาตามความชอบของตัวเอง เลือกเอาที่มันราคาไม่แพงเพื่อแรกกับความรู้พื้นฐานก่อนครับ ถ้าไม่เรียนนั้นคือกรรมชั่วบังตาเราไม่ให้เราสำเร็จ เพื่อจะทำให้ครอบครัวเรายากลำบากตตลอดไป และตัวเรายังเป็นตัวนำที่ยังม่พร้อมจะรับมากพอ ต้องปรับที่ตัวเรา ณ ปัจจุบันก่อนครับ ถ้าคิดแล้วทำนั้นคือกรรมดีส่งผลให้เราเรียนรู้ได้ไว้ขึ้น อยากรู้อะไร ถามครูฝึกสอนครับ ให้เขาจับมือเราทำไปเลยครับ เขาจะสอนตั้งแต่ พื้นฐานจนเปิดพอร์ตให้เทรด เปิดกับโบรกเกอร์อะไร ตรวจสอบแหล่งที่มาโบรกเกอร์ได้อย่างไร
ความเห็นส่วนตัวนะครับอย่ารีบล้างพอร์ตเลยครับ เรียนรู้ให้มาก ใช้เครื่องมือใช้โปรแกรมให้เป็นก่อน เหมือนกับเราเล่นเกมนั้นแหละให้รู้จักปุ่มคำสั่งต่างๆก่อนแล้วทำให้คล่องก่อน เหมือนกับเอาจิตเราเข้าไปในร่างของอวตารแล้วใช้ร่างกายนั้นให้คล่องก่อนประมาณนั้นครับ
เปิดพอร์ตเดโม่ให้เป็นก่อน ฝึกไปก่อน มีงานมีการหลักทำอยู่ก็ทำไปก่อนครับ
อย่ารีบอย่าโลภครับ เมื่อเรารู้เราเห็นให้บอกกับตัวเองอ๋อเรารู้เราเห็นแล้วเราเฉยๆไม่เห็นมีอะไร แล้วเอาสิ่งนั้นมาพิจารณาเพิ่มเติมอย่างละเอียดดีกว่านะครับ
ไม่ได้พูดนานแล้ว การวิเคราะห์นี้คือบันทึกการฝึกหาจุดเข้าส่วนตัวไม่ใช่การส่งซิกแนลการเทรดใดๆทั้งสิ้นเป็บสมุดบันทึกการเทรดส่วนตัว
เพียงแต่นำมาเพื่อให้ผู้ที่ได้เห็นได้ไปฝึกใช้ให้เข้ากับแนวทางการเทรดของตนเองหรือผู้เรียนรู้ใหม่ได้รู้จักตั้งไข่แบบใดยืนให้ได้ด้วยตนเองควรเริ่มเรียนรู้สิ่งใด
ควรฝึกตั้งคำถามและหาคำตอบให้ตนเองเท่านั้น
ไอเดียชุมชน

ฝึกอ่านกราฟเพื่อหาจุดเข้าซื้อให้แม่นยำยิ่งขึ้นไม่ได้พูดนานแล้ว การวิเคราะห์นี้คือบันทึกการฝึกหาจุดเข้าส่วนตัวไม่ใช่การส่งซิกแนลการเทรดใดๆทั้งสิ้นเป็บสมุดบันทึกการเทรดส่วนตัวเพียงแต่นำมาเพื่อให้ผู้ที่ได้เห็นได้ไปฝึกใช้ให้เข้ากับแนวทางการเทรดของตนเองหรือผู้เรียนรู้ใหม่ได้รู้จักตั้งไข่แบบใดยืนให้ได้ด้วยตนเองควรเริ่มเรียนรู้สิ่งใด ควรฝึกตั้งคำถามและหาคำตอบให้ตนเองเท่านั้น

ฝึกอ่านกราฟหาจุดเข้าให้คมที่สุดไม่ได้พูดนานแล้ว การวิเคราะห์นี้คือบันทึกการฝึกหาจุดเข้าส่วนตัวไม่ใช่การส่งซิกแนลการเทรดใดๆทั้งสิ้นเป็นสมุดบันทึกการเทรดส่วนตัวเพียงแต่นำมาเพื่อให้ผู้ที่ได้เห็นได้ไปฝึกใช้ให้เข้ากับแนวทางการเทรดของตนเองหรือผู้เรียนรู้ใหม่ได้รู้จักตั้งไข่แบบใดยืนให้ได้ด้วยตนเองควรเริ่มเรียนรู้สิ่งใด ควรฝึกตั้งคำถามและหาคำตอบให้ตนเองเท่านั้น

ตลาดทองคำร่วงอย่างหนัก – เงินกำลังถูกบดขยี้ในขณะที่เทรดเดอร์ส่วนใหญ่ยังคิดว่าทองคำแค่ "ปรับตัวลงเล็กน้อย"
แต่ความจริงแล้วตลาดกำลังทำอย่างอื่น: บดขยี้เงิน
นี่ไม่ใช่การร่วงลงแบบสุ่ม
นี่คือกระบวนการบดขยี้อารมณ์และบัญชีของคนส่วนใหญ่
1. ทองคำไม่ได้ร่วงลง – ทองคำกำลังบริสุทธิ์ขึ้น
ทุกครั้งที่ทองคำ "ร่วงลงอย่างหนัก" ตลาดกำลัง:
กวาดล้างคำสั่งหยุดขาดทุนของนักลงทุนรายย่อย
บังคับให้ตำแหน่งซื้อระยะยาวที่อ่อนแอต้องปิดตัวลง
ดึงดูดความกลัวที่จะพลาดโอกาส (FOMO) ก่อนที่จะเปลี่ยนทิศทาง
เงินไม่ได้หายไป – มันแค่เปลี่ยนมือ
2. ทำไมเทรดเดอร์ถึงขาดทุนในช่วงที่ตลาดทองคำร่วงลงอย่างหนัก?
เพราะพวกเขา:
ซื้อที่จุดต่ำสุดเร็วเกินไป
ถือตำแหน่งซื้อระยะยาวในขณะที่ตลาดยังคงกระจายตัว
เชื่อใน "ข่าวดี" แทนที่จะพิจารณาการเคลื่อนไหวของราคา
👉 ทองคำไม่สนใจว่าคุณคิดอย่างไร
👉 ทองคำตอบสนองต่อสภาพคล่องเท่านั้น
3. สัญญาณของการร่วงลงของตลาดทองคำ
หากคุณเห็น:
ความผันผวนเพิ่มขึ้น แต่โครงสร้างอ่อนแอ
การทะลุแนวต้านแต่ไม่มีการต่อเนื่อง
ปฏิกิริยาของราคาที่รุนแรงในโซนอุปทานเดิม
นี่คือโซนการร่วงลง – จุดที่เงินถูกดึงออกไปเร็วที่สุด
4. นักลงทุนรายใหญ่ทำอย่างไรเมื่อทองคำร่วงลง?
นักลงทุนรายใหญ่:
อย่าซื้อที่จุดต่ำสุด
อย่าซื้อขายตรงกลางกราฟ
เข้าซื้อขายเฉพาะเมื่อคนส่วนใหญ่หมดความอดทนแล้ว
เมื่อนักลงทุนรายย่อยตื่นตระหนก เงินจะเริ่มสะสม
5. บทเรียนที่สำคัญที่สุด
การร่วงลงของตลาดทองคำไม่ได้เกี่ยวกับการซื้อขายอย่างหนัก
แต่เกี่ยวกับ:
การรักษาเงินทุน
การรอการยืนยัน
การซื้อขายเฉพาะเมื่อความน่าจะเป็นอยู่ในฝั่งของคุณอย่างชัดเจน
👉 ไม่ขาดทุนในช่วงการร่วงลง = ชนะแล้ว
ตลาดทองคำตกต่ำ
= การทดสอบทางจิตวิทยา
= การโอนเงิน
= โอกาสสำหรับผู้ป่วย
คุณไม่จำเป็นต้องทำนายจุดต่ำสุด
คุณแค่ต้องหลีกเลี่ยงการตกเป็นเหยื่อ

ฝึกอ่านกราฟเพื่อหาจุดเข้าซื้อให้แม่นยำยิ่งขึ้นกำหนดแผนรอกราฟวิ่งเข้ามาตามแผนวิ่งมาในแผนไหนกำหนดเงื่อนไขจุดเข้าซื้อตามแผน

ฝึกอ่านกราฟการเรียนรู้ในรูปแบบพุทธศาสนา (พุทธวิธี) สามารถแบ่งออกเป็นหลายลักษณะตามบริบทของการศึกษาและการปฏิบัติ โดยมีขั้นตอนสำคัญที่นิยมอ้างถึงดังนี้:
1. ขั้นตอนการเรียนรู้เพื่อสร้างปัญญา (ปัญญา 3)
หัวใจสำคัญของการเรียนรู้ในพุทธศาสนาคือการสร้างปัญญา ซึ่งมี 3 ขั้นตอนหลัก:
สุตมยปัญญา: การเรียนรู้จากการฟัง การอ่าน หรือการรับข้อมูลจากภายนอก (เรียนรู้จากผู้อื่น)
จินตามยปัญญา: การนำสิ่งที่เรียนรู้มาคิดวิเคราะห์ พิจารณาด้วยเหตุผลจนเกิดความเข้าใจของตนเอง
ภาวนามยปัญญา: การลงมือปฏิบัติจริงจนเกิดเห็นแจ้งและเข้าใจความจริงด้วยประสบการณ์ตรง
2. ขั้นตอนการสอนและถ่ายทอด (พุทธลีลา 4)
ในการจัดการเรียนรู้หรือการสอน พระพุทธเจ้าทรงใช้หลัก "4 ส." เพื่อให้ผู้เรียนเข้าถึงเนื้อหาได้ง่าย:
สันทัสสนา (ชี้ให้ชัด): อธิบายเนื้อหาให้ชัดเจน เข้าใจง่าย
สมาทปนา (ชวนให้ปฏิบัติ): จูงใจให้ผู้เรียนเห็นประโยชน์และอยากนำไปใช้
สมุตเตชนา (เร้าให้แกล้วกล้า): ให้กำลังใจ ให้ผู้เรียนมีความมั่นใจในการเผชิญอุปสรรค
สัมปหังสนา (ชโลมใจให้ร่าเริง): สร้างบรรยากาศการเรียนรู้ที่สดชื่น ไม่เคร่งเครียดเกินไป
3. กระบวนการเรียนรู้สู่ความสำเร็จ (อิทธิบาท 4)
หากมองในแง่ของ "วิธีการ" ที่ผู้เรียนใช้เพื่อประสบความสำเร็จในการศึกษา จะประกอบด้วย:
ฉันทะ: ความรักและความพึงพอใจในสิ่งที่เรียน
วิริยะ: ความพยายามพากเพียรไม่ท้อถอย
จิตตะ: ความตั้งใจจดจ่อและมีสมาธิกับบทเรียน
วิมังสา: การหมั่นทบทวน ตรวจสอบ และปรับปรุงวิธีการเรียนรู้
4. ลำดับการฝึกฝน (ไตรสิกขา)
ในระดับของการพัฒนาตนเองอย่างเป็นระบบ การเรียนรู้จะดำเนินไปตามลำดับ 3 ขั้น:
ศีล (Sila): การฝึกฝนด้านพฤติกรรมและการอยู่ร่วมกับผู้อื่น (วินัย)
สมาธิ (Samadhi): การฝึกฝนด้านจิตใจ ให้มั่นคงและมีพลัง (ความตั้งใจ)
ปัญญา (Panna): การฝึกฝนด้านความรู้ความเข้าใจ (ความฉลาดรู้จริง)
นอกจากนี้ ในเชิงการแก้ปัญหา พระพุทธเจ้ายังทรงสอนให้ใช้ขั้นตอนของ อริยสัจ 4 (ทุกข์ สมุทัย นิโรธ มรรค) เพื่อระบุปัญหา ค้นหาสาเหตุ ตั้งเป้าหมาย และหาวิธีปฏิบัติเพื่อแก้ปัญหานั้นอย่างมีเหตุผล

ความลับในการซื้อขายอย่างชาญฉลาดทำไมบางคนเทรด “ถูกทาง” บ่อย แต่ account ไม่เคยโต?
ถ้าคุณเทรดมานานพอ คุณจะเจอความจริงที่เจ็บปวด:
Trader ที่ขาดทุน ไม่ได้ขาดความรู้
แต่ขาด วินัยในการจัดการเงิน
ตลาดเดียวกัน – ผลลัพธ์ต่างกันสุดขั้ว
Trader A (ฝั่งซ้ายของกราฟ)
• เทรดน้อย
• รอเงื่อนไขชัดเจน
• ยอมพลาดโอกาส
• เน้นปกป้อง equity
Trader B (ฝั่งขวาของกราฟ)
• มี order ตลอดเวลา
• กลัวพลาด (FOMO)
• ถัวเมื่อขาดทุน
• ใช้อารมณ์ตัดสินใจ exit
👉 ใช้ indicator เหมือนกัน แต่ผลลัพธ์ตรงข้ามกัน
หัวใจสำคัญ: Smart Trading ไม่ได้อยู่ที่ ENTRY
Trader ส่วนใหญ่โฟกัสที่:
• Entry สวย
• จับ top / bottom
• RR สูงตามทฤษฎี
Trader ที่อยู่รอดโฟกัสที่:
• เมื่อไหร่ไม่ควรเทรด
• เมื่อไหร่ควรพอ
• เมื่อไหร่ควร protect profit
👉 Entry ให้แค่โอกาส
👉 การจัดการออเดอร์คือสิ่งที่รักษาเงินคุณไว้
Smart Trading Secrets
• ไม่พยายามพิสูจน์ว่าตัวเองถูก
• ไม่รีบแก้มือหลังขาดทุน
• ไม่ปล่อยกำไรกลายเป็นขาดทุน
• เข้าใจว่า market อยู่ตลอด แต่ account ไม่ใช่
👉 Trader ที่อยู่รอดได้นาน คือคนที่มีโอกาสรวย
คุณเสียเงินมากที่สุดตอนไหน?
ตอนขาดทุน… หรือมีกำไรแต่ไม่ยอมออก?
สรุป
Smart Trading ไม่ใช่การเทรดให้มากขึ้น
แต่คือการเทรดให้น้อยลง และ รักษาทุนให้ได้
ถ้าคุณเห็นตัวเองในบทความนี้ แสดงว่าคุณมาถูกทางแล้ว

สอนวางระบบเทรดเบื้องต้นให้ความรู้ความเข้าใจแก่นของระบบเทรดเบื้องต้นเพื่อที่จะนำไปต่อยอดในระดับสูงดีเยี่ยมขึ้นไป

XAUUSD 1R Trading Analysis Summary (SELL)Context:
- Price pushed into the upper range after a short-term rebound.
- Overall market structure remains range-bound with no valid upside breakout.
- KZ21 is acting as dynamic resistance within the current range.
Signal:
- Clear rejection at KZ21 and the upper range boundary.
- Sellers stepped in immediately after the test, with no acceptance above resistance.
- Price behavior shows a failed attempt to hold higher levels.
Action:
- Sell executed at the rejection of KZ21 / upper range.
- Entry follows a mean-reversion approach inside a ranging market.
Strategy (1:1):
- Risk: Stop loss placed above the rejection high / above the range top.
- Reward: Take profit set at 1R targeting the mid-range or lower range area.
Insight:
- In a sideways market, fading the range extremes offers better edge.
- No need to hold through extended volatility; quick execution is key.
- Clean 1R setup with clear structure, controlled risk, and disciplined execution.

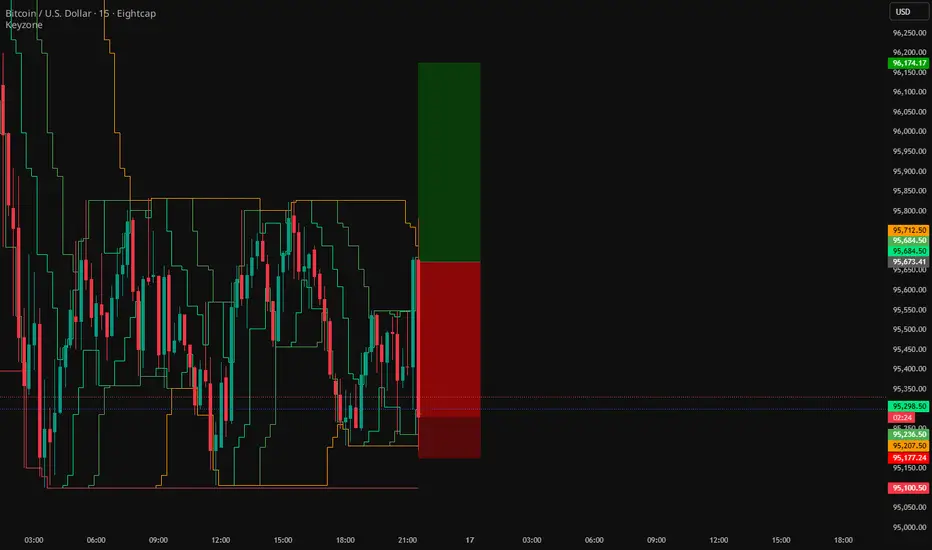
BTC 1R Trading Analysis Summary (BUY)Context:
- Price pulled back into the KZ21 zone after a short-term sell-off.
- Overall structure remains range-bound with no valid downside breakdown.
- KZ21 is acting as dynamic support inside the current range.
Signal:
- Multiple rejections around KZ21 / range low with no clean close below.
- Buyers stepped in with a clear bullish reaction and acceptance above support.
- Selling pressure weakened → short-term control shifted to buyers.
Action:
- Buy executed on acceptance above KZ21 after a clear rejection.
- Entry aligns with mean-reversion behavior inside the range (not chasing).
Strategy (1:1):
- Risk: Stop loss placed below the rejection low / below the range floor.
- Reward: Take profit set at 1R targeting the upper range / intraday resistance.
Insight:
- In a ranging market, fading the lower boundary offers better edge than trend-chasing.
- Focus on quick execution and strict risk control; no need to hold for extended moves.
- Clean 1R setup: clear structure, measurable R, easy to follow the plan.
USDJPY 1R Trading Analysis Summary (SELL)Context:
- Price rallied back into the KZ21 zone after a short-term bounce.
- Overall market structure remains range-bound with no valid bullish breakout.
- KZ21 is acting as a clear dynamic resistance in the current structure.
Signal:
- Clear rejection at KZ21 with bearish reaction.
- Buyers failed to hold price above resistance, showing acceptance failure.
Action:
- Sell executed at the KZ21 rejection.
- Entry follows mean-reversion behavior inside the range.
Strategy (1:1):
- Risk: Stop loss placed above the KZ21 rejection high.
- Reward: Take profit set at 1R targeting the lower range / intraday support.
Insight:
- Failure to accept above KZ21 favors fading the rally.
- Clean 1R setup with controlled risk, no need to hold through volatility.

EURUSD 1R Trading Analysis Summary (BUY)Context:
- Price dropped aggressively into the lower Keyzone area after a sustained bearish move.
- Overall structure remains range-bound with no clean continuation breakdown.
- KZ21 aligns as a key dynamic support after the impulsive sell-off.
Signal:
- Strong bullish rejection from the lower zone with clear downside failure.
- Sellers failed to hold price below support, signaling exhaustion.
Action:
- Buy executed at the rejection from KZ21 support.
- Entry follows mean-reversion behavior after a liquidity sweep.
Strategy (1:1):
- Risk: Stop loss placed below the impulse low / rejection wick.
- Reward: Take profit set at 1R targeting intraday resistance / mid-range.
Insight:
- Failed breakdown below KZ21 favors a rebound trade.
- Clean 1R setup with controlled risk, suitable for quick execution.


RIGHT TRADES – ทำไมเข้าออเดอร์ถูก แต่พอร์ตไม่โตเทรดเดอร์จำนวนมากมี ทิศทางถูก, setup ถูก และการวิเคราะห์ถูกต้อง
แต่ equity ไม่ขยับ หรือค่อย ๆ ลดลงในระยะยาว
ปัญหา ไม่ใช่ที่ trade
แต่คือ วิธีที่คุณ trade
ความจริงที่ยอมรับยาก
แม้จะมี winrate 60–70% ก็ยังไม่ทำกำไร หาก:
R:R ต่ำ เพราะปิดกำไรเร็วเกินไป
ตัดขาดทุนช้า แต่ปิดกำไรเร็ว
เพิ่ม lot size หลังจากชนะติดกัน
เข้า trade หลายออเดอร์เล็ก แทนที่จะรอออเดอร์คุณภาพ
👉 ตลาดให้รางวัลกับ risk management ไม่ใช่แค่การเดาทิศทางถูก
RIGHT TRADES ≠ RIGHT MONEY
การเข้าออเดอร์ถูก เป็นแค่เงื่อนไขจำเป็น ไม่ใช่คำตอบสุดท้าย
พอร์ตจะโตได้เมื่อ:
คุณปกป้องทุนตอนผิด
และปล่อยให้กำไรเติบโตตอนถูก
เทรดเดอร์ที่แพ้ระยะยาว นับจำนวนออเดอร์ถูก
เทรดเดอร์มืออาชีพ นับเงินที่รักษาไว้ได้หลังจบแต่ละรอบ
🎯 มุมมองของมืออาชีพ
ก่อนเข้า trade ทุกครั้ง ให้ถามตัวเอง:
ออเดอร์นี้คุ้มกับความเสี่ยงไหม?
ถ้าผิด จะเสียกี่ %?
ถ้าถูก จะให้ตลาดจ่ายได้แค่ไหน?
👉 ไม่ใช่เข้าให้ถูกมากขึ้น แต่ทำเงินให้ได้มากขึ้นจากออเดอร์ที่ถูก

USDJPY 1R Trading Analysis Summary (SELL) Context:
- Price extended higher but started to lose momentum near the upper range
- Short-term structure shows exhaustion after a failed higher high
- KZ21 is acting as dynamic resistance
Signal:
- Strong rejection at KZ21 with immediate bearish reaction
- Candle closed below resistance, confirming failed continuation
Action:
- Sell executed at the KZ21 rejection
- Entry follows mean-reversion behavior inside the range
Strategy (1:1):
- Risk: Stop loss placed above the KZ21 rejection high
- Reward: Take profit set at 1R toward the lower range / intraday support
Insight:
- Failure to accept above KZ21 favors fading the move
- Clean 1R setup with controlled risk and quick execution

EURUSD 1R Trading Analysis Summary (BUY) – ENContext:
- Price bounced from the lower range and formed higher lows
- Short-term structure shifted from range to bullish bias
- KZ21 is starting to act as dynamic support
Signal:
- Price pulled back into KZ21 and showed an immediate bullish reaction
- No acceptance below support, sellers failed to push lower
Action:
- Buy executed on the bounce from KZ21
- Entry aligns with structure-following and mean-reversion behavior
Strategy (1:1):
- Risk: Stop loss placed below the KZ21 rejection low
- Reward: Take profit set at 1R toward the upper range / intraday high
Insight:
- Buying at KZ21 after structure shift offers higher probability
- Clean 1R setup with tight risk and clear execution

XAU 1R Trading Analysis Summary (BUY) – ENContext:
- Gold price remains in a bullish structure with higher lows
- Market is holding above key Keyzone levels despite short consolidations
- KZ21 is acting as a dynamic support
Signal:
- Price pulled back into KZ21 and showed a strong bullish reaction
- No acceptance below support, selling pressure failed
Action:
- Buy executed on the bounce from KZ21
- Entry follows trend-continuation behavior
Strategy (1:1):
- Risk: Stop loss placed below the KZ21 rejection low
- Reward: Take profit set at 1R toward the upper range / intraday high
Insight:
- Buying at KZ21 support aligns with trend and structure
- Clean 1R setup with controlled risk and high execution clarity

BTC 1R Trading Analysis Summary (SELL) – ENContext:
- Price pushed into the KZ21 zone after a short-term rally
- Overall market structure remains range-bound with no valid breakout
- KZ21 is acting as a clear dynamic resistance
Signal:
- Strong rejection at KZ21 with upper wick formation
- Buyers failed to accept price above resistance
Action:
- Sell executed at the KZ21 rejection
- Entry follows mean-reversion behavior inside the range
Strategy (1:1):
- Risk: Stop loss placed above the KZ21 rejection high
- Reward: Take profit set at 1R targeting the lower range / intraday support
Insight:
- Failure to accept above KZ21 favors fading the move
- Clean 1R setup with controlled risk and no need to hold through volatility

XAUUSD 1R Trading Analysis Summary (BUY) สรุปไทยและอังกฤษ code fXAUUSD 1R Trading Analysis Summary (BUY)
Context:
- Price was in a sideways-to-accumulation phase earlier in the session.
- Strong bullish impulse broke above the intraday Keyzone resistance.
- Momentum expansion indicates buyers taking control.
Signal:
- Clear bullish continuation after breaking and holding above Keyzone.
- No immediate rejection, showing acceptance of higher prices.
Action:
- Buy executed after bullish breakout and acceptance.
- Entry aligned with momentum continuation, not anticipation.
Strategy (1:1):
- Risk: Stop loss placed below the breakout base / last Keyzone support.
- Reward: Take profit set at 1R near the upper intraday range.
Insight:
- Break-and-hold above Keyzone provides a high-quality BUY 1R setup.
- Momentum + acceptance beats early prediction in XAUUSD.

USDJPY 1R Trading Analysis Summary (SELL)Context:
- Price pushed up into the upper Keyzone area after a strong intraday move.
- Market shows loss of momentum near resistance.
- Structure shifts from trend to short-term range at the highs.
Signal:
- Clear rejection from the upper Keyzone resistance.
- Bearish reaction indicates failure to accept higher prices.
Action:
- Sell executed at rejection of the upper Keyzone.
- Entry aligned with mean-reversion from resistance.
Strategy (1:1):
- Risk: Stop loss placed above the rejection high.
- Reward: Take profit set at 1R toward the lower intraday support.
Insight:
- Selling at Keyzone resistance offers a clean 1R with tight risk.
- No breakout acceptance = fading the high-probability zone.

BTC 1R Trading Analysis Summary (SELL)Context:
- Price rallied into the KZ21 (orange line) after a short-term push.
- Overall structure remains range-bound with no strong continuation breakout.
- KZ21 acts as dynamic resistance in the current market condition.
Signal:
- Clear rejection at KZ21 with strong bearish reaction.
- Upper wick shows selling pressure and failed continuation above resistance.
Action:
- Sell executed at rejection of KZ21.
- Entry aligned with mean-reversion behavior inside the range.
Strategy (1:1):
- Risk: Stop loss placed above the KZ21 rejection high.
- Reward: Take profit set at 1R toward the lower range / intraday support.
Insight:
- Selling at KZ21 rejection offers a clean 1R setup with controlled risk.
- No breakout acceptance = fading the move is the higher-probability play.

EURUSD 1R Trading Analysis Summary (BUY)Context:
- Price aggressively sold into the lower Keyzone area.
- Sharp rejection from the downside indicates liquidity grab.
- Market remains range-based, favoring mean-reversion setups.
Signal:
- Strong bullish reaction from the lower Keyzone support.
- Long bullish candle shows clear acceptance back above support.
Action:
- Buy executed after downside rejection and bullish response.
- Entry aligned with bounce from Keyzone demand.
Strategy (1:1):
- Risk: Stop loss placed below the rejection low.
- Reward: Take profit set at 1R toward the upper intraday range.
Insight:
- Deep pullback into Keyzone with rejection provides a clean BUY 1R.
- Liquidity sweep followed by acceptance favors mean-reversion longs.

EURUSD 1R Trading Analysis Summary- Context: Price strongly rebounded from the Intraday Demand and formed a clear higher-low structure.
- Signal: A strong bullish impulse pushed price above the previous Intraday Supply.
- Action: Buy following momentum continuation after supply flipped into support.
- Strategy (1:1):
- Risk: Place SL below the previous Intraday Supply / latest higher low.
- Reward: Set TP at 1R near the upper KZ3 or next supply zone.
- Insight: Buying after a confirmed breakout with structure alignment provides a clean 1R setup with controlled risk.
