ทองคำใกล้ระดับวิกฤตก่อน NFP – การเคลื่อนไหวใหญ่กำลังมา?📉 บทวิเคราะห์ปัจจัยพื้นฐาน
ราคาทองคำยังคงอยู่ในแนวโน้มขาขึ้นอย่างแข็งแกร่ง โดยได้รับแรงหนุนจากปัจจัยเศรษฐกิจและการเมือง:
ตัวเลขจ้างงาน ADP แย่เกินคาด: การจ้างงานลดลง -33,000 ตำแหน่ง สวนทางกับที่คาดว่าจะเพิ่มขึ้น กดดันค่าเงินดอลลาร์ และเพิ่มความต้องการถือทองคำ
คาดการณ์ Fed ลดดอกเบี้ย: ตลาดประเมินว


Scott "Kidd" Poteetนักบินอวกาศที่ไม่คิดว่าจะได้เป็น

สถานที่ในโลกสร้างตลาด
เข้าร่วมกับเทรดเดอร์และนักลงทุน 100 ล้านคนที่กำหนดอนาคตด้วยมือของพวกเขาเอง

แผนเทรดทอง XAUUSD (H1) – รอสัญญาณจากการย่อ / เทสต์โซน #TRADERJ📉 แผนเทรดทอง XAUUSD (H1) – รอสัญญาณจากการย่อ / เทสต์โซน
📌 จากการวิเคราะห์ล่าสุด:
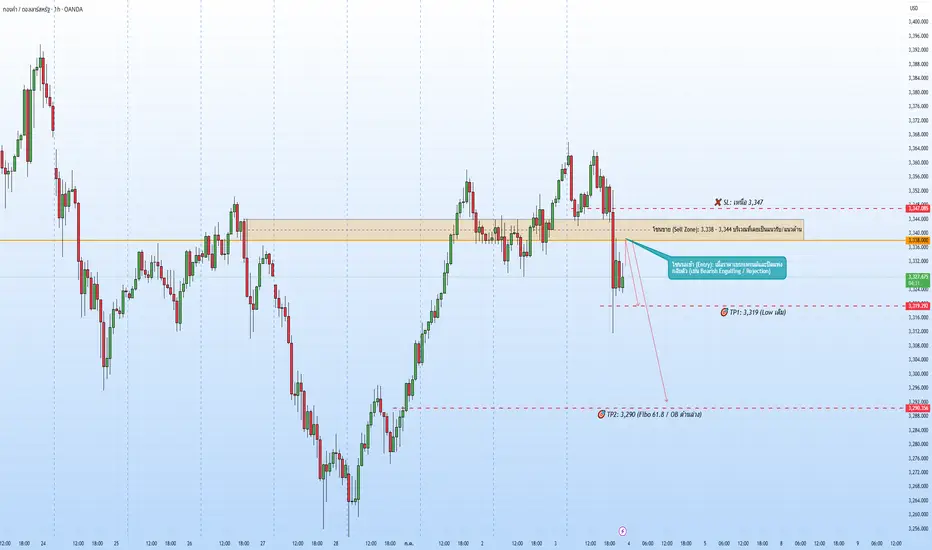
ราคาหลุดโครงสร้างสำคัญลงมาแรง พร้อมแรงเทขายชัดเจน 📉
ตอนนี้กำลังเข้าสู่ช่วง "พักฐาน" รอแรงใหม่เพื่อเทสต์กลับเข้าโซน Supply
📍 โซนรอเข้า: 3,338 – 3,344
🎯 TP แรก: 3,319
🎯 TP สอง: 3,290
⛔ SL: เหนือ 3,347
📌 เงื่อนไขการเข้า
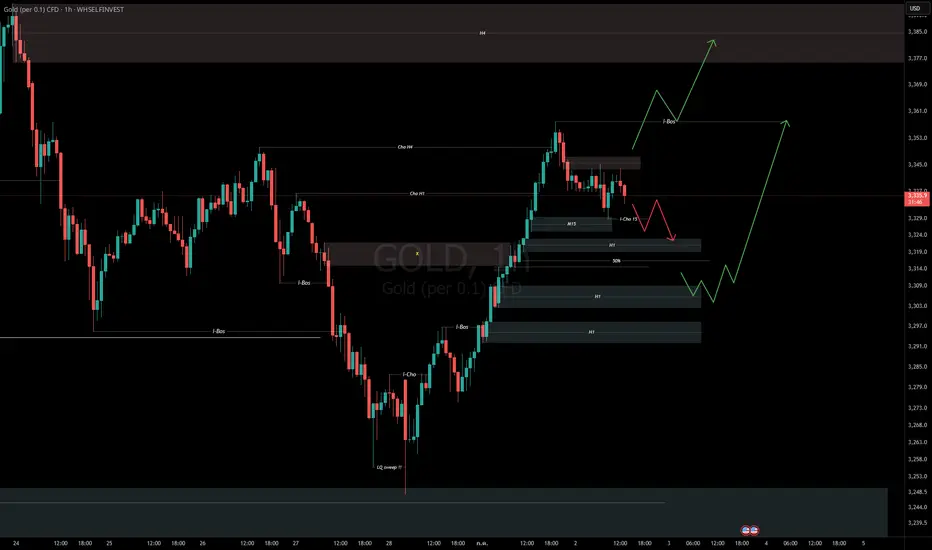
SMC GOLD 2/7/25240 มองเทียบ2กราฟ กราฟนึง Cho อักกราฟ เป็นการกวาด LQ
60 ราคาขึ้นไปทำลาย Supply ได้ demand ที่สามารถทำลายได้ ที่น่าสนใจคือ 3309
15 เป้นขาขึ้น Cho bos ถ้าจะBuy มี2กรณี
1. รอราคาBosออกไปอีกรอบ ก่อนแล้วค่อยหาDemandเพื่อBuyตามโครงสร้าง
2.ตอนนี่อยู่ในช่วง Pullback ของ M15 ซึ่งจะไปตรงกับการ Pullbackขอ
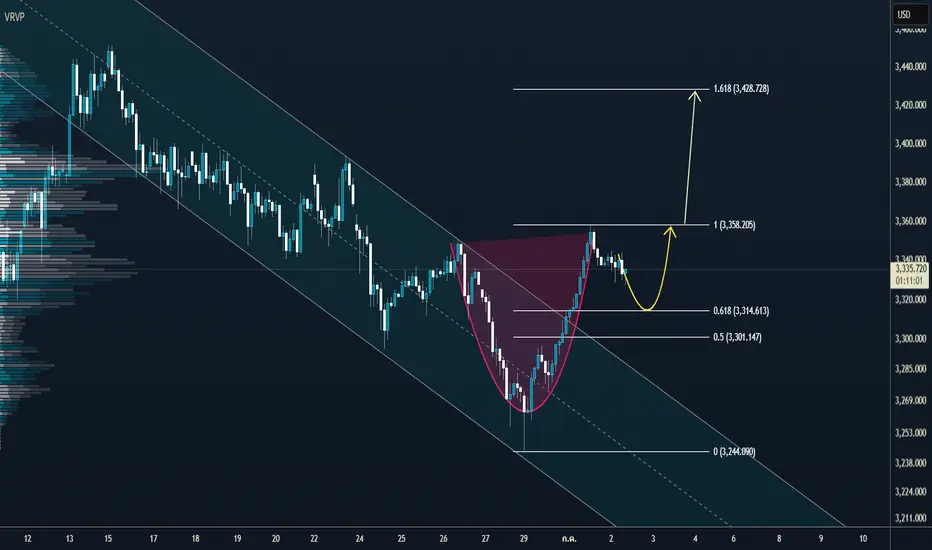
การกลับมาของทองคำ – เป้าหมายใหม่ 3,400 USDทองคำ (XAUUSD) ได้ทะลุออกจากช่องขาลงที่ลากยาวมาหลายวัน และกำลังก่อตัวเป็นรูปแบบ “ถ้วยและหูจับ” คลาสสิกบนกราฟ H2 ซึ่งเป็นสัญญาณบวกบ่งชี้ถึงแนวโน้มขาขึ้นที่อาจดำเนินต่อ โดยมีแรงซื้อใหม่คาดว่าจะเกิดขึ้นหลังการย่อตัวสิ้นสุด
ขณะนี้ราคาได้ปรับฐานกลับมาทดสอบบริเวณแนวรับ Fibonacci 0.5–0.618 (3,301–3,315 US
XAUUSD วีดีโอวางแผนเทรดทองคำวันที่ 2 ก.ค. 2568🟡 วิเคราะห์กราฟทองคำ (XAUUSD) ประจำวันที่ 2 ก.ค. 2568
🌐 ปัจจัยพื้นฐานสำคัญ
• ดัชนีดอลลาร์อ่อนค่าลง ต่ำกว่า 97 จุด (ล่าสุด 96.68) สนับสนุนราคาทอง
• ค่าเงินบาทแข็งค่า ทรงตัวที่ 32.46 บาท/$ → ทำให้ราคาทองไทยปรับขึ้นช้ากว่า
• SPDR ขายทองเพิ่ม 4.3 ตัน เหลือถือครอง 948.23 ตัน (ยังไม่มีผลกดดันชัดเจน)
• ตั

XAUUSD 30/06/25 ระยะกลางดีด test 3350.5 ไม่เบรค sw เลือกทางก่อนD : os 61.8 HL
240 : os 200
60 : ob 50 สะบัด 3244.4-3350.4
- แกว่งเลือกทางในกรอบ
15 : os 38.2
- กรอบ 3244.4-3296.8
.
กรณีขึ้น
- เบรค 3296.8 tf 15 พา 60 ob test 3350.4
- ลงไม่หลุด 3244.4 ฟอร์ม HL HH เบรคบนขึ้นได้
.
กรณีลง
- หลุด 3277.4 ลง test 3244.4
- หลุด 3244.4 ลงต่อ
- ไม่เบรค 3296.8 ฟอร์ม LL

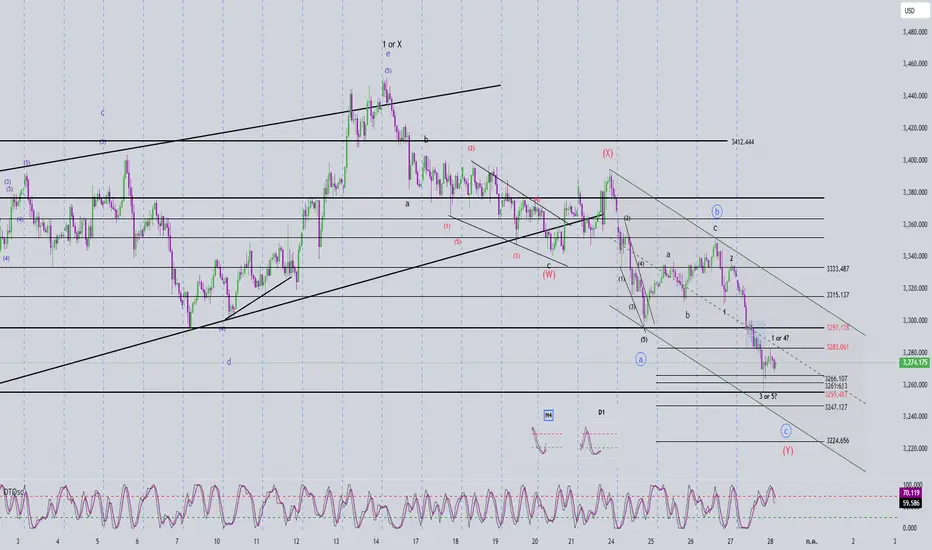
วิเคราะห์คลื่น Elliott – XAUUSD ประจำวันที่ 30 มิถุนายน 2025
🌀 โครงสร้างคลื่น Elliott
บนกราฟ H1 เราสังเกตเห็นโครงสร้างการปรับฐานแบบ ซิกแซกคู่ WXY (สีแดง) และในขณะนี้ คลื่น Y ดูเหมือนกำลังพัฒนาเป็น โครงสร้าง abc สีเขียว
ภายในโครงสร้าง abc นี้:
- คลื่น a เริ่มต้นด้วยรูปแบบ สามเหลี่ยมเริ่มต้น (leading diagonal) แบบ 5 คลื่น
- คลื่น b เป็นโครงสร้างการปรับฐานแบบ
BTCUSD Daily Analysis 28/6/2025 by TraderTan
📰 ข่าวต่างประเทศ
Bitcoin (BTC) ยังคงเคลื่อนไหวอย่างผันผวนในตลาด โดยได้รับอิทธิพลจากปัจจัยมหภาคและ sentiment ของนักลงทุน
ข่าวเศรษฐกิจโลกและการเปลี่ยนแปลงด้านกฎระเบียบของสินทรัพย์ดิจิทัลยังคงเป็นปัจจัยสำคัญที่ส่งผลต่อราคา Bitcoin รวมถึงกระแสการยอมรับจากองค์กรต่างๆ
นักลงทุนสถาบันและรายใหญ่ยังคงจับ
XAUUSD วีดีโอวางแผนเทรดทองคำวันที่ 30 มิ.ย. 2568🟡 วิเคราะห์กราฟทองคำ (XAUUSD) ประจำวันที่ 30 มิ.ย. 2568
💵ทองคําภาพรวมยังคงเคลื่อนไหวในลักษณะSideways ในกรอบกว้าง หลังจากที่มีการเจรจาหยุดยิงชั่วคราวระหว่างอิหร่านกับอิสราเอล โดยยังไม่มีความชัดเจนในด้านเจรจาและระดับความเสียหายเท่าไรนัก แต่คาดว่าน่าจะเกิดความเสียหายทั้งสองฝ่ายทั้งอิสราเอลและอิหร่าน

แรงขายสุดสัปดาห์แข็งแกร่ง หลุดทะลุต่ำกว่า 3,300ราคาทองคำ (XAU/USD) ตกอยู่ภายใต้แรงขายอีกครั้งในช่วงการซื้อขายในตลาดเอเชียเช้านี้ โดยลดลงต่ำกว่าระดับ 3,300 ดอลลาร์ หลังจากปรับตัวลดลงในวันก่อนหน้า โลหะมีค่านี้กำลังเคลื่อนตัวเข้าใกล้ระดับต่ำสุดในรอบ 2 สัปดาห์ที่เห็นในวันอังคาร ขณะที่นักลงทุนกำลังรอการประกาศดัชนีราคาการใช้จ่ายเพื่อการบริโภคส่วนบุคค

ดูไอเดียที่คัดสรรโดยบรรณาธิการทั้งหมด
True Close – Institutional Trading Sessions (Zeiierman)█ Overview
True Close – Institutional Trading Sessions (Zeiierman) is a professional-grade session mapping tool designed to help traders align with how institutions perceive the market’s true close. Unlike the textbook “daily close” used by retail traders, institutional desks often anchor their

Open Interest Footprint IQ [TradingIQ]Hello Traders!
Th e Open Interest Footprint IQ indicator is an advanced visualization tool designed for cryptocurrency markets. It provides a granular, real-time breakdown of open interest changes across different price levels, allowing traders to see how aggressive market participation is distribu

Zigzag CandlesCan't deny that I am obsessed with zigzags. Been doing some crazy experiments with it and have many more in pipeline. I believe zigzag can be used to derive better trend following methods. Here is an attempt to visualize zigzag as candlesticks. Next steps probably to derive moving average, atr (alth

MathStatisticsKernelFunctionsLibrary "MathStatisticsKernelFunctions"
TODO: add library description here
uniform(distance, bandwidth) Uniform kernel.
Parameters:
distance : float, distance to kernel origin.
bandwidth : float, default=1.0, bandwidth limiter to weight the kernel.
Returns: float.
triangular(distance

MathConstantsLibrary "MathConstants"
Mathematical Constants
E() The number e
Log2E() The number log (e)
Log10E() The number log (e)
Ln2() The number log (2)
Ln10() The number log (10)
LnPi() The number log (pi)
Ln2PiOver2() The number log (2*pi)/2
InvE() The number 1/e
SqrtE() The n

taLibrary "ta"
█ OVERVIEW
This library holds technical analysis functions calculating values for which no Pine built-in exists.
Look first. Then leap.
█ FUNCTIONS
cagr(entryTime, entryPrice, exitTime, exitPrice)
It calculates the "Compound Annual Growth Rate" between two points i

Tape [LucF]█ OVERVIEW
This script prints an ersatz of a trading console's "tape" section to the right of your chart. It displays the time, price and volume of each update of the chart's feed. It also calculates volume delta for the bar. As it calculates from realtime information, it will not display info

Dominance Pie ChartA different type of charting, the pie chart,
here for showing the available dominance on one chart,
together with the total % dominance per ticker and between brackets
the % rise/fall.
Can be used in every timeframe
(It is normal it takes some time to be loaded)
Cheers!

Circular Candlestick ChartAn original (but impractical) way to represent a candlestick chart using circles arc.
The most recent candles are further away from the circle origin. Note that OHLC values follow a clockwise direction. A higher arc length would indicate candles with a higher body or wick range.
The Length setti

Color█ OVERVIEW
This library is a Pine Script® programming tool for advanced color processing. It provides a comprehensive set of functions for specifying and analyzing colors in various color spaces, mixing and manipulating colors, calculating custom gradients and schemes, detecting contrast, and con

ดูอินดิเคเตอร์และกลยุทธ์ทั้งหมด
เทรนของชุมชน
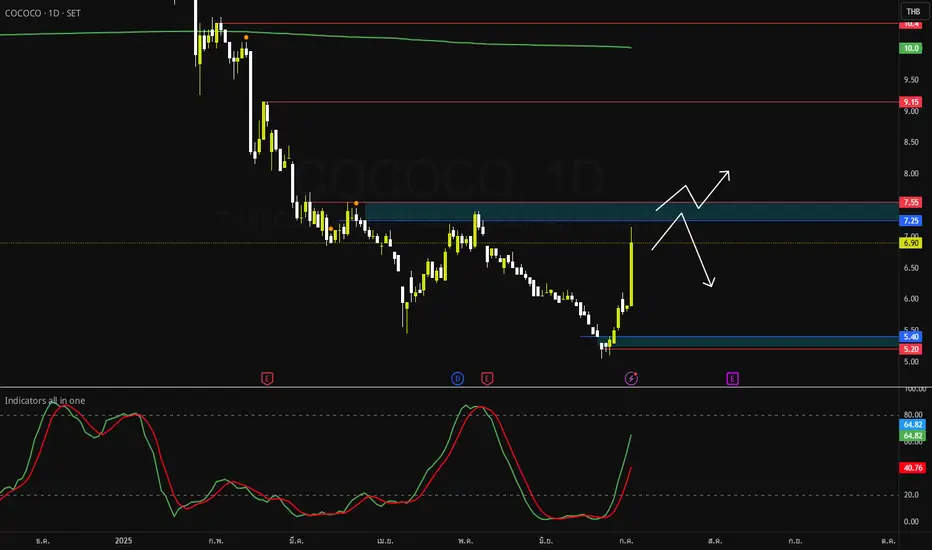
COCOCOบริษัท ไทย โคโคนัท จำกัด (มหาชน)
..................
ผลิตและจำหน่ายกะทิ น้ำมะพร้าว มะพร้าวแปรรูป อาหารสัตว์เลี้ยง และอาหารเพื่อสุขภาพรวมถึงชีสและเนยจากโปรตีนพืช
....................
💥เส้น V-wap = อยู่ที่ 10.00💥
💥P/E = 18.5 💥
💥EPS = 0.04 💥
💥P/BV = 2.72 💥
....................
📲💥ฝากกดติดตามผมด้วยนะครับ💥
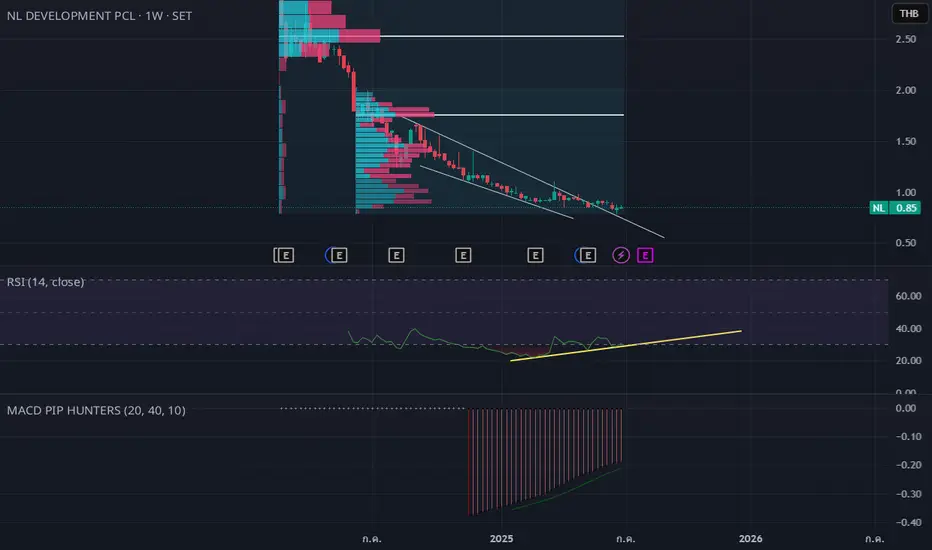
NL
กราฟกำลังแสดงสัญญาณกลับตัวเชิงเทคนิค (falling wedge + bullish divergence + momentum อ่อนแรง)
ราคาหุ้นอยู่ในช่วง ขาลงต่อเนื่อง มาระยะหนึ่ง โดยมีการฟอร์มเป็นลักษณะของ Falling Wedge ซึ่งเป็นสัญญาณทางเทคนิคที่มีโอกาสกลับตัวขึ้น (Bullish reversal pattern)
ล่าสุดราคาเริ่ม เบรกทะลุเส้นแนวโน
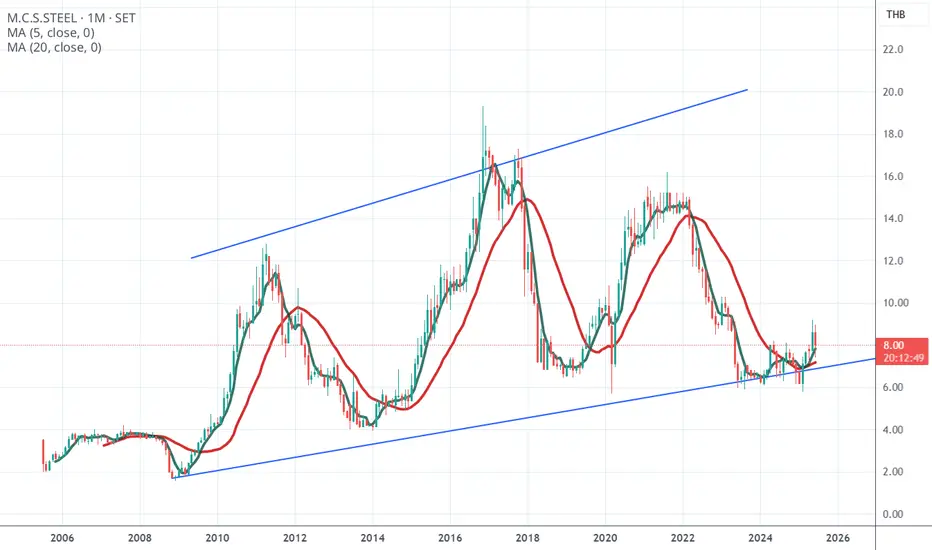
กราฟ MCS เดือน ตัดจากแนวรับล่างสุดกราฟเดือนเส้นสั้น ตัดเส้นยาว มาครับ ตัดขึ้นเรียบร้อย งบก็ไม่น่าเกลียด
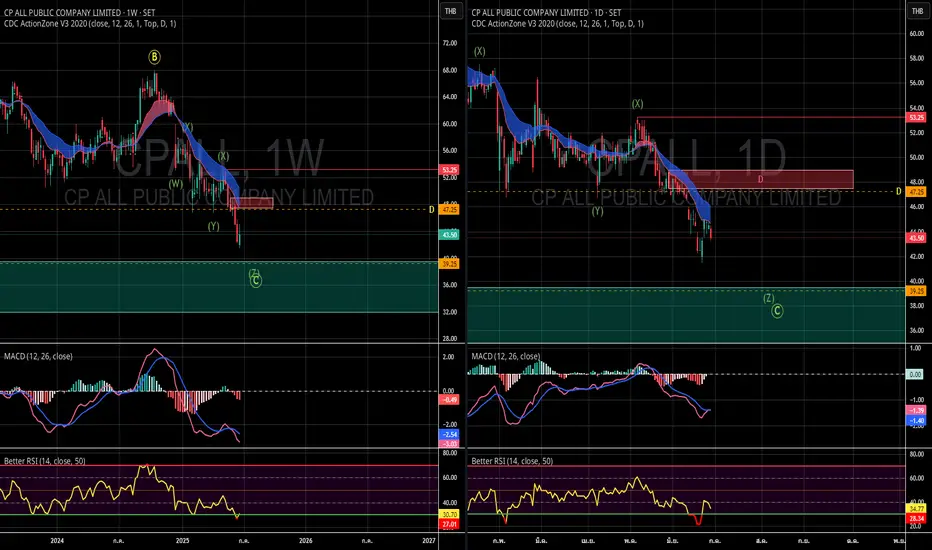
cpallมีโอกาสลงไปหาแถวๆ 40 บาท แต่ตรงนี้อาจจะมีการเด้งขึ้นไปแถวๆ 47.25 ก่อนลงไปแถวๆ 40 บาท ถ้าจะจบขาลงชุดนี้ ราคาจะต้องวิ่งขึ้นไปเบรค 53.25 ให้ได้ ถ้าเบรคได้ก็อาจจะไม่เห็น 40 บาท
วิเคราะห์คลื่น AOT แนวรับปรับฐาน ABC ของคลื่น 2 หลักจะลงไปถึงไหนโครงสร้างการปรับฐานคลื่น 2 หลัก ของ AOT เป็นรูปแบบ Expanded Flat Correction ABC มีลักษณะชัดเจน โดยเฉพาะถ้าคลื่น B วิ่งเกือบเท่าจุดเริ่มต้นของคลื่น A ที่ 79% และตอนนี้คลื่น C กำลังเข้าสู่ขาลงแบบ impulsive ซึ่งถ้าอยู่ในช่วงต้นของคลื่น 3 ของ C จริง ก็เป็นช่วงที่มีพลังแรงขายส่งมากที่สุด
wave A: เคลื่อน

ดูไอเดียเกี่ยวกับหุ้นทั้งหมด
7 ก.ค.
AEONTSAEON THANA SINSA(THAILAND)
ตามจริง
—
ประมาณการ
2.98
THB
15 ก.ค.
TISCOTISCO FINANCIAL GROUP PUBLIC CO LTD
ตามจริง
—
ประมาณการ
1.96
THB
17 ก.ค.
TSTHTATA STEEL(THAILAND) PUBLIC COMPANY
ตามจริง
—
ประมาณการ
—
17 ก.ค.
BAYBANK OF AYUDHYA PUBLIC COMPANY LTD
ตามจริง
—
ประมาณการ
1.04
THB
17 ก.ค.
LHFGLH FINANCIAL GROUP PCL
ตามจริง
—
ประมาณการ
—
17 ก.ค.
SCAPSRISAWAD CAPITAL 1969 PCL
ตามจริง
—
ประมาณการ
—
18 ก.ค.
TTBTMBTHANACHART BANK PCL
ตามจริง
—
ประมาณการ
0.05
THB
18 ก.ค.
KKPKIATNAKIN PHATRA BANK PCL
ตามจริง
—
ประมาณการ
1.31
THB
ดูเหตุการณ์เพิ่มเติม
ข่าวไม่โหลด
ดูท่าจะไม่ค่อยดี มาลองกันใหม่
เทรนของชุมชน
BTC วิเคราะห์ JUL-SEP📊 Elliott Wave Analysis: คลื่นใกล้จบขาขึ้นใหญ่
🔹 โครงสร้างปัจจุบัน: คลื่น 1-2-3-4-5 แบบ Impulse Wave
จากภาพรวมราคา นับได้เป็นโครงสร้าง Elliott Wave ครบ 5 คลื่นขาขึ้น โดย:
Wave 1 :
ราคา ยืดยาวที่สุดในเชิง “ราคา”
ใช้เวลานาน แต่ขึ้นอย่างมั่นคง
Wave 2 :
ปรับฐานด้วยรูปแบบที่ซับซ้อน
(ลักษณะคล้า


BTC/USD Daily Analysis 4/7/2025 by TraderTan
📰 ข่าวต่างประเทศ
ราคา Bitcoin ยังคงแกว่งตัว แต่มีแนวโน้มเชิงบวกจากกระแสการลงทุนใน ETF และความคาดหวังเรื่องดอกเบี้ย
นักลงทุนจับตาข้อมูลเศรษฐกิจสำคัญของสหรัฐฯ โดยเฉพาะรายงานการจ้างงานนอกภาคเกษตร ที่อาจส่งผลต่อทิศทางตลาดคริปโต
การรับรู้และการยอมรับ Bitcoin ในระดับสถาบันยังคงเพิ่มขึ้น ซึ่งเป็นปัจจ


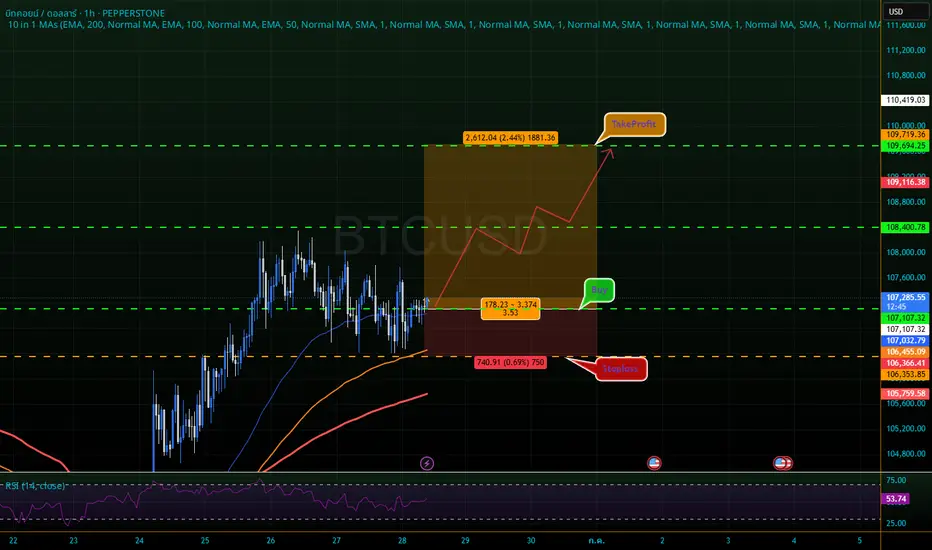
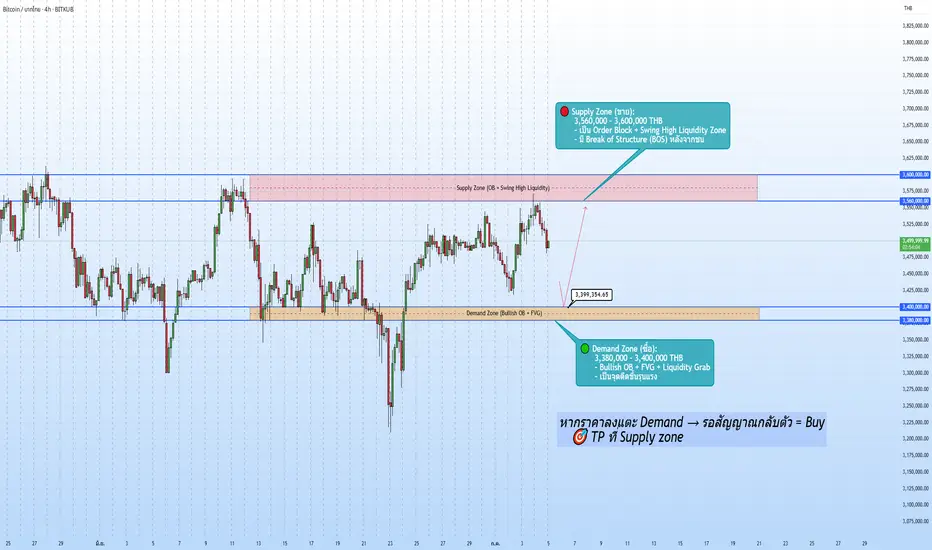
BTCTHB SMC Trade Plan | 1H วิเคราะห์กราฟ #TRADERJวิเคราะห์เเละวางเเผนเทรด BTCTHB 7-11 ก.ค.68
📍โซนสำคัญ:
🔴 Supply Zone (ขาย):
3,560,000 – 3,600,000 THB
– เป็น Order Block + Swing High Liquidity Zone
– มี Break of Structure (BOS) หลังจากชน
🟢 Demand Zone (ซื้อ):
3,380,000 – 3,400,000 THB
– Bullish OB + FVG + Liquidity Grab
– เป็นจุดดีดข


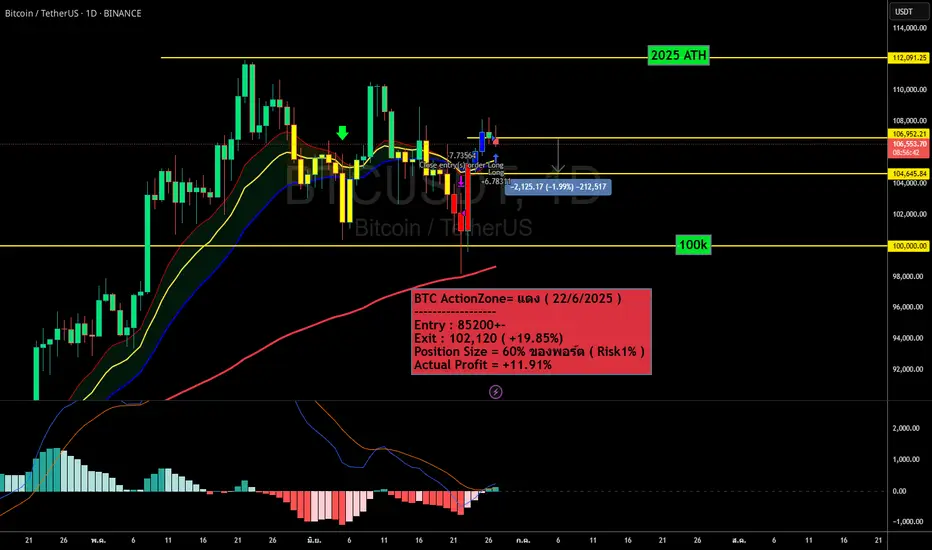
BTCUSD : ระบบ MACD ตัด 0 (ActionZone) มีสัญญาณ "ซื้อ" 27/6/2025อธิบาย : ระบบ Action Zone หรือ MACD ตัดศูนย์ คือระบบที่ใช้หลักการดูเส้น MACD ว่า เส้นนี้จะตัดกับเส้นศูนย์เมื่อไหร่ โดย ถ้าตัดขึ้นก็จะเป็นสัญญาณซื้อ ถ้าตัดลงก็จะเป็นสัญญาณขาย ถือเป็นระบบ Trend Following ที่ใช้ได้ดีกับตลาดที่มีเทรนจ๋าๆ เช่น BTC
แต่ระบบนี้ก็จะมีจุดอ่อนอยู่หลายจุดเช่นกัน คือ ในช่วงตลาด
ดูไอเดียเกี่ยวกับคริปโตทั้งหมด

XAU/USD Daily Analysis 4/7/2025 by TraderTan📰 ข่าวต่างประเทศ
ราคาทองคำยังคงได้รับแรงกดดันจากปัจจัยทางเทคนิคและการแข็งค่าของเงินดอลลาร์ในระยะสั้น
การคาดการณ์แนวโน้มอัตราดอกเบี้ยของธนาคารกลางสหรัฐฯ ยังคงเป็นปัจจัยสำคัญที่ส่งผลต่อทิศทางของราคาทองคำ
นักลงทุนจับตาข้อมูลเศรษฐกิจสำคัญและสถานการณ์ภูมิรัฐศาสตร์ที่อาจส่งผลให้เกิดแรงเทขายทำกำไรในตลาด

GOLD 07/04 - ตลาดทองคำเงียบเหงารอจังหวะระเบิดสภาพคล่องบางเบา เปิดโอกาสทองสำหรับนักล่าลิเควิดิตี้?
ราคาทองคำยังทรงตัวหลังจากสัปดาห์ที่เต็มไปด้วยข่าวมหภาค — ตั้งแต่การอนุมัติ "ซูเปอร์บิล" ของทรัมป์ ไปจนถึงตัวเลข NFP ที่ออกมาดีกว่าคาดการณ์ แต่ราคากลับไม่เคลื่อนไหวชัดเจน... ประกอบกับตลาดสหรัฐปิดทำการในวันชาติ ทำให้สภาพคล่องเบาบาง เสี่ยงต่อการเกิด

มุมมองทองคำประจำวันที่ 4 / 7 / 68🔴 Super Free Gold Forex 🔴
มุมมองทองคำประจำวันที่ 4 / 7 / 68
มุมมองให้ทางเซลได้เปรียบกว่าเล็กน้อย รอราคาเด้งขึ้นมาแล้วเซลน่าจะสวยกว่านะครับ
💥 หากมีข้อสงสัย หรือ คำถามเพิ่มเติม ส่งคอมเม้นไว้ หรือ กล่องข้อความได้นะครับ
🔥 อาจจะไม่ได้อัพเดทใน TradingView ทุกวันนะครับ รบกวนฝากกดติดตามไว้ด้วยนะครับ
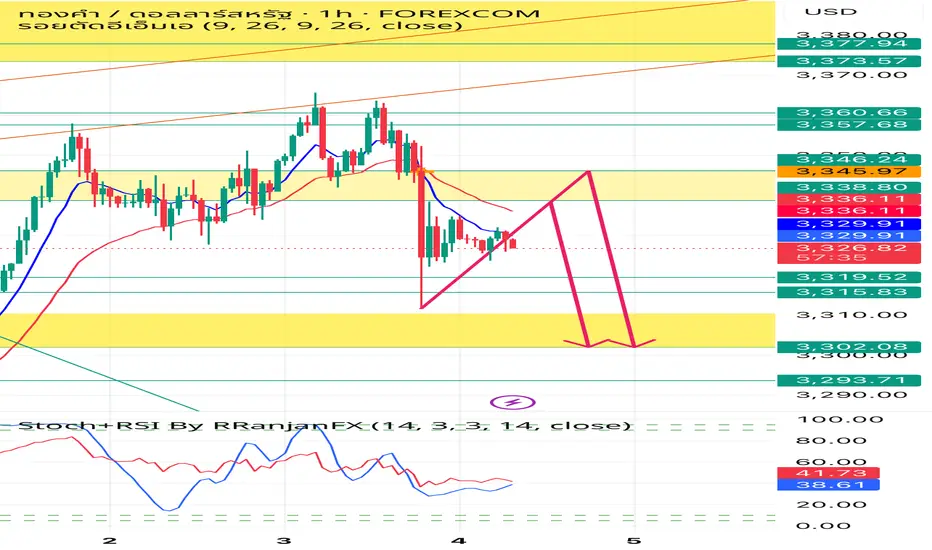
แผนเทรดทอง XAUUSD (H1) – รอสัญญาณจากการย่อ / เทสต์โซน #TRADERJ📉 แผนเทรดทอง XAUUSD (H1) – รอสัญญาณจากการย่อ / เทสต์โซน
📌 จากการวิเคราะห์ล่าสุด:
ราคาหลุดโครงสร้างสำคัญลงมาแรง พร้อมแรงเทขายชัดเจน 📉
ตอนนี้กำลังเข้าสู่ช่วง "พักฐาน" รอแรงใหม่เพื่อเทสต์กลับเข้าโซน Supply
📍 โซนรอเข้า: 3,338 – 3,344
🎯 TP แรก: 3,319
🎯 TP สอง: 3,290
⛔ SL: เหนือ 3,347
📌 เงื่อนไขการเข้า

วิเคราะห์คลื่นเอลเลียต – XAUUSD วันที่ 7 มีนาคม 2025
🌀 โครงสร้างคลื่นเอลเลียต
จากกราฟ H1 เราจะเห็นว่า คลื่นที่ 3 ได้สิ้นสุดลงแล้ว และราคากำลังเข้าสู่ช่วงที่มีโครงสร้างไม่ปกติ
คลื่นที่ 3 เคลื่อนที่อย่างต่อเนื่องและชัน แทบไม่มีการย่อตัวอย่างชัดเจน ซึ่งเป็นลักษณะเฉพาะของคลื่นส่ง จากนั้นราคาได้มีการปรับฐานในรูปแบบ คลื่น abc สีดำ บ่งบอกถึงจุดสิ้นสุดของค

XAUUSD 03/07/25 SW 3342-3366 กรณีขึ้น
- 15 60 มีหัวขึ้น ถึงมี Brdi. ถ้ายังไม่เสียทรง ปรับเสร็จขึ้นต่อได้
- เบรค 3358.4 ขึ้น test 3366
- เบรค 3366 ขึ้นตาม fibo 15 60 240
.
กรณีลง
- 15 ต้องมีหัวลงพา 60 test os-L ถ้า 60 หลุดถึงจะพา 240 ลงต่อ
- หลุด 3342 ลง test 3327.6
- หลุด 3327.6 ลงตาม 15 60
.
D : SW os HL will ob
240 : ob tes

ทองคำเผชิญแรงขายจากโซนแนวต้านสำคัญราคาทองคำกำลังเข้าใกล้โซนแนวต้านสำคัญบริเวณ 3,365 ดอลลาร์ ซึ่งเคยเป็นจุดกระจายตัวของแรงขายก่อนหน้านี้ จากกราฟ H4 ราคากำลังเคลื่อนที่อยู่ในเมฆ Ichimoku และเริ่มแสดงสัญญาณอ่อนแรงเมื่อเข้าใกล้ขอบบนของเมฆ
โครงสร้างทางเทคนิคบ่งชี้ความเป็นไปได้ในการเกิดรูปแบบ Double Top ขนาดเล็ก โดยมีเป้าหมายกำไร TP1 ที่

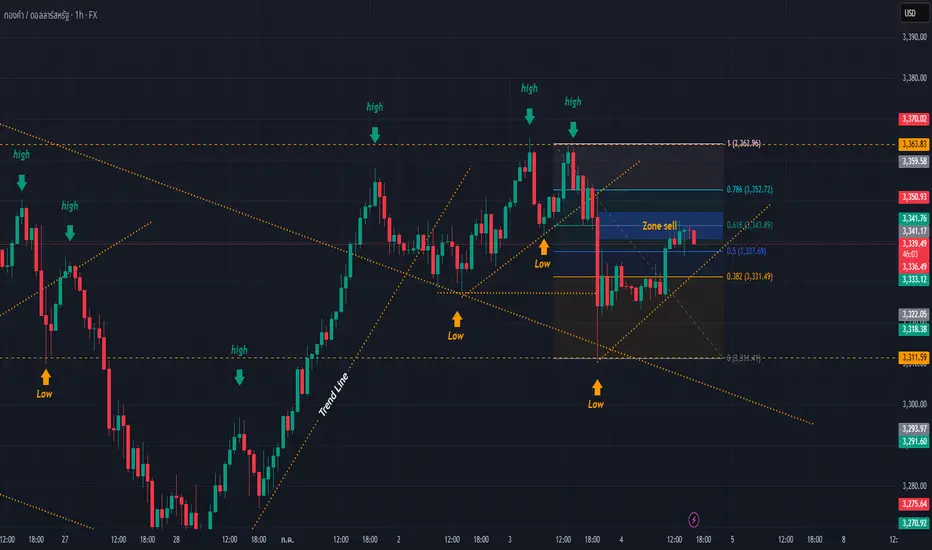
วิเคราะห์ กราฟ xauusd วันที่ 4/7/2568 by pannaจากภาพกราฟที่คุณส่งมา เป็นกราฟทองคำ (XAU/USD) ราย 1 ชั่วโมง
🔷 โครงสร้างราคา (Structure)
ราคาก่อนหน้าอยู่ในขาขึ้น ทำจุด Higher High (HH) และ Higher Low (HL) ต่อเนื่อง
ล่าสุด ราคาได้ทะลุลงมาต่ำกว่า Low เดิม (break structure) แสดงถึงการอ่อนแรงของฝั่งซื้อ และอาจเปลี่ยนเป็นแนวโน้มขาลงระยะสั้น
🔷 แนวต้าน
ดูไอเดียเกี่ยวกับฟิวเจอร์สทั้งหมด
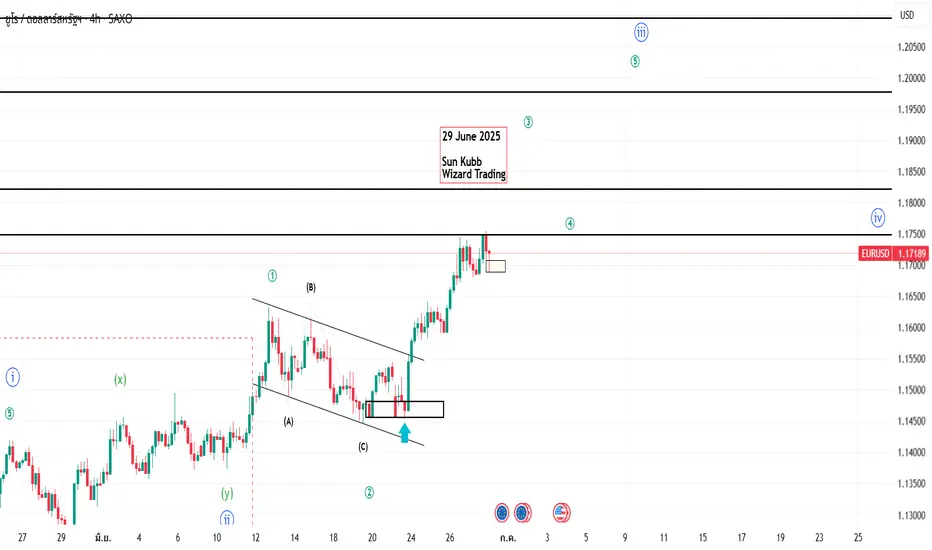
EURUSD Daily Analysis 3/7/2025 by TraderTanTrading note: EURUSD
ติ๊กต๊อก (TikTok) แอปวิดีโอสั้นยอดนิยมของบริษัทไบต์แดนซ์ (Bytedance) ประกาศปรับโครงสร้างธุรกิจอีคอมเมิร์ซในสหรัฐฯ รอบ 3 นับตั้งแต่เดือนเม.ย. โดยปรับลดพนักงานแผนกติ๊กต๊อก ช้อป (TikTok Shop) ซึ่งเป็นหน่วยงานที่ดูแลด้านการขายสินค้าออนไลน์
ติ๊กต๊อก ช้อป ในสหรัฐฯ เผชิญแรงกดดันจากยอ

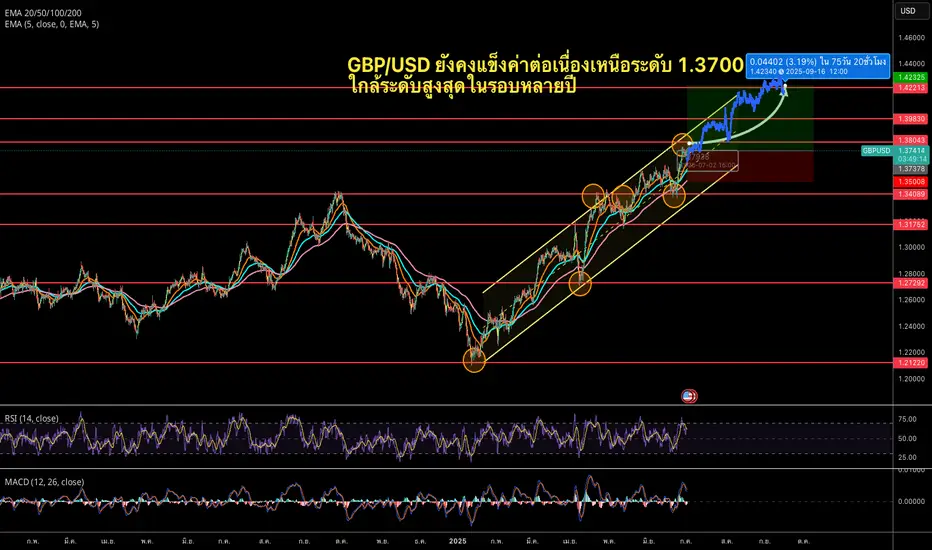
GBP/USD พุ่งแตะระดับสูงสุดรอบ 3 ปี เหนือ 1.3700GBP/USD ยังคงแข็งค่าต่อเนื่องเหนือระดับ 1.3700 ใกล้ระดับสูงสุดในรอบหลายปี
ค่าเงิน GBP/USD ยังคงแข็งค่าต่อเนื่องเป็นวันที่สี่ติดต่อกัน โดยซื้อขายอยู่เหนือระดับ 1.3700 ในช่วงการซื้อขายของยุโรปเมื่อวันพฤหัสบดี ทั้งนี้ คู่สกุลเงินดังกล่าวยังคงใกล้เคียงกับระดับสูงสุดในรอบสามปี ท่ามกลางการอ่อนค่าของเงินด
ดูไอเดียเกี่ยวกับฟอเร็กซ์ทั้งหมด
| EUR | USD | GBP | JPY | THB | |||||
|---|---|---|---|---|---|---|---|---|---|
| EUR | - | - | - | - | - | - | - | - | |
| USD | - | - | - | - | - | - | - | - | |
| GBP | - | - | - | - | - | - | - | - | |
| JPY | - | - | - | - | - | - | - | - | |
| CHF | - | - | - | - | - | - | - | - | |
| AUD | - | - | - | - | - | - | - | - | |
| CNY | - | - | - | - | - | - | - | - | |
| CAD | - | - | - | - | - | - | - | - | |
| THB | - | - | - | - | - | - | - | - |
ซื้อขายโดยตรงบนซูเปอร์ชาร์ตผ่านโบรกเกอร์ที่ผ่านการรองรับของเรา ผ่านการตรวจสอบอย่างครบถ้วน และถูกรีวิวโดยผู้ใช้


