Breakouts with Tests & Retests [LuxAlgo]The Breakouts Tests & Retests indicator highlights tests and retests of levels constructed from detected swing points. A swing area of interest switches colors when a breakout occurs.
Users can control the sensitivity of the swing point detection and the width of the swing areas.
🔶 USAGE
When a Swing point is detected, an area of interest is drawn, colored green for a bullish swing and red when bearish.
A test is confirmed when the opening price is situated in the area of interest, and the closing price is above or below the area, depending on whether it is a bullish or bearish swing. Tests are highlighted with a solid-colored triangle.
A breakout is confirmed when the price closes in the opposite position, below or above the area, in which case the area will switch colors.
If the opening price is located within the area and the closing price closes outside the area, in the same direction as the breakout, this is considered a retest . Retests are highlighted with a hollow-colored triangle.
Note that tests/retests do not act on wicks. The main factor is that the opening price is in the area of interest, while the closing price is outside.
🔹 Area Of Interest Width
The user can adjust the width of the swing areas. Changing the " Width " is a fast and easy way to find different areas of interest.
A higher "Multiple" setting would return a wider area, allowing price to develop within it for a longer period of time and potentially provide later test signals.
When a swing area is broken, a higher "Width" setting can make it more complicated for the price to break it again, allowing a swing area to remain valid for a longer period of time thus potentially providing more retest signals.
🔶 DETAILS
Generally, only one bullish/bearish pattern can be active at a time. This means that no more than 1 bullish or bearish area will be active.
The " Display " settings, however, can help control how areas of different types are displayed.
Bullish AND Bearish: Both, bullish and bearish patterns can be drawn at the same time
Bullish OR Bearish: Only 1 bullish or 1 bearish pattern is drawn at a time
Bullish: Only bullish patterns
Bearish: Only bearish patterns
🔹 Test/Retest Labels
The user can adjust the settings so only the latest test/retest label is shown or set a minimum number of bars until the next test/retest can be drawn.
🔹 Maximum Bars
Users can set a limit of bars for when there is no test/retest in that period; the area of interest won't be updated anymore and will be available and ready for the next Swing.
An option for pulling the area back to the last retest is included.
🔶 SETTINGS
Display: Determines which swing areas are displayed by the indicator. See the "DETAILS" section for more information
Multiple: Adjusts the width of the areas of interest
Maximum Bars: Limit of bars for when there is no test/retest
Display Test/Retest Labels: Show all labels or just the last test/retest label associated with a swing area
Minimum Bars: Minimum bars required for a subsequent test/retest label are allowed to be displayed
Set Back To Last Retest: When after "Maximum Bars" no test/retest is found, place the right side of the area at the last test/retest
🔹 Swings
Left: x amount of wicks on the left of a potential Swing need to be higher/lower for a Swing to be confirmed.
Right: The number of wicks on the right of a potential swing needs to be higher/lower for a Swing to be confirmed.
🔹 Style
Bullish: color for test period (before a breakout) / retest period (after a breakout)
Bearish: color for test period (before a breakout) / retest period (after a breakout)
Label Size
ค้นหาในสคริปต์สำหรับ "bear"

MTF Market Structure - SMC IndicatorsThe Multi Timeframe Market Structure helps understand and identify bullish or bearish Market Structure by highlighting “KEY” Highs and Lows. It also identifies changes in market direction by identifying a “Shift in Market Structure” (See Point 2 below) or “Break in Market Structure” (See Point 3 Below).
What are Key Highs and Lows?
Not every high or low is a “Key” high or low. “Key” highs and lows are specific highs and lows that form the structure of the market and have significance in understanding the current trend in the market (see point 1 below).
The indicator identifies these “Key” highs and lows on multiple time frames, allowing the trader to keep a perspective of the Market Structure with multiple timeframes simultaneously (see point 5 below).
The key highs and lows identified by the indicator are as follows:
Key Lows : Identify significant Swing Lows, Short-term lows “STL”, Intermediate-Term Lows “ITL”, and Long-Term Lows “LTL”.
Key Highs : Identify significant Swing Highs, Short-term highs “STH”, Intermediate-Term Highs “ITH”, and Long-Term Highs “LTH”.
Significant Swing High : This is a price swing with one lower candle to the right and one lower candle to the left of it.
Significant Swing Low : This is a price swing with one higher candle to the right and one higher candle to the left of it.
Short-Term High “STH” is a price swing with one lower Significant Swing High to the right and one lower Significant Swing High to the left of it.
Short-Term Low “STL” is a price swing with one higher Significant Swing Low to the right and one higher Significant Swing Low to the left of it.
Intermediate-Term High “ITH” is a price swing with one lower STH to the right and one lower STH to the left of it.
Intermediate-Term Low “ITL” is a price swing with one higher STL to the right and one higher STL to the left of it.
Long-Term High “LTH” is a price swing with one lower ITH to the right and one lower ITH to the left of it.
Long-Term Low “ITL” is a price swing with one higher ITL to the right and one higher ITL to the left of it.
By identifying key highs and lows using the Market Structure Indicator, it can be used in multiple ways by using those reference points as follows:
1. Identifying Market Trends by Connecting Key Highs and Lows.
Bullish trend identification is when the indicator is making higher ITLs and ITHs.
Bearish Trend identification when the indicator is making lower ITLs and ITHs.
PS: it’s essential to understand the underlying market trend on multiple timeframes to use the next features correctly. Always use the Shifts and Breaks in Market Structures in line with the 1H or higher timeframes Market Trend for higher probability trade opportunities. This is because, generally, higher timeframes have more importance than lower timeframes.
2. Shift In Market Structure - SMS for Entries
A Shift in Market Structure “SMS” identifies potential reversal in short-term market trend relative to the timeframe where the SMS is identified.
This occurs after a run of any Significant Swing High or Low and then reversing, creating a Fair Value Gap “FVG”.
There can be Bullish and Bearish Market Structure Shifts.
When a Bullish Shift in Market Structure occurs, the indicator identifies an opportunity for the price to change from Bearish to Bullish, as seen in the image below.
When a Bearish Shift in Market Structure occurs, the indicator identifies an opportunity for the price to change from Bullish to Bearish.
3. Break In Market Structure - BMS for Entries
A Break in Market Structure “BMS” has a similar function to the Shift in Market Structure “SMS”; however, when it occurs, it identifies a potential longer-term trend reversal (compared to the SMS) relative to the timeframe where the BMS is identified.
Unlike “SMS”, the BMS occurs after a run only after a run on Key Highs or Lows.
Similar to the SMS, there can be Bullish and Bearish Breaks in Market Structure.
When a Bullish Break in Market Structure occurs, the indicator identifies an opportunity for a longer-term trend change from Bearish to Bullish, as seen in the image below.
The FVG must occur in the lower 50% of the impulse price leg (at Discount).
When a Bearish Break in Market Structure occurs, the indicator identifies an opportunity for a longer-term trend change from Bullish to Bearish.
The FVG must occur in the upper 50% of the impulse price leg (at Premium).
4. Inversion Break and Shift in Market Structure for Early Entries
Inversion “BMS” and “SMS” are similar to the normal SMS and BMS, but they occur:
Bullish: When the FVG of the Bearish BMS/SMS forms in the lower 50% of the impulse price leg (at Discount).
We use the FVG that forms from the Bearish SMS/BMS as an inversion FVG for potential entry after market trend change from Bearish to Bullish.
Bearish: When the FVG of the Bullish BMS/SMS forms in the upper 50% of the impulse price leg (at Premium).
We use the FVG that forms from the Bullish SMS/BMS as an inversion FVG for potential entry after market trend change from Bullish to Bearish.
5. Multi Time Frame analysis
The indicator allows multiple timeframe perspectives to be considered when using it.
The key Highs and Lows have significance not only on the current timeframe they are identified but also on lower or higher timeframes simultaneously.
This is because a ITL/ITH on the 1H means
It’s a LTL/LTH on one or more timeframes lower (15Min, 5M, and 1Min).
And at the same time, it’s a STL/STH on one timeframe higher (4H)
Also, it’s a Significant Low/High (marked with a dot) on two timeframes higher (Daily).
The same logic applies to all other Key Highs and Lows.
Another example is a Significant Low/High (swing marked with a dot below or above it) on the current timeframe (1D) means it’s a STL/STH on one timeframe lower (4H) and an ITL/ITH on two timeframes lower (1H) and a LTH/LTH on three timeframes lower or more (15M, 5M, 1Min, 30 Seconds, etc…).
This Multi-time frame analysis is a great way to help traders understand Market Structure and Market trend on multiple timeframes simultaneously, and it also assists in Top-down analysis.
PS: Note that this multi-timeframe analysis approach and logic can be applied to any timeframe and for any type of trading (swing trading, day trading, scalping, or short-term trading) because the price is fractal.
For example, if a trader is a swing trader, then it’s best to identify trader opportunities on the 1H or higher; however, lower timeframes Market Structure can still be used to help the traders refine their entries and target key highs and lows in the opposite direction.
If a trader is a day trader or a scalper, the trader could use Market Structure on 15M or lower to identify trader opportunities and target key highs and lows in the opposite direction.
6. Setting Targets
The indicator can also be used to identify potential targets after the SMS or BMS occurs. Targets can be chosen above Key Highs or Lows depending on the trade objective and timeframe where the trade idea is identified.
Bonus Features
Highlight Market Structure Trend
This feature is an excellent backtesting visual tool to look at changes in market trends highlighted in colours. These changes are based on the Shift or Break in of Market Structure depending on the selection option.
When "Shift/Break" in Market Structure" is selected, a Bullish trend is highlighted in blue when a Bullish Shift/Break in Market Structure Occurs and in Red when a Bearish Shift/Break in Market Structure Occurs.
Notifications
Sends notifications when there is a Shift or Break in Market Structure on the current timeframe of choice.

RSI 11 IndicatorThis script explains how RSI can be used to catch market moves in trend, reversal or sideways market.
What is RSI indicator:-
RSI is a momentum oscillator which measures the speed and change of price movements. RSI moves up and down (oscillates) between ZERO and 100. Generally RSI above 70 is considered overbought and below 30 is considered oversold. Some traders may use a setting of 20 and 80 for oversold and overbought conditions respectively. However this may reduce the number of signals. You can also use RSI to identify divergences, strength, reversals, general trend etc.
Calculation:-
There are three basic components in the RSI - Avg Gain, Avg Loss & RS.
Avg Gain = Average of Upward Price Change
Avg Loss = Average of Downward Price Change
RS = (Avg Gain)/(Avg Loss)
RSI = 100 – (100 / (1 +RS ))
First Calculation:-
RSI calculation is based on default 14 periods.
Average gain and Average loss are simple 14 period averages.
Average Loss equals the sum of the losses divided by 14 for the first calculation.
Average Gain equals the sum of the Gains divided by 14 for the first calculation.
First Average Gain = Sum of Gains over the past 14 periods / 14.
First Average Loss = Sum of Losses over the past 14 periods / 14.
The formula uses a positive value for the average loss.
RS values are smoothed after the first calculation.
Second Calculation:-
Subsequent calculations multiply the prior value by 13, add the most recent value, and divide the total by 14.
Average Gain = / 14.
Average Loss = / 14.
if
Average Loss = 0, RSI = 100 (means there were no losses to measure).
Average Gain = 0, RSI = 0 (means there were no gains to measure).
Logic of this indicator:-
RSI is an oscillator that fluctuates between zero and 100 which makes it easy to use for many traders.
Its easy to identify extremes because RSI is range-bound.
But remember that RSI works best in range bound market and is less trustworthy in trending markets.
A new trader need to be cautious because during strong trends in the market/security, RSI may remain in overbought or oversold for extended periods.
Chart Timeframe:-
RSI indicator works well on all timeframes.
Timeframe depends on which strategy or settings are you using.
Generally a lower timeframe like 1 min, 3 min, 5 min, 15 min, 30 min, 1 Hr etc is used for intraday trades or short duration trades
and higher timeframes like 1 day, 1 week, 1 month are used for positional or long term trades.
Please Read the Idea "Mastering RSI with 11 Strategies" to understand this indicator better.
Indicator 1
Basis Strategy of Overbought and Oversold
Usually an asset with RSI reading of 70 or above indicates a bullish and an overbought situation.
overbought can be seen as trading at a higher price than it should.
traders may expect a price correction or trend reversal and sell the security.
but RSI indicator can stay in the overbought for a long time when the stock is in uptrend - This may trap an immature trader.
an Immature trader will enter a sell position when RSI become overbought (70), whereas a mature trader will enter sell position when RSI line crosses below the overbought line (70).
An asset with RSI reading of 30 or below indicates a bearish and an oversold condition.
oversold can be seen as trading at a lower price than it should.
traders may expect a price correction or trend reversal and buy the security.
but RSI indicator can stay in the oversold for a long time when the stock is in downtrend - This may trap an immature trader.
an Immature trader will enter a buy position when RSI become oversold (30), whereas a mature trader will enter buy position when RSI line crosses above the oversold line (30).
Center dotted Mid line is RSI 50.
Chart RSI is shown in yellow colour.
Red shaded area above the red horizontal line shows the stock or security has entered overbought condition. "R" signal in red shows a likely downside reversal, means it may be a likely Selling opportunity.
Green shaded area below the green horizontal line shows the stock or security has entered oversold condition. "R" signal in green shows a likely upside reversal, means it may be a likely Buying opportunity.
Note:-
so its better to wait for reversal signal.
traders may use 20 instead of 30 as oversold level and 80 instead of 70 as overbought level.
new traders may learn to use the indicator as per the prevailing trend to get better results.
false signals may be avoided by using bullish signals in bullish trend and bearish signals in bearish trend.
Indicator 2
RSI Strength Crossing 50
RSI crossing centreline 50 in the below chart showing strength and buy/sell signal.
Centre line is at RSI 50.
if RSI is above 50 its considered bullish trend. (increasing strength)
if RSI is below 50 its considered bearish trend. (decreasing strength)
RSI crossing centre line (50) upside may be a buy signal.
RSI crossing centre line (50) downside may be a sell signal.
"B" signal in green colour shows that RSI is crossing above Mid 50 horizontal line, which may be a likely Buy signal.
"S" signal in red colour shows that RSI is crossing below Mid 50 horizontal line, which may be a likely Sell signal.
Indicator 3
RSI 40 and RSI 60 Support and Resistance
RSI 40 acting as support in the below chart
In an uptrend RSI tends to remain in the 40 to 90 range with 40 as support (buying opportunity at support).
RSI 60 acting as resistance in the below chart
In a downtrend RSI tends to remain in 10 to 60 range with 60 as resistance (selling opportunity at resistance).
"40" signal in green colour shows that RSI is crossing above 40 horizontal line, which may be a likely Support in making and a Buy signal.
"60" signal in red colour shows that RSI is crossing below 60 horizontal line, which may be a likely Resistance in making and a Sell signal.
Note:-
These ranges may change depending on RSI settings and change in the market trend.
Indicator 4
RSI Divergence
Below chart shows a simple example of Bullish Divergence and Bearish Divergence.
An RSI divergence occurs when price moves in the opposite direction of the RSI.
A bullish divergence is when price is falling but RSI is rising. which means RSI making higher lows and price making lower lows (buy signal).
A bearish divergence is when price is rising but RSI is falling. which means RSI making lower high and price making higher highs (sell signal).
Divergences are more strong when appear in an overbought or oversold condition.
There may be many false signals during a strong uptrend or strong downtrend.
In a strong uptrend, RSI may show many false bearish divergences before finally reversing down.
same way in a strong downtrend, RSI may show many false bullish divergences before finally reversing up.
"Bull Div" signal along with divergence line in green colour shows Bullish Divergence, which may be a likely Buy signal.
"Bear Div" signal along with divergence line in red colour shows Bearish Divergence, which may be a likely Sell signal.
Indicator 5
Double Top & Double Bottom
Double Bottom = RSI goes below oversold (30). RSI comes back above 30. RSI falls back again towards 30 and again rise making a Double bottom. its a signal of buying and likely upside reversal.
Double Top = RSI goes above overbought (70). RSI comes back below 70. RSI rises back again towards 70 and again fall making a Double top. its a signal of selling and likely downside reversal.
Double Bottom is shown with Green Dashed line joining two low's of RSI indicating a likely Buy Signal.
Double Top is shown with Red Dashed line joining two High's of RSI indicating a likely Sell Signal.
Indicator 6
Trendline Support and Resistance
Below chart shows RSI Trendline Resistance and Support
RSI resistance trendline = Connect three or more points on the RSI line as it falls to draw a RSI downtrend line (RSI resistance trendline).
Everytime it takes resistance from a RSI downtrend line its a selling opportunity.
RSI support trendline = Connect three or more points on the RSI line as it rises to draw a RSI uptrend line (RSI support trendline).
Everytime it takes support on a RSI uptrend line its a buying opportunity.
RSI Resistance trendline shown in Red colour indicating a likely fall again after rejection from this Red trendline till the time RSI breaks above it to change the trend from Bearsih to Bullish.
RSI support trendline shown in Green colour indicating a likely Rise again after support from this Green trendline till the time RSI breaks below it to change the trend from Bullish to Bearish.
Indicator 7
Trendline Breakout and Breakdown
Below chart shows RSI Trendline Breakout and Breakdown
RSI resistance trendline Breakout = Connect three or more points on the RSI line as it falls to draw a RSI downtrend line (RSI resistance trendline).
Whenever it breakout above RSI resistance trendline its a buying opportunity.
RSI support trendline Breakdown = Connect three or more points on the RSI line as it rises to draw a RSI uptrend line (RSI support trendline).
Whenever it breakdown below RSI support trendline its a selling opportunity.
Note:-
Correlate both the RSI and the closing price to ensure proper breakout or breakdown.
Challenge is to correctly identify if a breakout or breakdown is sustainable or its a false signal.
Indicator 8
RSI Crossover same timeframe
RSI with two different RSI length crossing each other on same timeframe.
when lower RSI length crossing above higher RSI length its a buy signal.
when lower RSI length crossing below higher RSI length its a sell signal.
for example RSI with length 7 & length 14 on 15 Minutes timeframe.
Green Cross shows that Fast RSI is crossing above Slow RSI on the same timeframe with different RSI length Settings, which means it may be a likely Buy Signal.
Red Cross shows that Fast RSI is crossing below Slow RSI on the same timeframe with different RSI length Settings, which means it may be a likely Sell Signal.
Indicator 9
RSI Crossover Multi timeframe
RSI with same RSI length but on two different timeframes crossing each.
when lower timeframe RSI crossing above higher timeframe RSI its a buy signal.
when lower timeframe RSI crossing below higher timeframe RSI its a sell signal.
for example RSI with length 14 on 5 Minutes and 1 Hr timeframes.
Green Cross shows that Lower Timeframe RSI is crossing above Higher Timeframe RSI with same RSI length Settings, which means it may be a likely Buy Signal.
Red Cross shows that Lower Timeframe RSI is crossing below Higher Timeframe RSI with same RSI length Settings, which means it may be a likely Sell Signal.
Indicator 10
RSI EMA/WMA/SMA Crossover
when RSI crossing above EMA/WMA/SMA its a buy signal.
when RSI crossing below EMA/WMA/SMA its a sell signal.
Green Circle shows that RSI is crossing above EMA/WMA/SMA etc, which means it may be a likely Buy Signal.
Red Circle shows that RSI is crossing below EMA/WMA/SMA etc, which means it may be a likely Sell Signal.
Indicator 11
RSI with Bollinger bands
Bollinger bands and RSI complimenting each other and giving a Buy and Sell signal in below chart
if a security price reaches upper band of a Bollinger Band channel and also the RSI is above 70 (overbought), a trader can look for selling opportunities (reversal) (sell).
but in case price reaches upper band of a Bollinger Band channel but RSI is not above 70 (overbought), there may be chance that security remains in an uptrend, so a trader may wait before entering a sell position.
if a security price reaches lower band of a Bollinger Band channel and also the RSI is below 30 (oversold), a trader can look for buying opportunities (reversal) (buy).
but in case price reaches lower band of a Bollinger Band channel but RSI is not below 30 (oversold), there may be chance that security remains in an downtrend, so a trader may wait before entering a buy position.
so bollinger band with RSI can give a double confirmation on a reversal.
Buy Signal = If the RSI is below Green Horizontal line (Oversold zone) and also below Lower Bollinger Band it indicates that an upside reversal may come, which means that it may be a likely Buy Signal.
Sell Signal = If the RSI is above Red Horizontal line (Overbought zone) and also above Upper Bollinger Band it indicates that an Downside reversal may come, which means that it may be a likely Sell Signal.
Special Thanks to //© HoanGhetti for RSI Trendlines.
Limitations of the RSI:-
RSI works best in range bound market and is less trustworthy in trending markets.
So new traders may get trapped in an uptrend or a downtrend if they forget to see the overall long term trend of that security.
Traders should set stop loss and take profit levels as per risk reward ratio.
Note:
Don't confuse RSI and relative strength. RSI is changes in the price momentum of a security.
whereas relative strength compares the price performance of two or more securities.
Like other technical indicators, RSI also is not a holy grail. It can only assist you in building a good strategy. You can only succeed with proper position sizing, risk management and following correct trading Psychology (No overtrade, No greed, No revenge trade etc).
THIS INDICATOR OF RSI IS FOR EDUCATIONAL PURPOSE AND PAPER TRADING ONLY. YOU MAY PAPER TRADE TO GAIN CONFIDENCE AND BUILD FURTHER ON THESE. PLEASE CONSULT YOUR FINANCIAL ADVISOR BEFORE INVESTING. WE ARE NOT SEBI REGISTERED.
Hope you all like it
happy learning.

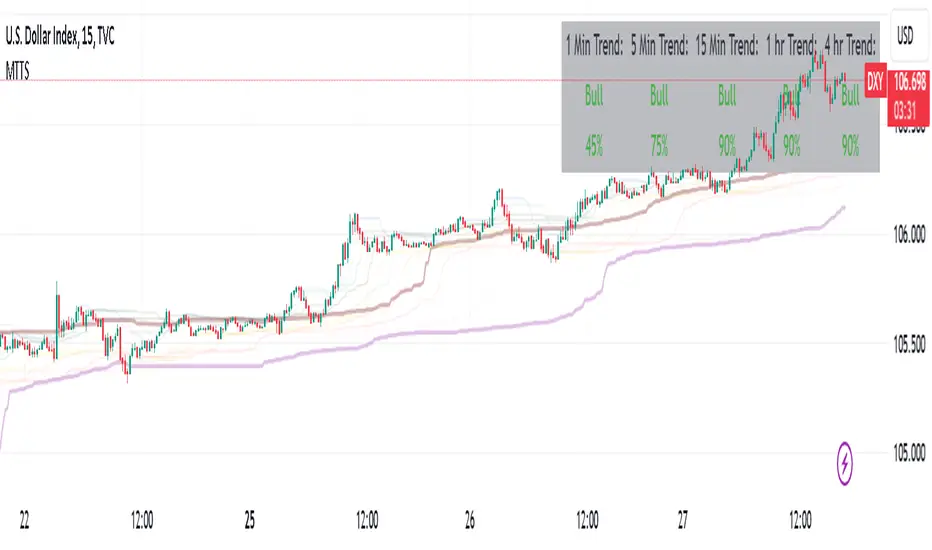
Multi Timeframe Trend StrengthThis code is an advancement of my previous percentile-based trend strength. It follows the same concept, except this code display the trend and trend strength in multiple timeframe (1 min, 5 min, 15 min, 1hr and 4hr).
This gives an indication of the trend is evolving and allows to see how short-term trend matches with the long-term trend.
How it works:
The script assesses trend strength through percentile values derived from high and low prices across various time periods. It categorizes the current trend as either Bullish, Bearish, or N/A (No Trend) with the following steps:
Percentile Calculations: The code calculates the 75th percentile of high prices (e.g., percentile_13H) and the 25th percentile of low prices (e.g., percentile_13L) for specified Fibonacci-based periods (13, 21, 34, 55, 89, and 144). These percentiles serve as thresholds for identifying strong trends.
Calculate Highest High and Lowest Low: It computes the highest high (75th percentile high price of the longest period) and lowest low (25th percentile low price of the longest period), referred to as highest_high and lowest_low. These values establish critical price levels.
Trend Strength Conditions: For each percentile and period, the code checks if the percentile exceeds the highest high (trendBull) or falls below the lowest low (trendBear). These conditions gauge the strength of bullish and bearish trends.
Count Bull and Count Bear: Variables countBull and countBear tally the number of bullish and bearish conditions met, helping assess trend strength.
Weak Bull and Weak Bear Count: The code calculates weak bullish and bearish conditions, occurring when percentiles fall within the range defined by highest_high and lowest_low but don't meet strong trend criteria.
Bull Strength and Bear Strength: bullStrength and bearStrength are calculated based on counts of bullish, bearish, weak bullish, and weak bearish conditions, representing overall trend strength.
Strong Bull and Bear Conditions: These conditions arise when the 75th percentile of high prices (bull conditions) or the 25th percentile of low prices (bear conditions) surpass or dip below the highest high or lowest low, respectively, for the specified period. Strong conditions indicate robust trends with significant price movements.
Weak Bull and Bear Conditions: Weak conditions occur when percentiles fall within the range between highest_high and lowest_low, suggesting some bullish or bearish tendencies without reaching extreme levels. These imply less decisive trends.
Current Trend Identification: The current trend is determined by comparing bullStrength and bearStrength. A greater bullStrength indicates a Bull trend, greater bearStrength implies a Bear trend, and equal values denote No Trend (N/A).
Percentile Based Trend StrengthThe "Percentile Based Trend Strength" (PBTS) calculates trend strength based on percentile values of high and low prices for various length periods and then identifies the current trend as either Bullish, Bearish, or N/A (No Trend). Here's a step-by-step explanation of the code:
Percentile Calculations:
For each specified length period (13, 21, 34, 55, 89, and 144 - Fibonacci numbers), the code calculates the 75th percentile of high prices (e.g., percentile_13H) and the 25th percentile of low prices (e.g., percentile_13L). These percentiles represent levels that prices need to exceed or fall below to indicate a strong trend.
Calculate Highest High and Lowest Low:
The highest high (75th percentile high price of longest length) and lowest low (25th percentile low price of longest length) for the longest length period (144) are calculated as highest_high and lowest_low. These values represent threshold price levels .
Trend Strength Conditions:
The code calculates various conditions to determine trend strength. For each percentile value and each length period, it checks if the percentile value is greater than the highest high (trendBull) or less than the lowest low (trendBear). These conditions are used to assess the strength of the bullish and bearish trends.
Count Bull and Count Bear:
The countBull and countBear variables count the number of bullish and bearish conditions met, respectively. These counts help evaluate trend strength.
Weak Bull and Weak Bear Count:
The code calculates the number of weak bullish and bearish conditions. Weak conditions occur when a percentile value falls within the range defined by the highest high and lowest low but doesn't meet the strong trend criteria.
Bull Strength and Bear Strength:
bullStrength and bearStrength are calculated based on the counts of bullish, bearish, weak bullish, and weak bearish conditions. These values represent the overall strength of the bullish and bearish trends.
Strong Bull and Bear Conditions:
These conditions occur when the 75th percentile of high prices (for bull conditions) or the 25th percentile of low prices (for bear conditions) exceeds or falls below the highest high or lowest low, respectively, for the specified length period.
Strong bull conditions indicate a strong upward trend, while strong bear conditions indicate a strong downward trend.
Strong conditions are indicative of more significant price movements and are considered as primary signals of trend strength.
Weak Bull and Bear Conditions:
Weak bull and bear conditions are more nuanced. They occur when the 75th percentile of high prices (for weak bull conditions) or the 25th percentile of low prices (for weak bear conditions) falls within the range defined by the highest high and lowest low for the specified length period.
In other words, prices are not strong enough to reach the extreme levels represented by the highest high or lowest low, but they still exhibit some bullish or bearish tendencies within that range.
Weak conditions suggest a less robust trend. They may indicate that while there is some bias toward a bullish or bearish trend, it is not as strong or decisive as in the case of strong conditions.
Current Trend Identification:
The current trend is determined by comparing bullStrength and bearStrength. If bullStrength is greater, it's considered a Bull trend; if bearStrength is greater, it's a Bear trend. If they are equal, the trend is identified as N/A (No Trend).
Displaying Trend Information:
The code creates a table to display the current trend, reversal probability (strength), count of bullish and bearish conditions, weak bullish and weak bearish counts, and colors the text accordingly.
Plotting Percentiles:
Finally, the code plots the percentile lines for visualization, with 20% transparency. It also plots the highest high and lowest low lines (75th and 25th percentile of the longest length 144) using their original colors.
In summary, this indicator calculates trend strength based on percentile levels of high and low prices for different length periods. It then counts the number of bullish and bearish conditions, factors in weak conditions, and compares the strengths to identify the current trend as Bullish, Bearish, or No Trend. It provides a table with trend information and visualizes percentile lines on the chart.

DOW 30 - Market BreadthDOW 30 indicator is intended for short-term intraday analysis and should not be used solely alone. Best to use this indicator in a combination with technical and fundamental analysis.
This indicator is calculated from all stocks in the DJI as of 8/9/2022;
- Evaluating VWAP,
- 9 EMA,
- 20 EMA.
Vwap Calculations;
Stock above Vwap = 1 (Vwap Bull),
Stock below Vwap = 1 (Vwap Bear),
As there are 30 stocks in the DJI, there is a max value of 30 Vwap Bulls/ Vwap Bears.
Ema Calculation;
Stock above 9 EMA = 0.5 (EMA Bulls),
Stock below 9 EMA = 0.5 (EMA Bears),
Stock above 20 EMA = 0.5 (EMA Bulls),
Stock below 20 EMA = 0.5 (EMA Bears),
For the EMA Bulls to reach 30 all stocks must be trading above both the 9 EMA and 20 EMA to reach a Max Value of 30.
The reasoning for this calculation is to suggest the current strength and speed of the current turn in the market.
Horizontal Lines:
There are three horizontal lines, MAX, MIN & Neutral;
MAX & MIN
Resides at the 30 & 0 levels suggesting the market is currently at an extreme. Representing all stocks are moving in the same direction together.
When the MAX or MIN are represented in the VWAP Line this represents directional conviction in the underlining DJI.
Neutral
Neutral resides at the 15 level and represents that the market is either about to make a decision or is choppy.
EXAMPLE
Below are some examples of how the DOW 30 indicator is able to represent the current market conditions.
Understand Current Market Conditions, either being Bullish, Neutral, or Bearish.
See live Market Mechanics, and understand the current market direction on a short-term timeframe.
DOW 30 indicator is intended for short-term intraday analysis and should not be used solely alone. Best to use this indicator in a combination with technical and fundamental analysis.
If there are any additional requests to the indicator feel free to leave a comment or privet message.
Best of luck trading.

Cyclic Smoothed RSI with Motive-Corrective Wave Indicator
This indicator uses the cyclic smoothed Relative Strength Index (cRSI) instead of the traditional Relative Strength Index (RSI). See below for more info on the benefits to the cRSI.
My key contributions
1) A Weighted Moving Average (WMA) to track the general trend of the cRSI signal. This is very helpful in determining when the equity switches from bullish to bearish, which can be used to determine buy/sell points. This is then is used to color the region between the upper and lower cRSI bands (green above, red below).
2) An attempt to detect the motive (impulse) and corrective and waves. Corrective waves are indicated A, B, C, D, E, F, G. F and G waves are not technically Elliot Waves, but the way I detect waves it is really hard to always get it right. Once and a while you could actually see G and F a second time. Motive waves are identified as s (strong) and w (weak). Strong waves have a peak above the cRSI upper band and weak waves have a peak below the upper band.
3) My own divergence indicator for bull, hidden bull, bear, and hidden bear. I was not able to replicate the TradingView style of drawing a line from peak to peak, but for this indicator I think in the end it makes the chart cleaner.
There is a latency issue with an indicator that is based on moving averages. That means they tend to trigger right after key events. Perfect timing is not possible strictly with these indicators, but they do work very well "on average." However, my implementation has minimal latency as peaks (tops/bottoms) only require one bar to detect.
As a bit of an Easter Egg, this code can be tweaked and run as a strategy to get buy/sell signals. I use this code for both my indicator and for trading strategy. Just copy and past it into a new strategy script and just change it from study to a strategy, something like this:
strategy("cRSI + Waves Strategy with VWMA overlay", overlay=overlay)
The buy/sell code is at the end and just needs to be uncommented. I make no promises or guarantees about how good it is as a strategy, but it gives you some code and ideas to work with.
Tuning
1) Volume Weighted Moving Average (VWMA): This is a “hidden strategy” feature implemented that will display the high-low bands of the VWMA on the price chart if run the code using “overlay = true”.
- If the equity does not have volume, then the VWMA will not show up. Uncheck this box and it will use the regular WMA (no volume).
- defines how far back the WMA averages price.
2) cRSI (Black line in the indicator)
- Increase to length that amount of time a band (upper/lower) stays high/low after a peak. Reduce the value to shorten the time. Just increment it up/down to see the effect.
- defines how far back the SMA averages the cRSI. This affects the purple line in the indicator.
- defines how many bars back the peak detector looks to determine if a peak has occurred. For example, a top is detected like this: current-bar down relative to the 1-bar-back, 1-bar-back up relative to 2-bars-back (look back = 1), c) 2-bars-back up relative to 3-bars-back (lookback = 2), and d) 3-bars-back up relative to 4-bars-back (lookback = 3). I hope that makes sense. There are only 2 options for this setting: 2 or 3 bars. 2 bars will be able to detect small peaks but create more “false” peaks that may not be meaningful. 3 bars will be more robust but can miss short duration peaks.
3) Waves
- The check boxes are self explanatory for which labels they turn on and off on the plot.
4) Divergence Indicators
- The check boxes are self explanatory for which labels they turn on and off on the plot.
Hints
- The most common parameter to change is the . Different stocks will have different levels of strength in their peaks. A setting of 2 may generate too many corrective waves.
- Different times scales will give you different wave counts. This is to be expected. A counter impulse wave inside a corrective wave may actually go above the cRSI WMA on a smaller time frame. You may need to increase it one or two levels to see large waves.
- Just because you see divergence (bear or hidden bear) does not mean a price is going to go down. Often price continues to rise through bears, so take note and that is normal. Bulls are usually pretty good indicators especially if you see them on C,E,G waves.
----------------------------------------------------------------------------------------------------------------------------
cyclic smoothed RSI (cRSI) indicator
----------------------------------------------------------------------------------------------------------------------------
The “core” code for the cyclic smoothed RSI (cRSI) indicator was written by Lars von Theinen and is subject to the terms of the Mozilla Public License 2.0 at mozilla.org Copyright (C) 2017 CC BY, whentotrade / Lars von Thienen. For more details on the cRSI Indicator:
The cyclic smoothed RSI indicator is an enhancement of the classic RSI, adding
1) additional smoothing according to the market vibration,
2) adaptive upper and lower bands according to the cyclic memory and
3) using the current dominant cycle length as input for the indicator.
It is much more responsive to market moves than the basic RSI. The indicator uses the dominant cycle as input to optimize signal, smoothing, and cyclic memory. To get more in-depth information on the cyclic-smoothed RSI indicator, please read Decoding The Hidden Market Rhythm - Part 1: Dynamic Cycles (2017), Chapter 4: "Fine-tuning technical indicators." You need to derive the dominant cycle as input parameter for the cycle length as described in chapter 4.
Hope this helps and good luck.

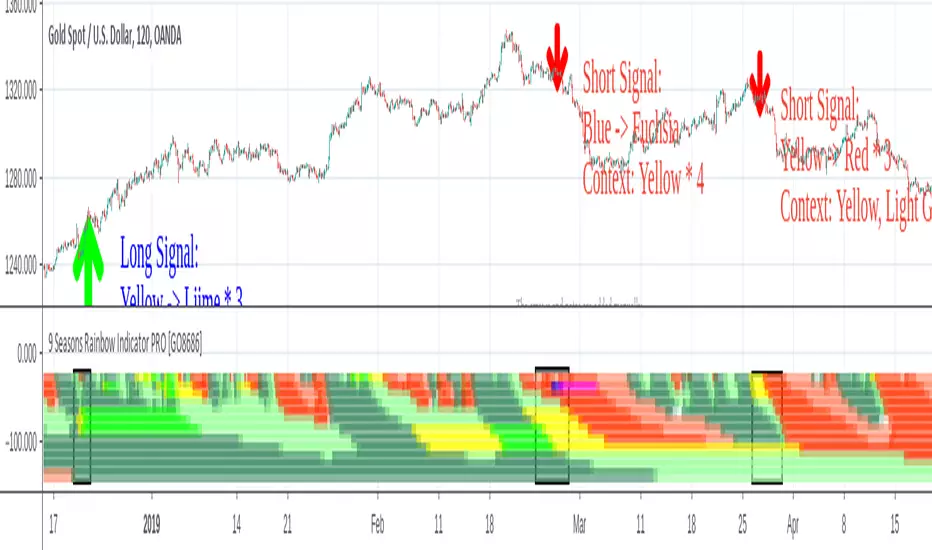
9 Seasons Rainbow Indicator PRO [GO8686]Trading on 5 minutes frame can be as reasonable as on 4H frame, use 9 Seasons Rainbow Indicator PRO for both.
5分钟维度的交易可以与4小时维度一样合理,请使用9季彩虹指标 PRO 。
Market is full of life, with seasons.
9 Seasons Rainbow Indicator displays 9 seasons of any trading instrument in multiple time frames, helping traders and investors understand the flow of price.
The combination of seasons in different time dimensions may give perfect trading signals, for instance: overbought in both small time frame and big time frame has high success probability of shorting trade.
Please install the indicator: Demo, PRO or STANDARD Version. Apply the indicator to your favorites trading instruments: indices, stocks, futures , forex or crypto currencies. Find your patterns that make money.
---------- 9 Seasons ----------
Bull(Green), evolves into BullRest, OverBought, Bear, or Neutral
Bull Rest(Light Green): a pullback or retracement, evolves into Bull or Bear
OverBought(Yellow): may have defined a top or resistance, can happen in range, evolves into CrazyBought or Bear
CrazyBought(Lime): going up in a high volatility , evolves into Bear, OverBought, or BullRest
Neutral(White): a wandering season without direction, evolves into Bull or Bear
Bear(Red), evolves into BearRest, OverSold, Bull or Neutral
Bear Rest(Light Red): a bounce, evolves into Bear or Bull
OverSold(Blue): may have defined a bottom or support, can happen in range, evolves into CrazySold or Bull
CrazySold(Fuchsia): going down in a high volatility , evolves into Bull, OverSold, or BearRest
---------- Some important evolutions of seasons ----------
OverBought -> CrazyBought: can happen with a breakout
CrazyBought -> OverBought or Bear: could mean fading of a breakout
CrazyBought -> BullRest: can happen after rising over a new level
OverSold -> CrazySold: can happen with a breakdown
CrazySold -> OverSold or Bear: could mean fading of a breakdown
CrazySold -> BearRest: can happen after dropping to a new level
---------- Rainbow Ribbons for multiple time frames ----------
Each ribbon of the rainbow represents a time frame,
The difference between two frames is 1.4142 fold (square root of 2), if level 1 is 15 M, level 2 is 15 * (square root of 2) M. level 3 is 15*2 M, level 4 is 30 * (square root of 2) M, level 5 is 30 * 2 m etc.
The uppermost ribbon represents the smallest time frame - current time period of the chart.
The lower ribbons represent bigger time frames, which work as context.
Examples for time frame rainbow:
For DEMO in 30M: 30M - 42M - 60M(1H) - 85M - 120M(2H) - 170M - 240M(4H) - 339M
For STANDARD in 15M: 15M - 21M - 30M - 42M - 60M(1H) - 85M - 120M(2H) - 170M
For PRO in 15M: 15M - 21M - 30M - 42M - 60M(1H) - 85M - 120M(2H) - 170M - 240M(4H) - 339M - 480M(8H) - 679M
---------- Versions Description ----------
The features may change later, please refer to latest update.
PRO:
PRO version of 9 Seasons Rainbow Indicator is invite-only, with the following advanced features:
12 Ribbon Rainbow lets you discover trading opportunities hidden in the 1.4142 fold time dimension while monitoring market conditions spanning 45 times.
Advanced alert sets allows you set alerts for Overbought, Crazybought, OverSold, CrazySold on low, medium, and high time frames.
Option to input different trading instrument to compare with the current ticker.
Full time periods access allows you to watch the market on broadest time dimensions.
More new features in updates.
STANDARD:
This is STANDARD version of 9 Seasons Rainbow Indicator, invite-only, with the following advanced features:
8 Ribbon Rainbow lets you discover trading opportunities hidden in the 1.4142 fold time dimension while monitoring market conditions spanning 11 times.
Advanced alert sets allows you set alerts for Overbought, Crazybought, OverSold, CrazySold on upper and lower time frames.
Broad time periods access allows you to watch the market on popular time dimensions from 15M - 1D,2D,3D,4D,5D,6D,1W.
More new features in updates.
DEMO:
A DEMO of Standard version for trial purpose, having most the functions except alert preset conditions.
It is applicable to a list of trading instruments and specific time periods(30m-1D), which may change later. please refer to latest updates.
---List of tickers applicable for Demo version.
Currency Index:AXY, BXY , CXY , DXY , EXY , JXY , SXY , ZXY ,
Stock Index:SPX,TSX, DAX , NI225 ,KOSPI,399001, SHCOMP , HSI , XJO , TAIEX , SX5E ,
Crypto:BTCUSD
Commodity:BCOUSD, GOLD
---------- Access to Indicators ----------
Please use DEMO version to taste the indicator.
Please contact the author for access to PRO or Standard versions.
---------- About Loading Time ----------
It may take up to 2 minutes for your browser to load a new setting, depending on the your computer and network speed.
---------- List of the author's Indicators ----------
tradingview.com/u/go8686/#published-scripts
---------- Disclaim ----------
By using or requesting access to this indicator, you acknowledge that you have read and accepted that this indicator is for study purposes only and it does NOT guarantee you will make money.
I am not financial adviser and I am NOT responsible for any profits or losses you may incur by using this indicator!
Users should make their own decisions, carefully assess risks and be responsible for investment and trading activities.
The latest updates override the previous description. Please check the updates.
9季彩虹指标 PRO
市场充满生机。
9季彩虹指标在多个时间维度上显示任何交易品种的9个季节交替,帮助交易者和投资者了解价格流动。
不同时间维度的季节组合可以给出完美的交易信号,例如:在小时间框架和大时间框架上同时出现超买具有很高的卖空交易成功概率。
请安装指标:DEMO,STANDARD 或者 PRO 版本. 应用指标到您的交易品种:证券,期货,外汇或者加密货币。找到属于您的盈利模式。
---------- 季节的定义 ----------
牛(绿色),可以演变到牛市回调,超买,熊 或者 中性
牛市回调(淡绿色):可以演变到牛或者熊
超买(黄色),可能刚刚定义了一个头部或者阻力区,可以发生在盘整期,可以演变到狂买或者熊
狂买(亮绿色):高波动性上涨,可以演变到熊,超买或者牛市回调
中性(白色): 没有方向的徘徊期,可以演变到牛或者熊
熊(红色),可以演变到熊市反弹,超卖,牛 或者 中性
熊市反弹(淡红色),可以演变到熊或者牛
超卖(蓝色),可能刚刚定义了一个底部或者支撑,可以发生在盘整期,可以演变到狂卖或者牛
狂卖(紫红色),高波动性下跌,可以演变到牛,超卖 或者熊市反弹
一些重要的季节交替
超买 -> 狂买:可能发生在向上突破时
狂买 -> 熊 或者 超买:可能发生在突破失败时
狂买 -> 牛市回调: 可能发生在上平台后
超卖 -> 狂卖:可能发生在向下突破时
狂卖 -> 牛 或者 超卖:可能发生在突破失败时
狂卖 -> 熊市回调: 可能发生在下平台后
---------- 色带彩虹所代表的时间维度 ----------
每条色带代表一个时间维度。
色带间隔1.4142倍(2的开方),如果第一维度是15分钟,第二维度是15*1.4142=21分钟,第三维度是15*2=30分钟,以此类推。
最上面的色带代表最小的时间维度,也就是目前图表的时间维度
最下面的色带代表最大的时间维度。
例子:
演示版: 30m-42m-60m(1H)-85m-120m(2H)-170m-240m(4H)-339m
标准版: 15m-21m-30m-42m-60m(1H)-85m-120m(2H)-170m
专业版: 15m-21m-30m-42m-60m(1H)-85m-120m(2H)-170m-240m(4H)-339m-480m(8H)-679m
---------- 不同版本功能描述 ----------
这些特征及功能可能会发生变化,以更新为准。
---专业版PRO高级特征
12色带彩虹让您发现隐藏在1.4142时间维度的交易机会,同时监控时间跨度达四十五倍的市场状态
高级警报功能:允许您在低,中,高时间帧上设置超买,狂买,超卖,狂卖的警报。
可以输入不同的交易品种用于指标,便于与当前交易品种进行比较。
全时间维度(分钟到日线级别)给您全视角观察市场
更新中的更多新功能。
---标准版STANDARD特征
8色带彩虹让您发现隐藏在1.4142时间维度的交易机会,同时监控时间跨度达十一倍的市场状态
高级警报功能:允许您在低,高时间层级上设置超买,狂买,超卖,狂卖的警报。
宽时间维度(15分钟到日线级别)让您从更宽阔的视角观察市场
更新中的更多新功能。
--演示版DEMO
演示版用于标准版的演示和试用,适用于特定的资产列表和时间维度(30M-1D),后续可能调整.
适用的品种列表
AXY , BXY , CXY , DXY , EXY , JXY , SXY , ZXY ,
SPX ,TSX, DAX , NI225 ,KOSPI,399001, SHCOMP , HSI , XJO , TAIEX , SX5E ,
BTCUSD , BCOUSD , GOLD
---------- 获得使用权 ----------
请使用演示版以初步了解指标的运行机理。
联系指标开发者以取得标准版和专业版的使用权
---------- 开发者的指标列表 ----------
tradingview.com/u/go8686/#published-scripts
---------- 加载时间 ----------
可能需要2分钟,取决于网络和电脑配置。
---------- 免责声明 ----------
在要求获得本指标使用权之前以及在使用本指标之前,用户认可已经完全了解和接受:本指标仅供研究目的, 它不提供任何赢利的可能性。
本指标的开发者并非专业投资顾问,因此不对用户的任何赢亏负责。
用户应独立判断,审慎评估并自负投资和交易风险!
最近的更新会覆盖之前的说明。 请参阅更新来查看指标的新特征和功能。
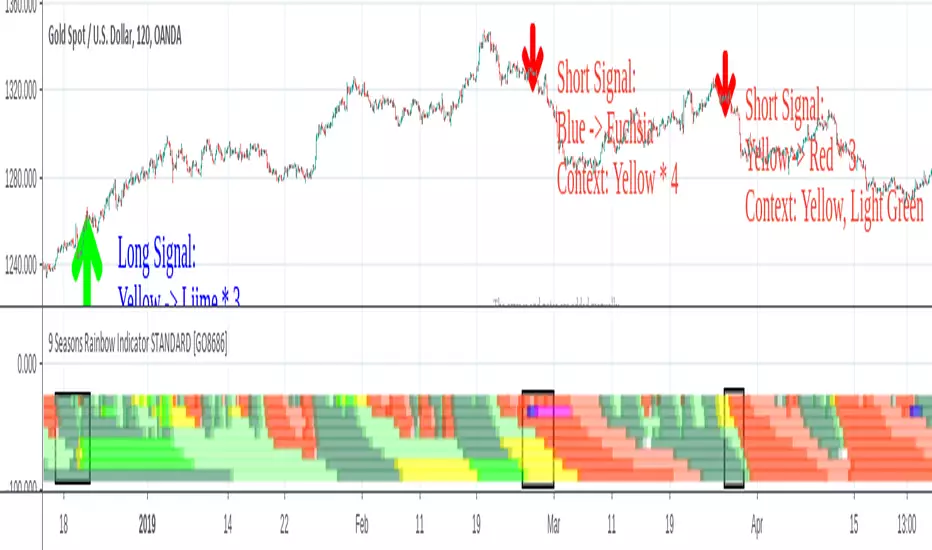
9 Seasons Rainbow Indicator STANDARD [GO8686]Market is full of life, with seasons.
9 Seasons Rainbow Indicator displays 9 seasons of any trading instrument in multiple time frames, helping traders and investors understand the flow of price.
The combination of seasons in different time dimensions may give perfect trading signals, for instance: overbought in both small time frame and big time frame has high success probability of shorting trade.
Please install the indicator: Demo, PRO or STANDARD Version. Apply the indicator to your favorites trading instruments: indices, stocks, futures , forex or crypto currencies. Find your patterns that make money.
---------- 9 Seasons ----------
Bull(Green), evolves into BullRest, OverBought, Bear, or Neutral
Bull Rest(Light Green): a pullback or retracement, evolves into Bull or Bear
OverBought(Yellow): may have defined a top or resistance, can happen in range, evolves into CrazyBought or Bear
CrazyBought(Lime): going up in a high volatility , evolves into Bear, OverBought, or BullRest
Neutral(White): a wandering season without direction, evolves into Bull or Bear
Bear(Red), evolves into BearRest, OverSold, Bull or Neutral
Bear Rest(Light Red): a bounce, evolves into Bear or Bull
OverSold(Blue): may have defined a bottom or support, can happen in range, evolves into CrazySold or Bull
CrazySold(Fuchsia): going down in a high volatility , evolves into Bull, OverSold, or BearRest
---------- Some important evolutions of seasons ----------
OverBought -> CrazyBought: can happen with a breakout
CrazyBought -> OverBought or Bear: could mean fading of a breakout
CrazyBought -> BullRest: can happen after rising over a new level
OverSold -> CrazySold: can happen with a breakdown
CrazySold -> OverSold or Bear: could mean fading of a breakdown
CrazySold -> BearRest: can happen after dropping to a new level
---------- Rainbow Ribbons for multiple time frames ----------
Each ribbon of the rainbow represents a time frame,
The difference between two frames is 1.4142 fold (square root of 2), if level 1 is 15 M, level 2 is 15 * (square root of 2) M. level 3 is 15*2 M, level 4 is 30 * (square root of 2) M, level 5 is 30 * 2 m etc.
The uppermost ribbon represents the smallest time frame - current time period of the chart.
The lower ribbons represent bigger time frames, which work as context.
Examples for time frame rainbow:
For DEMO in 30M: 30M - 42M - 60M(1H) - 85M - 120M(2H) - 170M - 240M(4H) - 339M
For STANDARD in 15M: 15M - 21M - 30M - 42M - 60M(1H) - 85M - 120M(2H) - 170M
For PRO in 15M: 15M - 21M - 30M - 42M - 60M(1H) - 85M - 120M(2H) - 170M - 240M(4H) - 339M - 480M(8H) - 679M
---------- Versions Description ----------
The features may change later, please refer to latest update.
STANDARD:
This is STANDARD version of 9 Seasons Rainbow Indicator, invite-only, with the following advanced features:
8 Ribbon Rainbow lets you discover trading opportunities hidden in the 1.4142 fold time dimension while monitoring market conditions spanning 11 times.
Advanced alert sets allows you set alerts for Overbought, Crazybought, OverSold, CrazySold on upper and lower time frames.
Broad time periods access allows you to watch the market on popular time dimensions from 15M - 1D,2D,3D,4D,5D,6D,1W.
More new features in updates.
PRO:
PRO version of 9 Seasons Rainbow Indicator is invite-only, with the following advanced features:
12 Ribbon Rainbow lets you discover trading opportunities hidden in the 1.4142 fold time dimension while monitoring market conditions spanning 45 times.
Advanced alert sets allows you set alerts for Overbought, Crazybought, OverSold, CrazySold on low, medium, and high time frames.
Option to input different trading instrument to compare with the current ticker.
Full time periods access allows you to watch the market on broadest time dimensions.
More new features in updates.
DEMO:
A DEMO of Standard version for trial purpose, having most the functions except alert preset conditions.
It is applicable to a list of trading instruments and specific time periods(30m-1D), which may change later. please refer to latest updates.
---List of tickers applicable for Demo version.
Currency Index:AXY, BXY , CXY , DXY , EXY , JXY , SXY , ZXY ,
Stock Index:SPX,TSX, DAX , NI225 ,KOSPI,399001, SHCOMP , HSI , XJO , TAIEX , SX5E ,
Crypto:BTCUSD
Commodity:BCOUSD, GOLD
---------- Access to Indicators ----------
Please contact the author for access to PRO or Standard versions.
---------- About Loading Time ----------
It may take up to 2 minutes for your browser to load a new setting, depending on the your computer and network speed.
---------- List of the author's Indicators ----------
tradingview.com/u/go8686/#published-scripts
---------- Disclaim ----------
By using or requesting access to this indicator, you acknowledge that you have read and accepted that this indicator is for study purposes only and it does NOT guarantee you will make money.
I am not financial adviser and I am NOT responsible for any profits or losses you may incur by using this indicator!
Users should make their own decisions, carefully assess risks and be responsible for investment and trading activities.
The latest updates override the previous description. Please check the updates.
9季彩虹指标 标准版 STANDARD
市场充满生机。
9季彩虹指标在多个时间维度上显示任何交易品种的9个季节交替,帮助交易者和投资者了解价格流动。
不同时间维度的季节组合可以给出完美的交易信号,例如:在小时间框架和大时间框架上同时出现超买具有很高的卖空交易成功概率。
请安装指标:DEMO,STANDARD 或者 PRO 版本. 应用指标到您的交易品种:证券,期货,外汇或者加密货币。找到属于您的盈利模式。
---------- 季节的定义 ----------
牛(绿色),可以演变到牛市回调,超买,熊 或者 中性
牛市回调(淡绿色):可以演变到牛或者熊
超买(黄色),可能刚刚定义了一个头部或者阻力区,可以发生在盘整期,可以演变到狂买或者熊
狂买(亮绿色):高波动性上涨,可以演变到熊,超买或者牛市回调
中性(白色): 没有方向的徘徊期,可以演变到牛或者熊
熊(红色),可以演变到熊市反弹,超卖,牛 或者 中性
熊市反弹(淡红色),可以演变到熊或者牛
超卖(蓝色),可能刚刚定义了一个底部或者支撑,可以发生在盘整期,可以演变到狂卖或者牛
狂卖(紫红色),高波动性下跌,可以演变到牛,超卖 或者熊市反弹
一些重要的季节交替
超买 -> 狂买:可能发生在向上突破时
狂买 -> 熊 或者 超买:可能发生在突破失败时
狂买 -> 牛市回调: 可能发生在上平台后
超卖 -> 狂卖:可能发生在向下突破时
狂卖 -> 牛 或者 超卖:可能发生在突破失败时
狂卖 -> 熊市回调: 可能发生在下平台后
---------- 色带彩虹所代表的时间维度 ----------
每条色带代表一个时间维度。
色带间隔1.4142倍(2的开方),如果第一维度是15分钟,第二维度是15*1.4142=21分钟,第三维度是15*2=30分钟,以此类推。
最上面的色带代表最小的时间维度,也就是目前图表的时间维度
最下面的色带代表最大的时间维度。
例子:
演示版: 30m-42m-60m(1H)-85m-120m(2H)-170m-240m(4H)-339m
标准版: 15m-21m-30m-42m-60m(1H)-85m-120m(2H)-170m
专业版: 15m-21m-30m-42m-60m(1H)-85m-120m(2H)-170m-240m(4H)-339m-480m(8H)-679m
---------- 不同版本功能描述 ----------
这些特征及功能可能会发生变化,以更新为准。
---标准版STANDARD特征
8色带彩虹让您发现隐藏在1.4142时间维度的交易机会,同时监控时间跨度达十一倍的市场状态
高级警报功能:允许您在低,高时间层级上设置超买,狂买,超卖,狂卖的警报。
宽时间维度(15分钟到日线级别)让您从更宽阔的视角观察市场
更新中的更多新功能。
---专业版PRO高级特征
12色带彩虹让您发现隐藏在1.4142时间维度的交易机会,同时监控时间跨度达四十五倍的市场状态
高级警报功能:允许您在低,中,高时间帧上设置超买,狂买,超卖,狂卖的警报。
可以输入不同的交易品种用于指标,便于与当前交易品种进行比较。
全时间维度(分钟到日线级别)给您全视角观察市场
更新中的更多新功能。
--演示版DEMO
演示版用于标准版的演示和试用,适用于特定的资产列表和时间维度(30M-1D),后续可能调整.
适用的品种列表
AXY , BXY , CXY , DXY , EXY , JXY , SXY , ZXY ,
SPX ,TSX, DAX , NI225 ,KOSPI,399001, SHCOMP , HSI , XJO , TAIEX , SX5E ,
BTCUSD , BCOUSD , GOLD
---------- 获得使用权 ----------
联系指标开发者以取得标准版和专业版的使用权
---------- 开发者的指标列表 ----------
tradingview.com/u/go8686/#published-scripts
---------- 加载时间 ----------
可能需要2分钟,取决于网络和电脑配置。
---------- 免责声明 ----------
在要求获得本指标使用权之前以及在使用本指标之前,用户认可已经完全了解和接受:本指标仅供研究目的, 它不提供任何赢利的可能性。
本指标的开发者并非专业投资顾问,因此不对用户的任何赢亏负责。
用户应独立判断,审慎评估并自负投资和交易风险!
最近的更新会覆盖之前的说明。 请参阅更新来查看指标的新特征和功能。
Rhokeo-VW-RSI Histogram for Cumulative Delta by ZeiirmanRhokeo-VW-RSI Histogram: Volume-Weighted Momentum (use with Cumulative Delta from Zeiierman) Note that Cumulative Delta is a paid indicator.
Overview: The Rhokeo-VW-RSI Histogram is a momentum oscillator designed to filter out market noise by integrating volume directly into the RSI calculation. Unlike a standard RSI, which only considers price change, this indicator weights those changes by the volume occurring at the time.
It creates a momentum profile in the form of a Histogram. If the price moves on high volume, the indicator reflects that strong market interest through its volume-weighted gain and loss calculations. It is particularly effective as a complementary filter for “Cumulative Delta” from Zeiierman to confirm the strength behind a move before you enter a trade.
How It Works The indicator operates on a normalized scale of -1.0 to +1.0 for easier visual interpretation and compatibility with Cumulative Delta indicator:
• The Volume-Weighted Core: Gains and losses are calculated by multiplying the price change by volume to ensure the "Relative Strength" reflects true capital flow.
• Smoothing for Clarity: The raw Volume Weighted RSI (VW-RSI) is processed through a customizable Moving Average—such as SMA, EMA, SMMA, WMA, or VWMA—to produce the smooth histogram.
• Four-Zone Coloring System: The histogram changes color dynamically based on momentum intensity:
o Strong Bull: Price is trending up with high-volume conviction.
o Weak Bull: Positive momentum, but not yet overextended.
o Weak Bear: Negative momentum starting to build.
o Strong Bear: Heavy selling pressure with high-volume conviction.
Key Features
• Shading: The background features optional red and green shading in the "Extreme" zones to warn traders of potential exhaustion areas.
• Dynamic Zero Line: The center line flips color between Green and Red based on whether the VW-RSI is positive or negative.
• Customization: Traders can adjust the smoothing length, source price, and the specific levels for overbought/oversold zones.
Best Use Case for New Traders: New traders often get "faked out" by price spikes that have no volume behind them. This indicator helps confirm and time better entries:
1. Wait for your Cumulative Delta indicator to give a signal.
2. Check the VW-RSI Histogram and whether it confirms or not.
3. Long Entry: Only enter if the histogram is positive and rising (above 0).
4. Short Entry: Only enter if the histogram is negative and decreasing (below 0).
________________________________________
Disclaimer
Financial Risk:
• Trading involves significant risk, and most traders lose money.
• This indicator is a tool for technical analysis and does not constitute financial, investment, or trading advice.
• Past performance is not indicative of future results; never trade with money you cannot afford to lose.
Usage & Reliability:
• The Rhokeo-VW-RSI Histogram is provided "as-is" for educational and informational purposes only.
• While volume-weighting aims to filter market noise, no indicator can guarantee 100% accuracy or predict future market movements with certainty.
• This script is intended to be a complementary tool that works well with other indicators in this case the Cumulative Delta from Zeiirman; it should be used in conjunction with other forms of analysis, risk management, and your own due diligence.
Commercial Notice:
• If you are using this alongside a third-party paid indicator, please note that I am not responsible for the performance or support of external products.
• Users are responsible for their own trade execution and account management.

Deep AILibrary "Deeptest"
Comprehensive quantitative backtesting library with 112+ metrics: Sharpe/Sortino ratios, drawdown analysis, Monte Carlo simulation, Walk-Forward Analysis, VaR/CVaR, benchmark comparison, and interactive table rendering for TradingView strategies
@version 1.0.1 (01.01.2026)
============================================================================
CHANGELOG
============================================================================
v1.0.1 (01.01.2026)
- Added textSize parameter to runDeeptest() for controlling table text size
- New values: size.auto, size.small, size.tiny, size.normal, size.large
- Applies to all tables: main, stress test, drawdowns, recoveries, trades
v1.0.0 (31.12.2025)
- Initial release
- 112+ backtesting metrics
- Monte Carlo simulation and Walk-Forward Analysis
- Interactive table rendering with tooltips
============================================================================
TABLE OF CONTENTS
============================================================================
SECTION 1: File Header & Metadata
SECTION 2: Constants & Configuration
SECTION 3: Type Definitions
SECTION 4: Core Calculation Functions - Array Utilities
SECTION 5: Core Calculation Functions - Return Extraction
SECTION 6: Core Calculation Functions - Sharpe & Sortino
SECTION 7: Core Calculation Functions - Performance Metrics
SECTION 8: Core Calculation Functions - Drawdown Analysis
SECTION 9: Core Calculation Functions - Recovery Analysis
SECTION 10: Core Calculation Functions - Trade Analysis
SECTION 11: Core Calculation Functions - Statistical Distribution
SECTION 12: Core Calculation Functions - Risk Metrics
SECTION 13: Core Calculation Functions - Benchmark Comparison
SECTION 14: Core Calculation Functions - Time-Based Metrics
SECTION 15: Core Calculation Functions - Rolling Statistics
SECTION 16: Core Calculation Functions - Strategy Integration
SECTION 17: Core Calculation Functions - Walk Forward Analysis
SECTION 18: Core Calculation Functions - Monte Carlo Simulation
SECTION 19: Core Calculation Functions - Out-of-Sample Analysis
SECTION 20: Formatting Utilities - Value Formatting
SECTION 21: Formatting Utilities - Duration Formatting
SECTION 22: Formatting Utilities - Frequency Formatting
SECTION 23: Formatting Utilities - Date Formatting
SECTION 24: Tooltip Builders - Main Table Metrics
SECTION 25: Tooltip Builders - Complementary Metrics
SECTION 26: Tooltip Builders - Stress Test Metrics
SECTION 27: Tooltip Builders - Period Analysis Cards
SECTION 28: Table Rendering - Structure Helpers
SECTION 29: Table Rendering - Main Deeptest Table
SECTION 30: Table Rendering - Cell Renderers - Complementary Row
SECTION 31: Table Rendering - Stress Test Table
SECTION 32: Table Rendering - Period Analysis Cards
SECTION 33: Main Entry Point
============================================================================
API REFERENCE
============================================================================
Main Export:
------------
runDeeptest() - Complete backtest analysis orchestrator
============================================================================
KEY FEATURES
============================================================================
- Comprehensive backtesting metrics (112+ functions)
- Rolling window analysis with statistical distributions
- Advanced risk metrics (Sharpe, Sortino, Calmar, Martin, VaR, CVaR)
- Drawdown and recovery analysis
- Monte Carlo simulation and Walk-Forward Analysis
- Trade analysis (top/worst trades, consecutive streaks)
- Benchmark comparison (Alpha, Beta, R², Buy & Hold)
- Interactive table rendering with tooltips
============================================================================
USAGE EXAMPLE
============================================================================
╔══════════════════════════════════════════════════════════════════════════════╗
║ PROGRESSIVE USAGE EXAMPLES ║
╠══════════════════════════════════════════════════════════════════════════════╣
║ Three examples demonstrating increasing complexity: ║
║ 1. MINIMAL - "Hello World" with basic MA crossover ║
║ 2. BALANCED - Production ready with risk management & filters ║
║ 3. PROFESSIONAL - Full-featured with trailing stops & session filters ║
╚══════════════════════════════════════════════════════════════════════════════╝
╔══════════════════════════════════════════════════════════════════════════════╗
║ EXAMPLE 1: MINIMAL (The "Hello World") ║
╠══════════════════════════════════════════════════════════════════════════════╣
║ The simplest possible integration - just 3 lines to get started: ║
║ 1. Import the library ║
║ 2. Write your strategy logic ║
║ 3. Call runDeeptest() ║
╚══════════════════════════════════════════════════════════════════════════════╝
//@version=6
strategy("MA Crossover ", overlay=true)
// ═══════════════════════════════════════════════════════════════════════════
// ⮟ Import Deeptest (Direct import - no namespace prefix needed)
// ═══════════════════════════════════════════════════════════════════════════
import Fractalyst/Deeptest/1 as *
// ────────────────────────────────────────────────────────────────────────────
// Strategy Logic: Simple Moving Average Crossover
// ────────────────────────────────────────────────────────────────────────────
fastMA = ta.sma(close, 10) // Fast MA: 10 periods
slowMA = ta.sma(close, 30) // Slow MA: 30 periods
// Plot MAs for visualization
plot(fastMA, "Fast MA", color=color.blue)
plot(slowMA, "Slow MA", color=color.orange)
// Entry: Long when fast MA crosses above slow MA
if ta.crossover(fastMA, slowMA)
strategy.entry("Long", strategy.long)
// Exit: Close when fast MA crosses below slow MA
if ta.crossunder(fastMA, slowMA)
strategy.close("Long")
// ═══════════════════════════════════════════════════════════════════════════
// ⮟ Run backtest analysis (all parameters use smart defaults)
// ═══════════════════════════════════════════════════════════════════════════
DT.runDeeptest()
╔══════════════════════════════════════════════════════════════════════════════╗
║ EXAMPLE 2: BALANCED (Production Ready) ║
╠══════════════════════════════════════════════════════════════════════════════╣
║ Adds essential production features: ║
║ • User-configurable inputs ║
║ • ADX trend filter to avoid choppy markets ║
║ • Stop loss / Take profit for risk management ║
║ • Custom backtest parameters ║
╚══════════════════════════════════════════════════════════════════════════════╝
//@version=6
strategy("MA Crossover ", overlay=true)
import Fractalyst/Deeptest/1 as *
// ────────────────────────────────────────────────────────────────────────────
// INPUT PARAMETERS
// ────────────────────────────────────────────────────────────────────────────
fastLen = input.int(10, "Fast MA Period", minval=1)
slowLen = input.int(30, "Slow MA Period", minval=1)
riskPct = input.float(2.0, "Risk %", minval=0.1) / 100
slPct = input.float(5.0, "Stop Loss %", minval=0.1) / 100
tpPct = input.float(10.0, "Take Profit %", minval=0.1) / 100
adxThresh = input.int(20, "ADX Trend Threshold")
// ────────────────────────────────────────────────────────────────────────────
// INDICATORS
// ────────────────────────────────────────────────────────────────────────────
fastMA = ta.sma(close, fastLen)
slowMA = ta.sma(close, slowLen)
adx = ta.adx(14)
= ta.dmi(14, 14)
// ────────────────────────────────────────────────────────────────────────────
// FILTERS
// ────────────────────────────────────────────────────────────────────────────
trendConfirmed = adx > adxThresh and diPlus > diMinus
// ────────────────────────────────────────────────────────────────────────────
// STRATEGY LOGIC
// ────────────────────────────────────────────────────────────────────────────
// Entry: MA crossover + trend confirmation
if ta.crossover(fastMA, slowMA) and trendConfirmed
strategy.entry("Long", strategy.long)
// Exit: MA crossunder
if ta.crossunder(fastMA, slowMA)
strategy.close("Long")
// Risk management: Stop loss and take profit
if strategy.position_size > 0
strategy.exit("RM", "Long",
stop=strategy.position_avg_price * (1 - slPct),
limit=strategy.position_avg_price * (1 + tpPct))
// ═══════════════════════════════════════════════════════════════════════════
// ⮟ Run backtest with custom parameters
// ═══════════════════════════════════════════════════════════════════════════
DT.runDeeptest(
riskPerTrade = 1.0, // ← 1% risk per trade
targetMaxDDPct = 15.0, // ← 15% max drawdown target
showStressTest = true, // ← Enable stress test table
showPeriodCards = true, // ← Enable period cards
wfaWindows = 12, // ← Walk-forward windows
mcSimulations = 1000, // ← Monte Carlo runs
bullColor = color.new(#00b9ff, 0),
bearColor = color.new(#ff0051, 0),
benchmarkSymbol = "SPX", // ← Compare to S&P; 500
periodCardMode = "drawdowns", // ← Show drawdown periods
tradeSortBy = "return" // ← Sort by return %
)
╔══════════════════════════════════════════════════════════════════════════════╗
║ EXAMPLE 3: PROFESSIONAL (Full-Featured) ║
╠══════════════════════════════════════════════════════════════════════════════╣
║ Complete professional implementation: ║
║ • Organized input groups for better UX ║
║ • Multiple filters: ADX trend, ATR volatility, Session timing ║
║ • Trailing stop to lock in profits ║
║ • Position highlighting for visual feedback ║
║ • Full parameter customization with inline documentation ║
╚══════════════════════════════════════════════════════════════════════════════╝
//@version=6
runDeeptest(targetMaxDDPct, bullColor, bearColor, tableBg, headerBg, borderColor, textPrimary, textMuted, textSize, showComplementaryRow, showStressTestTable, showDrawdownRecoveryCards, showTradeCards)
Parameters:
targetMaxDDPct (float)
bullColor (color)
bearColor (color)
tableBg (color)
headerBg (color)
borderColor (color)
textPrimary (color)
textMuted (color)
textSize (string)
showComplementaryRow (bool)
showStressTestTable (bool)
showDrawdownRecoveryCards (bool)
showTradeCards (bool)
ThresholdConfig
ThresholdConfig - Configuration for metric thresholds and corresponding colors
Fields:
sharpeExc (series float)
sharpeGood (series float)
sharpeOk (series float)
sharpeBear (series color)
sharpeNeutral (series color)
sharpeOrange (series color)
sharpeBull (series color)
ddSevere (series float)
ddMod (series float)
ddMild (series float)
ddSevereColor (series color)
ddModColor (series color)
ddOrange (series color)
ddGoodColor (series color)
rorHigh (series float)
rorMod (series float)
rorLow (series float)
rorHighColor (series color)
rorModColor (series color)
rorOrange (series color)
rorLowColor (series color)
r2Poor (series float)
r2Mod (series float)
r2Good (series float)
r2PoorColor (series color)
r2ModColor (series color)
r2Orange (series color)
r2GoodColor (series color)
kurtHigh (series float)
kurtMod (series float)
kurtOk (series float)
kurtHighColor (series color)
kurtModColor (series color)
kurtOrange (series color)
kurtGoodColor (series color)
skewVNeg (series float)
skewModNeg (series float)
skewPos (series float)
skewVPos (series float)
skewVNegColor (series color)
skewModNegColor (series color)
skewNeutral (series color)
skewPosColor (series color)
payoffPoor (series float)
payoffBE (series float)
payoffGood (series float)
payoffPoorColor (series color)
payoffBEColor (series color)
payoffOrange (series color)
payoffGoodColor (series color)
pfPoor (series float)
pfBE (series float)
pfGood (series float)
pfPoorColor (series color)
pfBEColor (series color)
pfOrange (series color)
pfGoodColor (series color)
ulcerHigh (series float)
ulcerLow (series float)
ulcerHighColor (series color)
ulcerModColor (series color)
ulcerOrange (series color)
ulcerLowColor (series color)
wrLow (series float)
wrOk (series float)
wrHigh (series float)
wrLowColor (series color)
wrOkColor (series color)
wrOrange (series color)
wrHighColor (series color)
cagrPoor (series float)
cagrOk (series float)
cagrGood (series float)
cagrPoorColor (series color)
cagrOkColor (series color)
cagrOrange (series color)
cagrGoodColor (series color)
pInsig (series float)
pMod (series float)
pSig (series float)
pInsigColor (series color)
pModColor (series color)
pOrange (series color)
pSigColor (series color)
calmarPoor (series float)
calmarBE (series float)
calmarGood (series float)
calmarPoorColor (series color)
calmarBEColor (series color)
calmarOrange (series color)
calmarGoodColor (series color)
betaHigh (series float)
betaLow (series float)
betaHighColor (series color)
betaLowColor (series color)
betaGoodColor (series color)
Stats
Stats - Comprehensive backtest statistics container
Fields:
totalTrades (series int)
winTrades (series int)
lossTrades (series int)
evenTrades (series int)
winRate (series float)
lossRate (series float)
avgWinPct (series float)
avgLossPct (series float)
avgTradePct (series float)
profitFactor (series float)
payoffRatio (series float)
expectancy (series float)
grossProfit (series float)
grossLoss (series float)
netProfit (series float)
netProfitPct (series float)
compEffect (series float)
sharpe (series float)
sortino (series float)
calmar (series float)
martin (series float)
maxDrawdown (series float)
maxDrawdownPct (series float)
currentDrawdown (series float)
currentDrawdownPct (series float)
avgDrawdownPct (series float)
maxEquity (series float)
minEquity (series float)
cagr (series float)
monthlyReturn (series float)
maxConsecWins (series int)
maxConsecLosses (series int)
avgTradeDuration (series float)
avgWinDuration (series float)
avgLossDuration (series float)
timeInMarketPct (series float)
tradesPerMonth (series float)
tradesPerYear (series float)
skewness (series float)
kurtosis (series float)
var95 (series float)
cvar95 (series float)
ulcerIndex (series float)
riskOfRuin (series float)
pValue (series float)
zScore (series float)
alpha (series float)
beta (series float)
buyHoldReturn (series float)
equityRSquared (series float)
firstTradeTime (series int)
lastTradeTime (series int)
tradingPeriodDays (series float)
RollingWindowSummary
RollingWindowSummary - Summary of metrics for a single rolling analysis window
Fields:
windowIndex (series int)
startTrade (series int)
endTrade (series int)
effectiveCount (series int)
minValue (series float)
maxValue (series float)
metricValue (series float)
RollingStats
RollingStats - Statistical distribution of rolling window metrics
Fields:
windowSize (series int) : Number of trades in rolling window
expectancyMin (series float) : Minimum rolling expectancy
expectancyMax (series float) : Maximum rolling expectancy
sharpeMin (series float) : Minimum rolling Sharpe
sharpeMax (series float) : Maximum rolling Sharpe
sortinoMin (series float) : Minimum rolling Sortino
sortinoMax (series float) : Maximum rolling Sortino
expectancyWindows (array) : Per-window summaries for expectancy
sharpeWindows (array) : Per-window summaries for Sharpe
sortinoWindows (array) : Per-window summaries for Sortino
expectancyMean (series float) : Mean expectancy across rolling windows
expectancyStdDev (series float) : Standard deviation of expectancy
expectancyPct90 (series float) : 90th percentile expectancy
expectancyPct50 (series float) : 50th percentile expectancy (median)
expectancyPct10 (series float) : 10th percentile expectancy
sharpeMean (series float) : Mean Sharpe across rolling windows
sharpeStdDev (series float) : Standard deviation of Sharpe
sharpePct90 (series float) : 90th percentile Sharpe
sharpePct50 (series float) : 50th percentile Sharpe
sharpePct10 (series float) : 10th percentile Sharpe
sortinoMean (series float) : Mean Sortino across rolling windows
sortinoStdDev (series float) : Standard deviation of Sortino
sortinoPct90 (series float) : 90th percentile Sortino
sortinoPct50 (series float) : 50th percentile Sortino
sortinoPct10 (series float) : 10th percentile Sortino

Chande Momentum Oscillator - CMO🎯 Overview
This is a sophisticated Chande Momentum Oscillator indicator that combines traditional momentum analysis with dynamic moving average filtering. Unlike basic CMO implementations, this version features gradient visualization, multiple color themes, and a clear signal dashboard for precise momentum identification.
🧩 Core Components
1. ⚙️ Technical Foundation
📊 Primary Calculation: Uses TradingView's built-in ta.cmo() function with customizable source and period length
📈 Dual Analysis Components:
CMO Line: Pure momentum oscillator ranging from -100 to +100
MA Filter: Customizable moving average that acts as dynamic signal line
Gradient Zones: Visual fill between CMO and MA showing momentum intensity
⚡ Dynamic Comparison: Creates clear bullish/bearish signals based on CMO vs MA position
2. 🎛️ Configuration Parameters
📏 CMO Length: Default 14 periods (standard momentum setting)
🔄 MA Filter Settings:
Length: Customizable (default 365 periods)
Type: 6 options available (EMA, SMA, RMA, WMA, VWMA, HMA)
🎨 Color Themes: 5 visual schemes consistent with your indicator suite:
Classic, Modern, Robust, Accented, Monochrome
📊 Signal Interpretation:
🟢 BULLISH: CMO > MA Filter (momentum above trend)
🔴 BEARISH: CMO < MA Filter (momentum below trend)
3. 🎨 Visual Elements
🚨 Gradient Zones:
Upper zone (CMO > MA): Green gradient showing bullish momentum intensity
Lower zone (CMO < MA): Red gradient showing bearish momentum intensity
📋 Dashboard Display: Top-right status indicator showing "⬆️ Bullish" or "⬇️ Bearish"
📊 Dynamic Coloring: CMO line changes color based on position relative to MA
⚡ Trading Applications
📈 Primary Uses:
🎯 Momentum Direction Identification:
CMO > MA = Bullish momentum regime
CMO < MA = Bearish momentum regime
💪 Momentum Strength Assessment:
CMO > +50 = Strong bullish momentum
CMO < -50 = Strong bearish momentum
Between -50 and +50 = Moderate momentum
🚨 Crossover Signals:
Bull Signal: CMO crosses above MA
Bear Signal: CMO crosses below MA
📊 Zone Analysis:
🟢 Bullish Zones:
Light to dark green gradient as CMO rises
Strongest color at highest CMO values
🔴 Bearish Zones:
Light to dark red gradient as CMO falls
Strongest color at lowest CMO values
🟡 Equilibrium: Yellow MA line acts as dynamic pivot
🎨 Customization Options
👁️ Display Features:
📊 Dual Components: Always shows both CMO line and MA filter
🎨 Gradient Visualization: Automatic fill between lines showing momentum intensity
📋 Status Dashboard: Clear bullish/bearish indication
📈 Customizable MA: Choose from 6 different moving average types
🎨 Visual Themes: (Consistent suite)
🎨 Classic: Green/Red (traditional momentum colors)
🚀 Modern: Cyan/Purple (contemporary)
💪 Robust: Amber/Deep Purple (high contrast)
🌈 Accented: Purple/Magenta (vibrant)
⚫⚪ Monochrome: Light Gray/Dark Gray (minimalist)
🔔 Alert System
🟢 LONG Alert: Triggers when CMO crosses above MA
🔴 SHORT Alert: Triggers when CMO crosses below MA
📧 Format: Includes ticker symbol for tracking
⚡ Key Advantages
✅ Strengths:
🎯 Clear Momentum Signals: Direct comparison between CMO and MA provides unambiguous entries/exits
💪 Trend Filter: MA acts as dynamic support/resistance for momentum
👁️ Visual Clarity: Gradient zones show momentum intensity at a glance
🔄 Flexible Configuration: Multiple MA types for different trading styles
📊 Professional Dashboard: Immediate status recognition
📊 Optimal Settings:
⚡ Short-term Trading: CMO Length 9-14, MA Length 20-50
📊 Medium-term Trading: CMO Length 14-20, MA Length 50-100
📈 Long-term Trading: CMO Length 20-30, MA Length 100-365
🏆 Unique Features:
🎯 Gradient Visualization: Color intensity reflects momentum strength
📊 MA Filter Flexibility: 6 different moving average types
🎨 Consistent Design: Matches your indicator family aesthetics
📋 Status Dashboard: Quick visual confirmation of regime
🔧 Dual Analysis: Combines momentum oscillator with trend filter
🔄 Trading Strategies
1. Basic Momentum Strategy:
Go LONG when CMO crosses above MA
Go SHORT when CMO crosses below MA
Use extreme readings (>+80 or <-80) for overbought/oversold conditions
2. Momentum Strength Strategy:
Strong bullish: CMO > MA AND CMO > +50
Strong bearish: CMO < MA AND CMO < -50
Weak signals: Between -50 and +50
3. Divergence Detection:
Price makes higher high, CMO makes lower high → Bearish divergence
Price makes lower low, CMO makes higher low → Bullish divergence
📈 Performance Tips
Combine with Trend: Use in trending markets (avoid ranging periods)
Confirmation: Wait for candle close after MA crossover
Extreme Readings: +80/-80 often precede reversals
MA Selection: EMA for responsiveness, SMA for smoothness
Multiple Timeframes: Check higher timeframe CMO alignment
This enhanced CMO indicator provides professional-grade momentum analysis with intuitive visualization, allowing traders to quickly identify momentum regimes and strength while filtering out market noise through the customizable moving average filter! 📊🎯

Quarterlytheory Candles [Fractal Edition Pro+] by aamirlangQuarterlytheory Candles - by aamirlang
Overview
Quarterlytheory Candles is a comprehensive multi-timeframe Smart Money Concepts (SMC) indicator designed for precision trading based on quarterly theory, institutional order flow, and advanced market structure analysis. This indicator combines Higher Timeframe (HTF) candle visualization, liquidity sweeps, market structure shifts, Fair Value Gaps (FVGs), and Smart Money Tool (SMT) divergences to provide traders with institutional-level insights.
Core Features
1. HTF Candles with Quarter-Based System
Adaptive Timeframe Selection: Automatically calculates optimal Higher Timeframe based on your chart timeframe
1m chart → 23m HTF (Q1-Q4 quarters)
5m chart → 90m HTF (Q1-Q4 quarters)
15m/60m chart → 360m/6H HTF (Asia/London/NY AM/NY PM sessions)
Daily chart → Weekly/Monthly HTF
Weekly chart → Monthly/Quarterly HTF
Visual HTF Candle Display:
Shows up to 50 HTF candles with customizable offset
Bullish/Bearish body and wick coloring
Real-time candle formation with live updates
Quarter labels (Q1, Q2, Q3, Q4) or session names (Asia, London, NY AM, NY PM)
Countdown timer showing time remaining in current HTF period
HTF Open Line: Displays the opening price of each HTF candle with customizable style
HTF Fair Value Gaps: Identifies imbalances (BISI/SIBI) on HTF candles
2. C2 Setup Detection
The cornerstone of this indicator - identifies high-probability reversal setups:
C2 Buy Signal: Occurs when HTF candle sweeps previous HTF low and closes back above it
C2 Sell Signal: Occurs when HTF candle sweeps previous HTF high and closes back below it
C2 Confirmation System:
CISD Pattern (Change In State of Delivery): Validates sweep with price reclaiming CISD level
Multi-Period Validation: Confirms setups within 2 HTF periods
C3 Box: Shows HTF open to previous HTF EQ (50% level)
C4 Setup: Secondary setup when C3 EQ is favorable relative to HTF open
Standard Deviation Levels: Automatically calculates extension targets (-1, -2, -2.5, -4, -4.5)
Visual Elements:
C2/C4 labels with transparent backgrounds
T-Spot boxes highlighting setup zones (bullish=green, bearish=red)
CISD confirmation lines
Setup invalidation tracking (XC2/XC4 labels when stop hit)
3. Current Range Tool (CRT)
Displays three critical levels from the most recently closed HTF candle:
HTF High (red dotted line)
HTF EQ/Midpoint (gray dotted line)
HTF Low (green dotted line)
These levels serve as key support/resistance and targets for current HTF period.
4. Market Structure Shifts (MSS)
Automatically detects bullish and bearish market structure breaks
Uses fractal-based swing detection (customizable period: 1-15)
Color-coded MSS lines (blue=bullish, red=bearish)
Labels mark precise MSS points
5. Fair Value Gaps (FVG)
Bullish FVGs (BISI - Buy Side Imbalance Sell Side Inefficiency): Blue zones
Bearish FVGs (SIBI - Sell Side Imbalance Buy Side Inefficiency): Red zones
Mitigation Tracking: Changes to gray when price taps the zone
Automatically manages up to 50 FVGs (configurable)
6. Confirmed HTF Swing Levels
Draws horizontal lines at confirmed swing highs/lows
Confirmation Logic: HTF candle sweeps a level AND next candle closes with rejection
Lines extend for customizable overshoot bars
Useful for identifying swept liquidity levels
7. LTF Sweep Detection
Identifies when HTF candles sweep previous HTF candle highs/lows
Draws sweep lines on main chart at swept levels
Helps visualize liquidity grabs in real-time
8. Trading Sessions & Killzones -
Highlights key institutional trading sessions:
Asia Session (18:00-00:00 NY time) - Gray
London Session (00:00-06:00 NY time) - Red
NY AM Session (06:00-12:00 NY time) - Green
NY PM Session (12:00-18:00 NY time) - Blue
Session Features:
Customizable box colors and transparency
Session high/low pivot lines
Pivot labels with optional price display
Session open lines ("True Day/Asia/London/NY Open")
Days of week labels (MON, TUE, WED, etc.)
Daily/Weekly/Monthly open lines and high/low pivots
9. Smart Money Tool (SMT) Divergences
Compares your chart with two other symbols to identify divergences:
Symbol 1 (default: TVC:DXY - US Dollar Index)
Symbol 2 (default: OANDA:GBPUSD)
10. Information Tables
Two customizable watermark tables:
Info Table: Shows ticker, LTF, HTF, countdown timer, and bias
Personal Table: Customizable inspirational message
How to Use This Indicator
Getting Started
Add to Chart: Apply indicator to your preferred timeframe (works best on 1m, 5m, 15m, 60m, Daily)
Review HTF Candles: Check the HTF candles displayed on the right side with quarter/session labels
Monitor CRT Levels: Watch the dotted High/EQ/Low lines from previous closed HTF candle
Wait for C2 Setup: Look for C2 labels appearing after HTF sweep + CISD confirmation
Trading the C2 Setup
For Long Positions (C2 Buy):
Wait for HTF candle to sweep previous HTF low (price goes below previous HTF low)
HTF candle closes back above the swept low (rejection)
CISD confirmation: Price reclaims the CISD level (blue line)
C2 label appears at the swept low
T-Spot (green box) shows optimal entry zone between HTF open and previous HTF EQ
Standard Deviation levels provide targets (-1, -2, -2.5, -4, -4.5 from CISD swing)
Stop Loss: Above C2 label level (swept low)
Invalidation: If stop hit, label changes to XC2 in red
For Short Positions (C2 Sell):
Wait for HTF candle to sweep previous HTF high (price goes above previous HTF high)
HTF candle closes back below the swept high (rejection)
CISD confirmation: Price breaks below the CISD level (blue line)
C2 label appears at the swept high
T-Spot (red box) shows optimal entry zone between HTF open and previous HTF EQ
Standard Deviation levels provide targets (-1, -2, -2.5, -4, -4.5 from CISD swing)
Stop Loss: Below C2 label level (swept high)
Invalidation: If stop hit, label changes to XC2 in red
Advanced Techniques
Using Bias Filter:
Auto: Allows both long and short setups
Bullish: Only shows long setups (filters out shorts)
Bearish: Only shows short setups (filters out longs)
Combining with Sessions:
Trade C2 setups that occur during high-volume sessions (London/NY AM)
Use session highs/lows as additional confluence
Avoid setups during low-volume periods (late NY PM/early Asia)
FVG Confluence:
Look for C2 setups that align with unfilled FVGs
Target FVGs as potential reversal zones
Use mitigated FVGs as trailing stop areas
MSS Confirmation:
Stronger setups occur after MSS in the C2 direction
Wait for bullish MSS before taking C2 long setups
Wait for bearish MSS before taking C2 short setups
SMT Divergence:
Use SMT divergences as additional confirmation
If DXY shows divergence at your C2 level = higher probability setup
Helps filter false setups and identify institutional manipulation
Risk Management
Maximum 2 HTF periods: C2 setups invalidate if stop not hit within 2 HTF candles
C4 Secondary Setup: If C3 EQ is favorable, you may get a C4 continuation setup
Std Dev Targets: Scale out at -1, -2, -2.5 levels; let runner go to -4/-4.5
Monitor CRT Levels: Previous HTF high/low often act as magnets for price
⚙️ Customization Options
HTF Candles Settings
Toggle HTF Candles display on/off
Fractal mode (uses fractal-based HTF calculation)
Number of candles to display (1-50)
Offset positioning
HTF labels with custom size and color
Body, border, and wick colors for bull/bear candles
FVG zones on HTF candles
HTF Open line style, color, width
Watermark tables (position, text customization)
General Settings
T-Spot box toggle and colors
Bias filter (Auto/Bullish/Bearish)
Market Structure markers (HH/HL/LH/LL)
Vertical lines for HTF candle open/close
CRT lines (High/Low/EQ) with color and width customization
MSS detection toggle with bull/bear colors
Fractal period (1-15)
FVG detection with bull/bear colors, mitigated color
Maximum FVGs to track (1-50)
StdDs toggle with custom levels input
Sessions and Pivots Settings
Timeframe limit (prevents display on higher TFs)
Toggle each session individually (Asia/London/NY AM/NY PM/Extra)
Custom session times and colors
Box transparency control
Session labels toggle
Session high/low pivot lines
Pivot label price display
Alert on broken pivots
D/W/M open lines
D/W/M high/low lines
Days of week labels
True session opens (custom session times for precise opens)
Line styles and widths
SMT Settings
Symbol 1 and Symbol 2 selection
Invert symbol options (for inverse correlations)
Historical data toggle
Alerts
C2 Setup Alerts (long and short)
Sweep Alerts (optional)
MSS Alerts (optional)
FVG Alerts (optional)
Broken Pivot Alerts (optional)
Label System
C2: Confirmed setup label
C4: Secondary setup label
XC2: Invalidated C2 (red if hit on HTF 1, orange if HTF 2)
XC4: Invalidated C4 (red)
MSS: Market structure shift
Q1, Q2, Q3, Q4: Quarter labels for sub-session HTF
Asia, London, NY AM, NY PM: Session labels for 6H HTF
MON, TUE, WED, etc.: Day of week labels
HH, HL, LH, LL: Market structure markers
Std Dev Labels: -1, -2, -2.5, -4, -4.5
Best Practices
For Day Traders (1m, 5m charts)
Use fractal mode for cleaner HTF calculation
Focus on London and NY AM sessions for volume
Trade C2 setups aligned with session bias
Use -1 and -2 Std Dev levels as initial targets
Monitor SMT divergences for confirmation
For Swing Traders (15m, 60m, Daily charts)
Use standard HTF mode for accurate session mapping
Focus on C2 setups at major session opens (Daily, Weekly)
Target -4 and -4.5 Std Dev levels
Use Weekly/Monthly pivots for additional confluence
Allow 2 full HTF periods for setup to play out
For All Traders
Journal your C2 setups: Track success rate, best sessions, best Std Dev targets
Use bias filter strategically: If trending strongly, filter counter-trend setups
Combine with price action: C2 is a framework, not a mechanical system
Respect CRT levels: Previous HTF high/EQ/low are magnets
Don't force trades: Quality > quantity with C2 setups
Backtest on your instrument: Every market has nuances
🔔 Alert Configuration
This indicator supports TradingView alerts:
Click "Create Alert" on TradingView
Select "Quarterlytheory Candles" as condition
Choose alert type:
"Long Trade Alert!" - Fires when C2 Buy confirmed
"Short Trade Alert!" - Fires when C2 Sell confirmed
Set "Once Per Bar Close" frequency
Customize alert actions (notification, email, webhook, sound)
Pro Tip: Use webhook alerts to connect to Discord, Telegram, or trading bots for automated notifications.
⚠️ DISCLAIMER
FOR EDUCATIONAL PURPOSES ONLY
This indicator is provided as an educational tool for learning about Smart Money Concepts, quarterly theory, and institutional order flow analysis. It is NOT financial advice.
Important Notices:
Trading involves substantial risk of loss and is not suitable for everyone
Past performance does not guarantee future results
No indicator can predict market movements with certainty
The developer (aamirlang) is not a registered financial advisor
Always use proper risk management and position sizing
Never risk more than you can afford to lose
This indicator does not guarantee profitable trades
Users are solely responsible for their trading decisions
Test thoroughly on paper/demo accounts before risking real capital
Market conditions change; what works today may not work tomorrow
Technical Disclaimer:
This indicator may repaint on unconfirmed bars (use confirmed signals only)
Higher timeframe calculations may vary slightly from standard TradingView HTF functions
Performance may vary across different instruments and market conditions
Ensure adequate chart history is loaded for accurate calculations
By using this indicator, you acknowledge:
You understand the risks of trading
You have tested this indicator thoroughly
You take full responsibility for all trading decisions
You will not hold the developer liable for any losses
🙏 CREDITS & ACKNOWLEDGMENTS
This indicator builds upon the excellent work of several open-source contributors and combines concepts from various trading methodologies. Full credit and gratitude to:
Core Concepts & Methodology
@traderdaye: I have used the Quarterly theory concepts and True opens of Daye.
@TTrades_edu: The foundational C2/C3/C4 setup structure and CISD pattern detection methodology that forms the core of this indicator
ICT (Inner Circle Trader): Smart Money Concepts framework, killzones, liquidity concepts, and FVG theory
Open Source Code Components
1. Smart Money Tool (SMT) Divergence Detection
Original Author: Algoryze
Component: SMT divergence calculation and visualization system
Contribution: Multi-symbol comparison logic, fractal-based swing detection for divergences
License: Open source (TradingView Public Library)
2. Killzones and Pivot System
Original Author: Tradeforopp
Component: Trading session boxes, pivot high/low detection, D/W/M separators and opens
Contribution: Session time management, pivot line extensions, timezone handling
License: Open source (TradingView Public Library)
Modifications & Enhancements by aamirlang
Integrated all components into unified quarterly theory framework
Developed adaptive HTF calculation system with quarter-based labeling
Created C2/C3/C4 setup detection logic with CISD confirmation
Implemented Standard Deviation target system
Built HTF candle visualization engine with custom quarter formatting
Added Current Range Tool (CRT) for previous HTF levels
Developed setup invalidation tracking system
Created custom watermark and information tables
Implemented confirmed swing detection and LTF sweep visualization
Added comprehensive alert system
Optimized performance and visual clarity
Enhanced customization options throughout
Community & Inspiration
TradingView Community: For feedback, testing, and continuous improvement suggestions
SMC Trading Community: For sharing knowledge on institutional order flow
Pine Script™ Documentation: For technical reference and best practices
Special Thanks
To all traders who have shared their experiences with quarterly theory
To the open-source trading community for fostering collaboration
To early testers who provided valuable feedback
📝 Version Information
Current Version: Fractal Edition Pro+
Indicator Name: Quarterlytheory Candles by aamirlang
Pine Script™ Version: 5
Last Updated: 2026
Compatibility: TradingView Free, Pro, Pro+, Premium plans
📧 Contact & Support
For questions, suggestions, or to report issues:
Before reaching out:
Read this description thoroughly
Check indicator settings and tooltips
Test on demo account first
Review TradingView's Pine Script™ documentation
🔄 Future Development
Potential enhancements under consideration:
Multi-timeframe dashboard view
Custom alert message templates
Volume profile integration
Enhanced session statistics table
Liquidity heatmap visualization
Trade journal integration
C2 Setup analysis and statistics
Auto Bias detection and implementation
Auto SSMT and SMT
PSP Detection
Feature requests are welcome via TradingView comments section.
📜 License
This indicator combines original code by aamirlang with modified open-source components from Algoryze (SMT) and Tradeforopp (Killzones/Pivots).
This indicator is shared for educational purposes. Redistribution or resale of this indicator or its components without proper attribution is prohibited.

colors_library# ColorsLibrary - PineScript v6
A comprehensive PineScript v6 library containing **10 color themes** and utility functions for TradingView.
---
## 📦 Installation
```pinescript
import TheTradingSpiderMan/colors_library/1 as CLR
```
---
## 🎨 All Available Color Themes (10)
### Default Theme (Green/Red - Classic Trading)
| Function | Description |
| ------------------ | --------------- |
| `defaultBull()` | Green (#26A69A) |
| `defaultBear()` | Red (#EF5350) |
| `defaultNeutral()` | Grey (#787B86) |
### Monochrome Theme (White/Grey/Black)
| Function | Description |
| --------------- | -------------------- |
| `monoBull()` | White (#FFFFFF) |
| `monoBear()` | Black (#000000) |
| `monoNeutral()` | Grey (#808080) |
| `monoLight()` | Light Grey (#C0C0C0) |
| `monoDark()` | Dark Grey (#404040) |
### Vaporwave Theme (Purple/Pink, Blue/Cyan)
| Function | Description |
| ---------------- | ----------------------- |
| `vaporBull()` | Cyan (#00FFFF) |
| `vaporBear()` | Magenta (#FF00FF) |
| `vaporNeutral()` | Grey (#787B86) |
| `vaporPurple()` | Purple (#9B59B6) |
| `vaporPink()` | Hot Pink (#FF6EC7) |
| `vaporBlue()` | Electric Blue (#0080FF) |
### Neon Theme (Bright Fluorescent Colors)
| Function | Description |
| --------------- | --------------------- |
| `neonBull()` | Neon Green (#39FF14) |
| `neonBear()` | Neon Red (#FF073A) |
| `neonNeutral()` | Grey (#787B86) |
| `neonYellow()` | Neon Yellow (#FFFF00) |
| `neonOrange()` | Neon Orange (#FF6600) |
| `neonBlue()` | Neon Blue (#00BFFF) |
### Ocean Theme (Blues and Teals)
| Function | Description |
| ---------------- | ------------------- |
| `oceanBull()` | Teal (#20B2AA) |
| `oceanBear()` | Deep Blue (#1E3A5F) |
| `oceanNeutral()` | Grey (#787B86) |
| `oceanAqua()` | Aqua (#00CED1) |
| `oceanNavy()` | Navy (#000080) |
| `oceanSeafoam()` | Seafoam (#3EB489) |
### Sunset Theme (Oranges, Yellows, Reds)
| Function | Description |
| ----------------- | ----------------------- |
| `sunsetBull()` | Golden Yellow (#FFD700) |
| `sunsetBear()` | Crimson (#DC143C) |
| `sunsetNeutral()` | Grey (#787B86) |
| `sunsetOrange()` | Orange (#FF8C00) |
| `sunsetCoral()` | Coral (#FF7F50) |
| `sunsetPurple()` | Twilight (#8B008B) |
### Forest Theme (Greens and Browns)
| Function | Description |
| ----------------- | ---------------------- |
| `forestBull()` | Forest Green (#228B22) |
| `forestBear()` | Brown (#8B4513) |
| `forestNeutral()` | Grey (#787B86) |
| `forestLime()` | Lime Green (#32CD32) |
| `forestOlive()` | Olive (#6B8E23) |
| `forestEarth()` | Earth Brown (#704214) |
### Candy Theme (Pastel/Soft Colors)
| Function | Description |
| ----------------- | -------------------- |
| `candyBull()` | Mint Green (#98FB98) |
| `candyBear()` | Soft Pink (#FFB6C1) |
| `candyNeutral()` | Grey (#787B86) |
| `candyLavender()` | Lavender (#E6E6FA) |
| `candyPeach()` | Peach (#FFDAB9) |
| `candySky()` | Sky Blue (#87CEEB) |
### Fire Theme (Reds, Oranges, Yellows)
| Function | Description |
| --------------- | ---------------------- |
| `fireBull()` | Flame Orange (#FF5722) |
| `fireBear()` | Dark Red (#B71C1C) |
| `fireNeutral()` | Grey (#787B86) |
| `fireYellow()` | Flame Yellow (#FFC107) |
| `fireEmber()` | Ember (#FF6F00) |
| `fireAsh()` | Ash Grey (#424242) |
### Ice Theme (Cool Blues and Whites)
| Function | Description |
| -------------- | ---------------------- |
| `iceBull()` | Ice Blue (#B3E5FC) |
| `iceBear()` | Frost Blue (#0277BD) |
| `iceNeutral()` | Grey (#787B86) |
| `iceWhite()` | Snow White (#F5F5F5) |
| `iceCrystal()` | Crystal Blue (#81D4FA) |
| `iceFrost()` | Frost (#4FC3F7) |
---
## 🔧 Selector & Utility Functions
| Function | Description |
| -------------------- | --------------------------------------------------- |
| `bullColor()` | Get bullish color by theme name |
| `bearColor()` | Get bearish color by theme name |
| `trendColor()` | Returns bull/bear color based on boolean condition |
| `gradientColor()` | Creates gradient between bull/bear (0-100 value) |
| `rsiGradient()` | RSI-style coloring (oversold=bull, overbought=bear) |
| `candleColor()` | Returns color based on candle direction |
| `volumeColor()` | Returns color based on close vs previous close |
| `withTransparency()` | Applies transparency to any color |
| `getAllThemes()` | Returns comma-separated list of all theme names |
| `getThemeOptions()` | Returns array of theme names for input options |
---
## 🔧 Usage Examples
### Basic Usage
```pinescript
//@version=6
indicator("Color Example")
import quantablex/colors_library/1 as CLR
// Direct color usage
plot(close, "Close", CLR.defaultBull())
plot(open, "Open", CLR.defaultBear())
// With transparency
plot(high, "High", CLR.vaporPurple(50))
```
### Using Theme Selector
```pinescript
//@version=6
indicator("Theme Selector")
import quantablex/colors_library/1 as CLR
theme = input.string("DEFAULT", "Color Theme",
options= )
bullCol = CLR.bullColor(theme)
bearCol = CLR.bearColor(theme)
plot(close, "Close", close >= open ? bullCol : bearCol)
```
### Trend Coloring
```pinescript
//@version=6
indicator("Trend Colors")
import quantablex/colors_library/1 as CLR
theme = input.string("VAPOR", "Theme")
ma = ta.ema(close, 20)
// Auto trend color based on condition
trendCol = CLR.trendColor(close > ma, theme)
plot(ma, "EMA", trendCol, 2)
```
### Gradient & RSI Coloring
```pinescript
//@version=6
indicator("Gradient Example")
import quantablex/colors_library/1 as CLR
rsi = ta.rsi(close, 14)
// Gradient based on RSI value
gradCol = CLR.gradientColor(rsi, "NEON")
plot(rsi, "RSI", gradCol)
// Or use built-in RSI gradient
rsiCol = CLR.rsiGradient(rsi, "DEFAULT")
bgcolor(rsiCol, transp=90)
```
### Candle & Volume Coloring
```pinescript
//@version=6
indicator("Candle Colors", overlay=true)
import quantablex/colors_library/1 as CLR
theme = input.string("FIRE", "Theme")
// Auto candle coloring
barcolor(CLR.candleColor(theme))
// Volume bars colored by direction
plotshape(volume, style=shape.circle, color=CLR.volumeColor(theme, 30))
```
---
## 🎨 Theme Selection Guide
| Use Case | Recommended Themes |
| --------------------- | --------------------- |
| **Classic Trading** | DEFAULT, MONO |
| **Dark Mode Charts** | NEON, VAPOR, ICE |
| **Light Mode Charts** | CANDY, SUNSET, FOREST |
| **High Visibility** | NEON, FIRE |
| **Low Eye Strain** | OCEAN, CANDY, ICE |
| **Professional Look** | MONO, DEFAULT, OCEAN |
| **Aesthetic/Stylish** | VAPOR, SUNSET, CANDY |
---
## ⚙️ Parameters Reference
### Common Parameters
- `transparency` - Transparency level (0-100, where 0=opaque, 100=invisible)
### Selector Parameters
- `theme` - Theme name string: `DEFAULT`, `MONO`, `VAPOR`, `NEON`, `OCEAN`, `SUNSET`, `FOREST`, `CANDY`, `FIRE`, `ICE`
---
## 📝 Notes
- All functions accept optional `transparency` parameter (default 0)
- Theme selector functions default to `DEFAULT` theme if invalid name provided
- Use `getAllThemes()` to get comma-separated list of all theme names
- Use `getThemeOptions()` to get array for `input.string` options
- All 50+ color functions are exported for direct use
---
**Author:** thetradingspiderman
**Version:** 1.0
**PineScript Version:** 6
**Total Themes:** 10
**Total Color Functions:** 50+

SMC Precision Scalper# SMC Precision Scalper - All-in-One Smart Money Analysis Tool
## Overview
SMC Precision Scalper is a comprehensive technical analysis indicator combining Smart Money Concepts (SMC) methodology with advanced scalping tools. This indicator integrates institutional trading concepts to provide traders with high-probability confluence zones and market structure analysis.
---
## How It Works - Technical Methodology
### Order Block Detection System
**Detection Algorithm:**
The script identifies Order Blocks using a three-criteria validation process:
1. **Pattern Recognition**: Scans for consolidation candles (opposite color to trend) that precede strong impulse moves
2. **Impulse Validation**: The following candle must break the high/low of the consolidation candle
- Strict Mode: Impulse candle must fully engulf the Order Block
- Standard Mode: Impulse candle must only break the OB high/low
3. **Volatility Filtering**: Applies ATR (Average True Range) or CMR (Cumulative Mean Range) filters with adjustable multiplier (default 0.5x) to eliminate noise
**Mitigation Tracking:**
Order Blocks are monitored until price retraces to their 50% level (midpoint). Mitigation can be calculated by either:
- Close price crossing the midpoint
- Wick penetration of the midpoint
Internal Order Blocks use shorter swing length (default 5 periods) for intraday precision, while standard OBs use longer swings (default 10 periods) for structural zones.
---
### Fair Value Gap (FVG) Calculation
**Gap Detection:**
FVGs are identified when:
Bullish FVG: (candle.low - candle.high) > ATR(14) × threshold
Bearish FVG: (candle.low - candle.high) > ATR(14) × threshold
Default threshold: 0.3x ATR multiplier
**Visual Rendering:**
Each FVG is rendered as 13 horizontal layers to show the liquidity void depth. The script tracks consecutive FVGs to adjust layer positioning dynamically.
**Mitigation Logic:**
FVGs remain active until price fully crosses the gap zone (high > gap bottom AND low < gap top). Optionally displays "filled" FVGs with reduced opacity for historical reference.
---
### EMA Confluence & Flips System
**Core Components:**
- EMA Fast: 5-period exponential moving average
- EMA Slow: 12-period exponential moving average
- EMA Confluence: 200-period exponential moving average (customizable)
**Flip Detection:**
Generates signals when EMA 5 crosses EMA 12:
- Flip Up (↑): EMA 5 crosses above EMA 12
- Flip Down (↓): EMA 5 crosses under EMA 12
**Trend Filter:**
Optional confluence filter requires:
- Uptrend confirmation: Close > EMA Confluence for N bars (adjustable)
- Downtrend confirmation: Close < EMA Confluence for N bars
This prevents counter-trend signals and improves accuracy.
---
### EMA Cloud Layers
**Calculation:**
Creates three multi-timeframe cloud zones using paired EMAs:
- Cloud 1: EMA 20 / EMA 42
- Cloud 2: EMA 8 / EMA 23
- Cloud 3: EMA 5 / EMA 50
**Color Logic:**
- Green cloud: Faster EMA > Slower EMA (bullish momentum)
- Red cloud: Faster EMA < Slower EMA (bearish momentum)
Each cloud has progressive transparency (10%, 16%, 22%) to show momentum strength layers.
---
### VWAP Implementation
**Session VWAP:**
Calculates volume-weighted average price that resets at each session boundary using TradingView's native `ta.vwap()` function.
**Daily VWAP:**
Custom implementation that resets every calendar day:
CumulativePV = Σ(Price × Volume)
CumulativeV = Σ(Volume)
Daily VWAP = CumulativePV / CumulativeV
Source price options: HLC3, Close, OHLC4, HL2
---
### Premium/Discount Zones
**Range Calculation:**
Based on selected mode (Trailing Swings, Daily/Weekly/Monthly Range):
- High 100% = Swing high or HTF high
- Low 0% = Swing low or HTF low
- Range = High - Low
**Zone Division:**
*3 Zones Simple Mode:*
- Premium: 66.67% - 100%
- Equilibrium: 33.33% - 66.67%
- Discount: 0% - 33.33%
*5 Zones Fibonacci Mode:*
- Strong Premium: 78.6% - 100%
- Premium: 61.8% - 78.6% (OTE Zone)
- Equilibrium: 38.2% - 61.8%
- Discount: 23.6% - 38.2%
- Strong Discount: 0% - 23.6%
**Purpose:**
Provides institutional context: institutions typically buy in Discount zones and sell in Premium zones.
---
### Fibonacci Retracement
**Auto-Calculation:**
- Scans the last N periods (default 80, range 20-200) to identify swing high and swing low
- Projects key Fibonacci levels: 0%, 23.6%, 38.2%, 50%, 61.8%, 78.6%, 100%
- Optional inversion for downtrends
- Future projection extends levels forward by adjustable bars (default 50)
**OTE Zone Highlighting:**
Creates a visual box for the 61.8%-78.6% zone, which represents the Optimal Trade Entry area commonly used in ICT methodology.
---
### Ichimoku Cloud (Multi-Timeframe)
**Components Calculation:**
Tenkan-sen = (9-period high + 9-period low) / 2
Kijun-sen = (26-period high + 26-period low) / 2
Senkou Span A = (Tenkan + Kijun) / 2
Senkou Span B = (52-period high + 52-period low) / 2
Chikou Span = Close shifted back 26 periods
**MTF Implementation:**
Uses `request.security()` to fetch higher timeframe data when custom timeframe is specified. Falls back to chart timeframe if empty.
**Cloud Filtering:**
- Price above cloud = Bullish bias filter
- Price below cloud = Bearish bias filter
- Price in cloud = Neutral/avoid
---
### Market Structure Detection
**BOS (Break of Structure):**
Occurs when price breaks the last swing high (in uptrend) or swing low (in downtrend), confirming trend continuation.
**MSS (Market Structure Shift):**
Detected when BOS occurs in the opposite direction of current trend, indicating potential reversal.
**CHoCH (Change of Character):**
Early warning signal when price touches but doesn't strongly break the previous swing, suggesting momentum loss.
---
### Previous Day Levels
**Calculation:**
Uses `request.security()` with daily timeframe and ` ` offset with lookahead on:
- PDH: Previous Day High
- PDL: Previous Day Low
- PDM: (PDH + PDL) / 2
**Daily Bias Logic:**
- Bullish: Close > PDM or breakout above PDH
- Bearish: Close < PDM or breakdown below PDL
- Neutral: Close at PDM
---
## Why This Combination?
This indicator integrates multiple institutional concepts to create a **confluence-based filtering system** that answers three critical trading questions:
1. **WHERE to trade?** (Order Blocks, FVG, Premium/Discount zones, Fibonacci OTE)
2. **WHEN to trade?** (EMA Flips, Market Structure breaks, Ichimoku confirmation)
3. **WHICH direction?** (HTF Bias, Daily Bias, Cloud momentum, Structure trend)
### Synergy Between Components:
- **OB + FVG Confluence**: When an Order Block overlaps with a Fair Value Gap, it creates a high-probability institutional zone
- **Premium/Discount Context**: Filters OB signals to match institutional bias (buy Discount, sell Premium)
- **EMA Flips + Structure**: Fast momentum signals (flips) confirmed by slower structure breaks reduce false entries
- **Ichimoku Cloud**: Acts as additional trend filter, preventing counter-cloud trades
- **VWAP + Fibonacci**: Provides dynamic and static mean reversion levels for risk management
**Individual indicators might generate conflicting signals**, but this mashup requires multiple confirmations before highlighting setups, significantly reducing noise and improving trade quality.
---
## How to Use
### Setup Configuration
1. **Enable desired components** in settings (Essentials group)
2. **Adjust swing lengths** based on timeframe:
- M1-M5: Swing 5-7, Internal 3
- M15-H1: Swing 10, Internal 5 (default)
- H4-D1: Swing 15-20, Internal 7-10
3. **Configure filters**:
- Lower timeframes: Use ATR filter 0.3-0.5x
- Higher timeframes: Use CMR filter or 0.7-1.0x ATR
### Trading Workflow
**Step 1: Identify Trend**
- Check EMA Cloud colors (green = bullish, red = bearish)
- Confirm with Ichimoku Cloud position
- Verify Market Structure (BOS direction)
**Step 2: Find Confluence Zones**
- Locate active Order Blocks in trend direction
- Check for FVG overlap with OB
- Ensure zone is in correct Premium/Discount area
**Step 3: Wait for Entry Trigger**
- Monitor EMA 5/12 flips within confluence zone
- Check Fibonacci OTE zone if displayed
- Confirm VWAP position supports direction
**Step 4: Execute & Manage**
- Enter on flip signal within OB/FVG confluence
- Stop loss: Outside Order Block zone
- Target: Opposite Premium/Discount zone or next OB
---
## Dashboard Information
The on-chart table displays real-time market conditions:
- **Trend**: Current structure (Bullish/Bearish/Neutral)
- **HTF Bias**: Higher timeframe direction
- **OB**: Active Order Block status (Bull ↑ / Bear ↓ / None)
- **FVG**: Active Fair Value Gap (Bull ↑ / Bear ↓ / None)
- **OB+FVG**: Confluence confirmation (✓ when both align)
- **P/D Zone**: Current price position in Premium/Discount
- **Fib 61.8-78.6**: OTE zone status (In Zone / Outside)
- **Daily Bias**: ICT daily bias (Bullish/Bearish/Neutral)
- **Market Status**: Overall condition summary
- **RSI(14)**: Momentum (Oversold <30 / Neutral / Overbought >70)
- **Ichimoku**: Cloud position (Above/In/Below)
---
## Alert Conditions
Complete alert system for key events:
- BOS Bullish / Bearish detected
- New Order Block formed (Bullish/Bearish)
- New Internal OB formed
- EMA Flip signals (Up/Down)
- Price entering OTE zone (when HTF aligned)
---
## Best Practices
✅ **Use on multiple timeframes**: Align HTF bias with entry TF signals
✅ **Wait for confluence**: At least 2-3 confirmations before entry
✅ **Respect Premium/Discount**: Don't buy Premium or sell Discount
✅ **Adjust swing lengths**: Match to your trading timeframe
✅ **Backtest first**: Understand signal behavior before live trading
❌ **Don't overtrade**: Not every OB or FVG is a valid setup
❌ **Don't ignore filters**: Disabled filters increase false signals
❌ **Don't trade against cloud**: Ichimoku filter prevents low-probability trades
---
## Technical Specifications
- Pine Script™ Version: 6
- Overlay: Yes
- Max Boxes: 500
- Max Lines: 500
- Max Labels: 300
- Repainting: Signals confirmed on bar close (barstate.isconfirmed)
---
## Recommended Timeframes
- **Scalping**: M1, M5 (reduce swing lengths to 5-7)
- **Day Trading**: M15, M30, H1 (default settings)
- **Swing Trading**: H4, D1 (increase swing lengths to 15-20)
---
## Performance Notes
For optimal chart performance:
- Disable unused features (Structure, EQH/EQL if not needed)
- Reduce lookback periods on lower timeframes
- Limit to 1-2 active alerts per instrument
---
This indicator does not predict the future and should be used as part of a complete trading plan with proper risk management.
© 2025-2026

Plutus Flow - Statistical OBV AnalysisPlutus Flow - Statistical OBV Analysis
Plutus Flow transforms raw On-Balance Volume (OBV) into a filtered, statistically-bounded oscillator with automatic divergence detection. The indicator is designed to help traders analyze cumulative buying and selling pressure through three integrated analytical layers: spike-clipped volume accumulation, standard deviation banding, and pivot-synchronized divergence detection.
━━━━━━━━━━━━━━━━━━━━━━━━━━━━━━━━━━━━━━━
🔶 𝗢𝗩𝗘𝗥𝗩𝗜𝗘𝗪
On-Balance Volume (OBV) is a classic momentum indicator that tracks cumulative volume flow. When price closes higher, the bar's volume is added to OBV; when price closes lower, volume is subtracted. The resulting cumulative line can help identify whether volume is flowing into or out of an asset.
Plutus Flow builds on this foundation by adding three analytical layers:
• 𝗦𝗽𝗶𝗸𝗲-𝗖𝗹𝗶𝗽𝗽𝗲𝗱 𝗩𝗼𝗹𝘂𝗺𝗲: Caps extreme volume bars to preserve trend continuity
• 𝗦𝘁𝗮𝘁𝗶𝘀𝘁𝗶𝗰𝗮𝗹 𝗕𝗮𝗻𝗱𝘀: Defines mathematically-derived extreme zones
• 𝗗𝗶𝘃𝗲𝗿𝗴𝗲𝗻𝗰𝗲 𝗗𝗲𝘁𝗲𝗰𝘁𝗶𝗼𝗻: Identifies structural disagreements between price and OBV
Each layer serves a specific analytical purpose, and together they provide a structured framework for interpreting volume-based pressure.
════════════════════════════════════════
The indicator displays filtered OBV (colored line), basis line (orange), statistical bands (green), and the flow ribbon between OBV and basis.
━━━━━━━━━━━━━━━━━━━━━━━━━━━━━━━━━━━━━━━━━
🔶 𝗛𝗢𝗪 𝗜𝗧 𝗪𝗢𝗥𝗞𝗦
The indicator is built around one core principle: cumulative buying and selling pressure may reveal accumulation or distribution patterns before price confirms them. Rather than displaying raw OBV, Plutus Flow processes it through three analytical layers.
𝗦𝗽𝗶𝗸𝗲-𝗖𝗹𝗶𝗽𝗽𝗲𝗱 𝗢𝗕𝗩
𝘞𝘩𝘢𝘵 𝘪𝘵 𝘥𝘰𝘦𝘴: Standard OBV accumulates every tick of volume equally, meaning one earnings candle or news event can permanently distort the cumulative total. This implementation dynamically caps each bar's volume contribution using a rolling average multiplier, preserving the underlying trend signal while filtering anomalous spikes.
𝘏𝘰𝘸 𝘵𝘰 𝘪𝘯𝘵𝘦𝘳𝘱𝘳𝘦𝘵 𝘪𝘵: The filtered OBV line represents the cumulative pressure trend without distortion from outlier events. When this line is rising, it may suggest net buying pressure over time. When falling, it may suggest net selling pressure. The filtering helps maintain visual continuity across volatile events like earnings releases or major news announcements.
𝗦𝘁𝗮𝘁𝗶𝘀𝘁𝗶𝗰𝗮𝗹 𝗕𝗮𝗻𝗱𝘀
𝘞𝘩𝘢𝘵 𝘪𝘵 𝘥𝘰𝘦𝘴: A smoothed moving average serves as the basis line, with standard deviation bands defining statistically extreme zones above and below. The bands adapt to each symbol's recent volatility profile.
𝘏𝘰𝘸 𝘵𝘰 𝘪𝘯𝘵𝘦𝘳𝘱𝘳𝘦𝘵 𝘪𝘵: When OBV reaches the upper band, cumulative buying pressure has moved beyond its recent normal range: this may indicate an extended condition. Similarly, when OBV reaches the lower band, selling pressure may be statistically extended. These zones are not automatic reversal signals, but rather areas that may warrant closer attention. Extended conditions can persist during strong trends.
𝗙𝗹𝗼𝘄 𝗥𝗶𝗯𝗯𝗼𝗻
𝘞𝘩𝘢𝘵 𝘪𝘵 𝘥𝘰𝘦𝘴: The area between OBV and its basis line is filled to create a visual ribbon. Color indicates whether OBV is above or below its average, and color intensity shifts based on momentum direction.
𝘏𝘰𝘸 𝘵𝘰 𝘪𝘯𝘵𝘦𝘳𝘱𝘳𝘦𝘵 𝘪𝘵: Green ribbon indicates OBV above basis (buying pressure may be dominant). Red ribbon indicates OBV below basis (selling pressure may be dominant). The ribbon provides quick visual context for the current pressure regime without requiring precise reading of the oscillator value.
𝗗𝗶𝘃𝗲𝗿𝗴𝗲𝗻𝗰𝗲 𝗗𝗲𝘁𝗲𝗰𝘁𝗶𝗼𝗻
𝘞𝘩𝘢𝘵 𝘪𝘵 𝘥𝘰𝘦𝘴: The script automatically identifies pivot highs and lows on both price and OBV. When price structure disagrees with OBV structure: for example, price makes a lower low while OBV makes a higher low: divergence is detected. Labels appear only when pivots are confirmed and synchronized within a tolerance window.
𝘏𝘰𝘸 𝘵𝘰 𝘪𝘯𝘵𝘦𝘳𝘱𝘳𝘦𝘵 𝘪𝘵: Divergences may indicate structural disagreement between price action and underlying volume pressure. A bullish divergence (price lower low, OBV higher low) could suggest that selling pressure is weakening despite lower prices. A bearish divergence (price higher high, OBV lower high) could suggest that buying pressure is weakening despite higher prices. Divergences are not guaranteed reversal signals: they indicate a structural condition that traders may want to investigate further.
═══════════════════════════════════════
Example: A bullish divergence where price made a lower low while OBV made a higher low, suggesting selling pressure may be weakening.
━━━━━━━━━━━━━━━━━━━━━━━━━━━━━━━━━━━━━━━
🔶 𝗪𝗛𝗬 𝗧𝗛𝗘𝗦𝗘 𝗖𝗢𝗠𝗣𝗢𝗡𝗘𝗡𝗧𝗦 𝗪𝗢𝗥𝗞 𝗧𝗢𝗚𝗘𝗧𝗛𝗘𝗥
Price movements don't always reflect underlying volume activity. A price rally on declining volume may have different implications than a rally on increasing volume. Plutus Flow approaches this by layering three types of analysis that each address a different aspect of volume interpretation:
1. 𝗙𝗶𝗹𝘁𝗲𝗿𝗲𝗱 𝗣𝗿𝗲𝘀𝘀𝘂𝗿𝗲: Spike clipping ensures the OBV line represents consistent accumulation/distribution patterns rather than noise from outlier events. This creates a cleaner baseline for all subsequent analysis.
2. 𝗦𝘁𝗮𝘁𝗶𝘀𝘁𝗶𝗰𝗮𝗹 𝗖𝗼𝗻𝘁𝗲𝘅𝘁: Deviation bands provide mathematically-defined reference zones instead of arbitrary horizontal lines. This helps contextualize whether current pressure readings are within normal ranges or statistically extended.
3. 𝗦𝘁𝗿𝘂𝗰𝘁𝘂𝗿𝗮𝗹 𝗖𝗼𝗻𝗳𝗶𝗿𝗺𝗮𝘁𝗶𝗼𝗻: Divergence detection surfaces disagreements between price and pressure that traders may want to investigate. This adds a structural dimension beyond simple trend-following.
When multiple factors align: for example, OBV exiting an extreme band while showing divergence from price: this represents statistical extension plus structural disagreement occurring simultaneously. Such conditions may warrant additional analysis, though they do not guarantee any particular outcome.
━━━━━━━━━━━━━━━━━━━━━━━━━━━━━━━━━━━━━━━
🔶 𝗛𝗢𝗪 𝗧𝗢 𝗨𝗦𝗘
This section provides step-by-step guidance for interpreting the indicator's visual elements and incorporating them into chart analysis.
𝗦𝘁𝗲𝗽 𝟭: 𝗜𝗱𝗲𝗻𝘁𝗶𝗳𝘆 𝘁𝗵𝗲 𝗣𝗿𝗲𝘀𝘀𝘂𝗿𝗲 𝗥𝗲𝗴𝗶𝗺𝗲
Begin by observing the flow ribbon color:
• Green ribbon = OBV is above its basis line, which may indicate buying pressure is currently dominant
• Red ribbon = OBV is below its basis line, which may indicate selling pressure is currently dominant
This provides immediate context for the current pressure environment. A sustained green ribbon during a price uptrend may suggest the trend has volume support. A green ribbon turning red during an uptrend could indicate a potential shift in underlying pressure.
𝗦𝘁𝗲𝗽 𝟮: 𝗠𝗼𝗻𝗶𝘁𝗼𝗿 𝗕𝗮𝘀𝗶𝘀 𝗟𝗶𝗻𝗲 𝗖𝗿𝗼𝘀𝘀𝗲𝘀
Watch for the signal dots that appear when OBV crosses its basis line:
• Green dot = OBV crossed above basis (potential shift toward buying pressure)
• Red dot = OBV crossed below basis (potential shift toward selling pressure)
These crosses mark momentum shifts in the pressure regime. A green dot appearing after an extended red ribbon period could indicate early signs of pressure reversal. However, crosses can also occur during choppy conditions without leading to sustained moves.
𝗦𝘁𝗲𝗽 𝟯: 𝗔𝘀𝘀𝗲𝘀𝘀 𝗦𝘁𝗮𝘁𝗶𝘀𝘁𝗶𝗰𝗮𝗹 𝗘𝘅𝘁𝗿𝗲𝗺𝗲𝘀
Monitor the position of OBV relative to the deviation bands:
• White dot = OBV has entered an extreme zone (upper or lower band)
• Yellow dot = OBV has exited an extreme zone
When OBV reaches the upper band, cumulative buying pressure has moved beyond its recent statistical norm. This does not mean price must reverse: strong trends can maintain extended readings for prolonged periods. However, it does indicate that pressure is stretched relative to recent history.
Similarly, when OBV reaches the lower band, selling pressure is statistically extended. An exit from this zone (yellow dot) could indicate that selling pressure may be stabilizing.
═══════════════════════════════════════
Strong trend example: OBV remains elevated with sustained ribbon color and no divergence: indicating the trend may still have volume support.
𝗦𝘁𝗲𝗽 𝟰: 𝗖𝗵𝗲𝗰𝗸 𝗳𝗼𝗿 𝗗𝗶𝘃𝗲𝗿𝗴𝗲𝗻𝗰𝗲𝘀
Review divergence labels when they appear:
• "Bull Div" label = Price made a lower low while OBV made a higher low (regular bullish divergence)
• "Bear Div" label = Price made a higher high while OBV made a lower high (regular bearish divergence)
• "Bull Hid" label = Price made a higher low while OBV made a lower low (hidden bullish divergence)
• "Bear Hid" label = Price made a lower high while OBV made a higher high (hidden bearish divergence)
Regular divergences may indicate weakening momentum in the current trend direction. Hidden divergences may indicate continuation potential within the existing trend. Neither type guarantees any particular outcome: they represent structural conditions for further analysis.
𝗦𝘁𝗲𝗽 𝟱: 𝗖𝗼𝗺𝗯𝗶𝗻𝗲 𝗠𝘂𝗹𝘁𝗶𝗽𝗹𝗲 𝗙𝗮𝗰𝘁𝗼𝗿𝘀
The indicator provides the most context when multiple elements align:
𝘌𝘹𝘢𝘮𝘱𝘭𝘦 𝘚𝘤𝘦𝘯𝘢𝘳𝘪𝘰 𝘈: 𝘛𝘳𝘦𝘯𝘥 𝘊𝘰𝘯𝘵𝘪𝘯𝘶𝘢𝘵𝘪𝘰𝘯
OBV at the upper band, ribbon solid green, no divergence labels present. Price rising, volume confirming, no structural disagreement. OBV can stay extended during strong trends. The absence of divergence suggests the trend may still have volume support.
𝘌𝘹𝘢𝘮𝘱𝘭𝘦 𝘚𝘤𝘦𝘯𝘢𝘳𝘪𝘰 𝘉: 𝘔𝘰𝘮𝘦𝘯𝘵𝘶𝘮 𝘍𝘢𝘥𝘪𝘯𝘨
OBV shows bullish with green ribbon, but the line has flattened near the basis. Price still rising, but volume is no longer confirming. Ribbon width narrowing. This type of disconnect between price action and volume momentum often appears before moves stall.
𝘌𝘹𝘢𝘮𝘱𝘭𝘦 𝘚𝘤𝘦𝘯𝘢𝘳𝘪𝘰 𝘊: 𝘌𝘹𝘩𝘢𝘶𝘴𝘵𝘪𝘰𝘯 𝘞𝘢𝘳𝘯𝘪𝘯𝘨
Price making higher highs while OBV makes lower highs. A "Bear Div" label appears with OBV still in the upper extreme zone. Yellow dot signals exit from extreme. Multiple warning signs appearing together (divergence, extreme zone exit, weakening internals) suggest caution.
𝘌𝘹𝘢𝘮𝘱𝘭𝘦 𝘚𝘤𝘦𝘯𝘢𝘳𝘪𝘰 𝘋: 𝘉𝘳𝘦𝘢𝘬𝘰𝘶𝘵 𝘍𝘳𝘰𝘮 𝘊𝘰𝘯𝘴𝘰𝘭𝘪𝘥𝘢𝘵𝘪𝘰𝘯
OBV has been flat for several days, ribbon alternating red and green, no clear direction. Then OBV breaks above its recent range, ribbon turns solid green, green cross dot appears. When multiple elements shift together after a quiet period, consolidation may be resolving into a directional move.
═══════════════════════════════════════
Multiple factors aligning: OBV exiting extreme zone while divergence appears and ribbon shifts color: a confluence condition that may warrant closer attention.
𝗦𝘁𝗲𝗽 𝟲: 𝗖𝗼𝗻𝗳𝗶𝗴𝘂𝗿𝗲 𝗔𝗹𝗲𝗿𝘁𝘀
Ten built-in alert conditions are available to notify you of specific events:
• Basis line crosses (up/down)
• Extreme zone entries (upper/lower)
• Extreme zone exits (upper/lower)
• Divergence detection (all four types)
Alerts can be set through TradingView's alert dialog after adding the indicator to your chart.
━━━━━━━━━━━━━━━━━━━━━━━━━━━━━━━━━━━━━━━
🔶 𝗡𝗔𝗩𝗜𝗚𝗔𝗧𝗜𝗡𝗚 𝗗𝗜𝗙𝗙𝗘𝗥𝗘𝗡𝗧 𝗠𝗔𝗥𝗞𝗘𝗧 𝗖𝗢𝗡𝗗𝗜𝗧𝗜𝗢𝗡𝗦
𝗧𝗿𝗲𝗻𝗱𝗶𝗻𝗴 𝗠𝗮𝗿𝗸𝗲𝘁𝘀
During strong trends, OBV may remain in extreme zones for extended periods. This is normal behavior: statistical extremes are not automatic reversal signals. In trending conditions, traders may focus more on:
• Whether divergences are forming (potential trend weakening)
• Ribbon color persistence (trend confirmation)
• Basis line crosses as potential re-entry points during pullbacks
For example, in a sustained uptrend, OBV might stay above the upper band for days or weeks. Rather than treating this as an immediate reversal signal, traders may watch for divergence to form as a potential early warning that the trend could be losing momentum. A bearish divergence appearing while OBV is in the upper extreme could be more significant than either condition alone.
𝗥𝗮𝗻𝗴𝗶𝗻𝗴 𝗠𝗮𝗿𝗸𝗲𝘁𝘀
In sideways conditions, OBV may oscillate between bands more frequently. Traders may focus on:
• Extreme zone exits as potential mean-reversion conditions
• Divergences that form at range boundaries
• Ribbon color flips that may indicate short-term pressure shifts
In ranging environments, the statistical bands may provide clearer reference points. When OBV touches the lower band and then exits (yellow dot) near range support, this could suggest selling pressure is stabilizing. Conversely, when OBV touches the upper band near range resistance and divergence forms, this could indicate buying pressure is weakening at that level.
𝗛𝗶𝗴𝗵 𝗩𝗼𝗹𝗮𝘁𝗶𝗹𝗶𝘁𝘆 𝗘𝘃𝗲𝗻𝘁𝘀
During earnings, news events, or market shocks, the spike-clipping feature helps maintain OBV continuity. However, sustained high-volume regimes may still push readings to extremes. The HTF filter option can help provide broader context during volatile periods.
For volatile events, traders may want to observe how OBV behaves after the initial spike. If OBV quickly returns toward its basis after a news-driven extreme, this could suggest the move lacked follow-through volume. If OBV maintains its new level or continues in the same direction, this could suggest the move has genuine volume support.
𝗠𝘂𝗹𝘁𝗶-𝗧𝗶𝗺𝗲𝗳𝗿𝗮𝗺𝗲 𝗖𝗼𝗻𝘀𝗶𝗱𝗲𝗿𝗮𝘁𝗶𝗼𝗻𝘀
The optional HTF filter allows traders to align lower timeframe analysis with higher timeframe pressure direction. When the HTF filter shows bullish pressure, traders may give more weight to bullish signals on lower timeframes. When HTF and LTF pressure align, this could suggest stronger directional conviction, though no outcome is guaranteed.
━━━━━━━━━━━━━━━━━━━━━━━━━━━━━━━━━━━━━━━
🔶 𝗧𝗘𝗖𝗛𝗡𝗜𝗖𝗔𝗟 𝗗𝗘𝗧𝗔𝗜𝗟𝗦
• Volume capping uses RMA-based averaging with a multiplier threshold
• Statistical bands use SMA for basis with standard deviation for band width
• Pivot detection uses left/right bar confirmation before registering swing points
• Divergence requires both price pivot and OBV pivot to occur within a tolerance window
• All signals fire on bar close only (non-repainting)
• HTF data retrieved using request.security() with lookahead disabled
━━━━━━━━━━━━━━━━━━━━━━━━━━━━━━━━━━━━━━━
🔶 𝗨𝗡𝗜𝗤𝗨𝗘 𝗙𝗘𝗔𝗧𝗨𝗥𝗘𝗦
• 𝗔𝗱𝗮𝗽𝘁𝗶𝘃𝗲 𝗩𝗼𝗹𝘂𝗺𝗲 𝗙𝗶𝗹𝘁𝗲𝗿𝗶𝗻𝗴: Volume cap adjusts dynamically to each symbol's activity profile, not a fixed threshold.
• 𝗦𝘆𝗻𝗰𝗵𝗿𝗼𝗻𝗶𝘇𝗲𝗱 𝗗𝗶𝘃𝗲𝗿𝗴𝗲𝗻𝗰𝗲: Requires pivot alignment between price and OBV within tolerance window, helping filter timing mismatches.
• 𝗙𝗼𝘂𝗿 𝗗𝗶𝘃𝗲𝗿𝗴𝗲𝗻𝗰𝗲 𝗧𝘆𝗽𝗲𝘀: Detects Regular Bullish, Regular Bearish, Hidden Bullish, and Hidden Bearish patterns.
• 𝗘𝘅𝘁𝗿𝗲𝗺𝗲 𝗭𝗼𝗻𝗲 𝗘𝘃𝗲𝗻𝘁𝘀: Separate signals for entering extreme zones versus exiting them.
• 𝗛𝗧𝗙 𝗔𝗹𝗶𝗴𝗻𝗺𝗲𝗻𝘁: Optional higher timeframe filter for directional context.
• 𝗡𝗼𝗻-𝗥𝗲𝗽𝗮𝗶𝗻𝘁𝗶𝗻𝗴: All calculations use confirmed bar data only. Historical display matches live behavior.
━━━━━━━━━━━━━━━━━━━━━━━━━━━━━━━━━━━━━━━
🔶 𝗦𝗘𝗧𝗧𝗜𝗡𝗚𝗦 𝗢𝗩𝗘𝗥𝗩𝗜𝗘𝗪
• 𝗖𝗮𝗹𝗰𝘂𝗹𝗮𝘁𝗶𝗼𝗻: HTF timeframe for OBV calculation
• 𝗤𝘂𝗮𝗹𝗶𝘁𝘆: FlipGuard cooldown, cross gating, Z-score filtering, sequence requirements
• 𝗔𝘀𝘀𝗶𝘀𝘁𝘀: HTF alignment filter for directional context
• 𝗗𝗶𝘃𝗲𝗿𝗴𝗲𝗻𝗰𝗲: Minimum price swing filter (ATR-based) to control divergence sensitivity
• 𝗩𝗶𝘀𝘂𝗮𝗹𝘀: Toggle divergence labels, extreme zone exit markers, and ribbon display
━━━━━━━━━━━━━━━━━━━━━━━━━━━━━━━━━━━━━━━
🔶 𝗔𝗟𝗘𝗥𝗧𝗦
10 conditions available:
• Cross Up / Cross Down: Basis line crosses
• Breach Upper / Breach Lower: Extreme zone entries
• Exit Upper / Exit Lower: Extreme zone exits
• Bullish Divergence / Bearish Divergence: Regular divergence
• Hidden Bullish / Hidden Bearish: Continuation divergence
━━━━━━━━━━━━━━━━━━━━━━━━━━━━━━━━━━━━━━━
🔶 𝗟𝗜𝗠𝗜𝗧𝗔𝗧𝗜𝗢𝗡𝗦
• 𝗥𝗲𝗾𝘂𝗶𝗿𝗲𝘀 𝘃𝗼𝗹𝘂𝗺𝗲 𝗱𝗮𝘁𝗮: Does not function on forex spot pairs or instruments without real volume data. The indicator requires actual volume to calculate OBV.
• 𝗔𝗻𝗮𝗹𝘆𝘀𝗶𝘀 𝘁𝗼𝗼𝗹, 𝗻𝗼𝘁 𝗮 𝘀𝗶𝗴𝗻𝗮𝗹 𝗴𝗲𝗻𝗲𝗿𝗮𝘁𝗼𝗿: This indicator shows where pressure exists and identifies structural conditions. It does not tell you when to trade. All trading decisions should incorporate additional analysis and risk management.
• 𝗗𝗶𝘃𝗲𝗿𝗴𝗲𝗻𝗰𝗲𝘀 𝗮𝗿𝗲 𝗻𝗼𝘁 𝗴𝘂𝗮𝗿𝗮𝗻𝘁𝗲𝗲𝗱 𝗿𝗲𝘃𝗲𝗿𝘀𝗮𝗹𝘀: Divergences indicate structural disagreement between price and volume. They can persist, fail, or resolve without the expected outcome. They should not be followed blindly.
• 𝗘𝘅𝘁𝗿𝗲𝗺𝗲𝘀 𝗰𝗮𝗻 𝗽𝗲𝗿𝘀𝗶𝘀𝘁: During strong trends, OBV can remain in extreme zones for extended periods. Statistical extension does not guarantee mean reversion.
• 𝗗𝗮𝘁𝗮 𝗾𝘂𝗮𝗹𝗶𝘁𝘆 𝗱𝗲𝗽𝗲𝗻𝗱𝗲𝗻𝗰𝘆: Effectiveness depends on market liquidity and volume data quality. Thinly traded instruments may produce less reliable readings.
• 𝗟𝗮𝗴𝗴𝗶𝗻𝗴 𝗶𝗻𝗱𝗶𝗰𝗮𝘁𝗼𝗿: Like all volume-based indicators, signals are derived from historical data. By the time a divergence is confirmed, some of the move may have already occurred.
━━━━━━━━━━━━━━━━━━━━━━━━━━━━━━━━━━━━━━━
🔶 𝗖𝗢𝗡𝗖𝗟𝗨𝗦𝗜𝗢𝗡
Plutus Flow provides a structured framework for analyzing On-Balance Volume through filtered accumulation, statistical banding, and divergence detection. The indicator is designed to help traders interpret volume-based pressure and identify structural conditions that may warrant further analysis.
━━━━━━━━━━━━━━━━━━━━━━━━━━━━━━━━━━━━━━━
🔶 𝗗𝗜𝗦𝗖𝗟𝗔𝗜𝗠𝗘𝗥
Trading is risky and most traders lose money. This indicator is provided for informational and educational purposes only. It does not constitute financial advice, and past performance does not guarantee future results. All content, tools, and analysis should not be considered as recommendations to buy or sell any asset. Users are solely responsible for their own trading decisions. Always use proper risk management and consider consulting a qualified financial advisor before making trading decisions.
━━━━━━━━━━━━━━━━━━━━━━━━━━━━━━━━━━━━━━━
Built with PineScript v6. Non-repainting. All signals confirmed on bar close.

GCM Kinetic Flux SpectrumTitle: GCM Kinetic Flux Spectrum
DESCRIPTION
The GCM Kinetic Flux Spectrum is an institutional-grade hybrid momentum and volume engine. Unlike standard oscillators that rely on closing prices, the GCM KFS synthesizes dual-source RSI volatility with Volume Flow Intensity (VFI) to reveal the hidden kinetic energy of market movements.
By projecting a 27-layer "Spectrum Ribbon" and a multi-dimensional Divergence Engine, the GCM KFS identifies not just where the price is heading, but the quality and "fuel" behind the trend.
CORE ARCHITECTURE
1) The Kinetic Mean (Dual-Source RSI)
Standard RSI often ignores the battle occurring at the wicks. The GCM KFS calculates independent RSI streams for Highs and Lows, then anchors them to a Zero-Centered baseline (-50 to +50). The resulting Kinetic Mean filters out retail noise, providing a volatility-adjusted perspective on momentum.
2) Volume Flux Integration (VFI)
Volume precedes price. The GCM KFS integrates a highly responsive, EMA-smoothed Volume Flow Indicator (VFI). By syncing VFI length with the RSI cycle, the indicator cross-verifies price strength with capital flow.
• Momentum + Positive Flux: Confirms high-conviction trends.
• Momentum + Negative Flux: Reveals "Empty" breakouts or institutional distribution.
3) 27-Layer Spectrum Ribbon
The gradient fill isn't just aesthetic—it represents Volatility Density.
• Expansion: When ribbons fan out, it signals a high-velocity trend.
• Compression (The Squeeze): When ribbons pinch toward the Kinetic Mean, it signals a volatility contraction, typically the precursor to an explosive breakout.
4) Four-Way Divergence Engine
The KFS automatically detects and projects four types of divergence on both the indicator pane and the main price chart:
• Regular Bullish/Bearish: Identifying high-probability trend reversals.
• Hidden Bullish/Bearish: Identifying trend continuation (Smart Money re-entry points).
KEY POWER FEATURES
• Zero-Centered Logic: Levels are shifted for better visual balance. (OB: +20, Extreme OB: +30 | OS: -20, Extreme OS: -30).
• Dynamic Zones: Subtle background fills highlight "Extreme" areas where price is statistically likely to mean-revert.
• Main Chart Projection: Use the force_overlay feature to keep your eyes on price action while the indicator confirms entries.
• Institutional Dotted VFI: The orange dotted line acts as the "Anchor"—if price rises but the VFI Anchor stays below zero, the move lacks professional backing.
HOW TO TRADE WITH GCM-KFS
• The Reversal Sniper: Look for an R-BULL or R-BEAR label appearing inside the Extreme Zone (±30). This indicates momentum exhaustion backed by a volume shift.
• Trend Riding: During an uptrend, look for H-BULL (Hidden Bullish) labels. This signals that institutions are "buying the dip" while momentum resets.
• Volatility Breakouts: When the Spectrum Ribbon enters a tight "squeeze" near the Zero Line, prepare for a major move. Follow the direction of the first ribbon expansion.
RECOMMENDED SETTINGS
• Scalping (1m - 5m): Length 7 - 9
• Day Trading (15m - 1H): Length 10 - 14
• Swing Trading (4H - Daily): Length 20+
AUTHOR’S NOTE
This script is part of the GCM suite of professional tools. It is designed to be a "confluence engine"—it works best when used to confirm price action levels, supply/demand zones, or order blocks. Always trade with a plan and managed risk.

Multi-Timeframe Inside Bar Breakout (4-Symbol Simultaneous)Multi-Timeframe Inside Bar Breakout (4-Symbol Simultaneous)
Overview
Monitors 4 symbols across 4 timeframes simultaneously, displaying labeled alerts when all 4 symbols break out from inside bar compression on any tracked timeframe. See 15-minute, 30-minute, 60-minute, and daily breakouts all on one chart — complete multi-timeframe compression analysis.
When all 4 symbols compress into inside bars and then ALL break the same direction, you get clear directional confirmation across different timeframes. Perfect for Rob Smith's "The Strat" methodology and traders who use multi-timeframe analysis for entry confirmation.
🎯 Why This Matters
Multi-timeframe breakout confluence = stronger signals.
When SPY, QQQ, IWM, and DIA simultaneously:
✅ Compress into inside bars (bar )
✅ ALL break same direction (bar )
✅ Across multiple timeframes
You get layered confirmation — not just one timeframe saying "go," but multiple timeframes agreeing on direction.
Example: 15m breakout + 60m breakout + Daily breakout = alignment across timeframes.
✅ Key Features
✅ 4 Timeframes Tracked — Monitor 15m, 30m, 60m, Daily (fully customizable)
✅ 4 Symbols Per Timeframe — All must break together for signal
✅ Staggered Labels — Each timeframe displays at different distance (no overlap)
✅ Adaptive Positioning — Works on futures, stocks, forex, crypto
✅ Customizable Colors — Bullish/bearish colors with opacity control
✅ Alert-Ready — 8 alert conditions (bull/bear per timeframe)
✅ Works on Any Chart — See higher timeframe signals on lower timeframe charts
📊 How It Works
Inside Bar Check (Bar ):
All 4 symbols had inside bars (high < prior high AND low > prior low)
Breakout Check (Bar ):
Bullish: All 4 close > prior high
Bearish: All 4 close < prior low
Label Display:
📈IBSB 15 = Bullish breakout on 15-minute timeframe
📉IBSB D = Bearish breakout on daily timeframe
Each timeframe operates independently — you might see multiple timeframe labels on the same bar when breakouts align.
⚙️ Settings Guide
Symbols (Default: SPY, QQQ, IWM, DIA)
Customize to any 4 symbols
Popular: ES/NQ/YM/RTY (futures), XLF/XLK/XLE/XLV (sectors)
Timeframes (Default: 15, 30, 60, D)
Set any 4 timeframes to monitor
Examples: 5/15/60/240 (intraday stack), 60/D/W/M (swing stack)
Display Options:
Bullish/Bearish colors + opacity control
Label distance (% of bar range)
Stagger spacing (prevents overlap)
Max labels per timeframe (default: 25)
Debug Mode:
Shows which symbols are inside/breaking per timeframe
Useful for troubleshooting
🔔 Setting Up Alerts
Create alerts for any combination:
"IBSB Bull - TF1" (first timeframe bullish)
"IBSB Bear - TF4" (fourth timeframe bearish)
Set to "Once Per Bar Close" for confirmed signals
💡 Example Trading Approach
Note: Educational example, not trading advice.
Watch for compression across symbols on higher timeframes
IBSB label appears → all 4 broke same direction
Multiple timeframe labels = stronger confluence
Enter with your strategy using proper risk management
Example: Daily IBSB bullish + 60m IBSB bullish = aligned timeframes for potential long entry.
🎯 Why Multi-Timeframe Matters
Single timeframe breakout = one piece of data.
Multi-timeframe breakout = confirmation across time horizons.
When 15m, 60m, and Daily all show simultaneous 4-symbol breakouts → market structure aligning across timeframes.
🔧 Technical Details
✅ PineScript v6 (latest)
✅ Adaptive label positioning (scales with price)
✅ Smart staggering (prevents label overlap)
✅ Label management (max 500 total across timeframes)
✅ NA-safe logic (handles missing data)
✅ Works across all chart timeframes
⚠️ Important Disclaimers
Not financial advice: Educational and informational purposes only
No performance guarantees: Past breakouts don't predict future results
Risk management essential: Always use proper position sizing
Test before trading: Backtest and paper trade first
⚡ Quick Start
Add indicator to chart
Set symbols (default: SPY/QQQ/IWM/DIA)
Set 4 timeframes (default: 15/30/60/D)
Customize colors if desired
Create alerts (optional)
Watch for 📈IBSB or 📉IBSB labels with timeframe designation
📞 Support
Follow for updates and new indicators.
Questions? Leave a comment below — I respond to all feedback.
💬 Final Thoughts
Multi-timeframe compression breakouts with 4-symbol confirmation. Instead of monitoring dozens of charts manually, see all your timeframe breakouts in one place. When multiple timeframes align with simultaneous 4-symbol breakouts, you get clearer directional signals.
Use as one component of your analysis, combine with your risk management, and always trade with discipline.
Happy trading! 📈
Free and open-source for personal use. If you find this valuable:
👍 Like | 📝 Review | 🔔 Follow

SMT Cycles by AlgoKingsSMT Cycles by AlgoKings
RISK DISCLAIMER: This indicator is an analytical tool for educational purposes only, not financial advice. Trading carries substantial risk of loss. This tool does not guarantee profitable trades. Always use proper risk management and never risk more than you can afford to lose.
WHAT ARE SMT CYCLES?
This indicator identifies Smart Money Technique divergences using cycle-based analysis rather than standard timeframes. Cycles represent natural market rhythms (sessions, 90-minute institutional windows, true daily periods) that better align with institutional trading patterns than arbitrary timeframe bars.
Example: During the London session, NQ makes a new high but ES fails to follow = Bearish SMT divergence within the London cycle
UNDERLYING METHODOLOGY
This indicator combines four analytical layers:
1. AUTOMATIC CORRELATION MAPPING
Built-in correlation intelligence for 40+ pairs (identical to SMT Custom):
- Futures: NQ, ES, YM cross-correlation | GC/SI | 6E/6B
- Forex: EURUSD/GBPUSD/DXY(inverse) | AUDUSD/NZDUSD
- Stocks: MAG7 (META, NVDA, MSFT, etc.) vs NDX
- Crypto: BTCUSD/ETHUSD
Algorithm automatically mirrors contract types and exchange prefixes using regex-based parsing for futures contracts and micro variants.
2. CYCLE-BASED PERIOD DETECTION
Unlike standard timeframe analysis, this indicator uses market structure cycles:
SWING CYCLES (Position Trading):
- Yearly: 12-month institutional rebalancing periods
- Quarterly: 3-month earnings and fund rotation cycles
- Monthly: Calendar month institutional flows
- Weekly: 7-day swing trading cycles
- Daily: Standard 18:00-18:00 EST bars
- TrueDay: 00:00-00:00 EST for 24-hour markets (futures, forex, crypto)
INTRADAY CYCLES (Day Trading):
- Session: Asia (18:00-02:00), London (02:00-08:30), NY AM (08:30-12:00), NY PM (12:00-17:00) EST
- 90m: Three 90-minute windows per trading day (02:00-03:30, 03:30-05:00, etc.)
- 30m: 30-minute institutional order flow windows
- 10m, 3m, 1m: Scalping cycles for precise entry timing
Technical implementation:
- TrueDay calculation: Detects candle closes at exactly 00:00 EST using time modulo arithmetic on 24-hour markets. Differs from standard Daily bars which use futures settlement times (18:00 EST).
- Session detection: Regex pattern matching on hour/minute timestamps to identify cycle boundaries (e.g., h==2 and m==0 triggers Asia session end)
- 90m hierarchy: Groups sub-90m cycles (30m, 10m, 3m, 1m) under their parent 90m window using group timestamp tracking (gx field)
- Intermediate accumulation: For multi-bar cycles (TrueDay, Sessions, 90m), maintains running high/low (nh1, nl1) across constituent bars until cycle completion
3. MULTI-TIMEFRAME CYCLE ANALYSIS
Proprietary cycle synchronization:
- Tracks price structure across up to 11 configurable cycles simultaneously
- Maintains independent high/low tracking for each symbol pair using request.security()
- Compares previous cycle extremes (high , low ) across correlated pairs
- Timestamps divergence formations at chart timeframe precision
- Implements adaptive purge logic (1min to 12M) based on cycle type
4. DIVERGENCE CLASSIFICATION SYSTEM
Bullish SMT: Chart symbol makes lower low within cycle, correlated pair does NOT = Institutional buying pressure
Bearish SMT: Chart symbol makes higher high within cycle, correlated pair does NOT = Institutional selling pressure
Advanced features include level tracking (monitors when extremes are revisited), automatic extension until both levels violated, 90m hierarchy overlap filtering (hides sub-90m SMT within parent 90m window), and inverse correlation support for DXY relationships.
WHY CLOSED-SOURCE?
This script protects proprietary algorithms:
- Cycle boundary detection: Custom logic for TrueDay calculation (00:00 EST candle close detection using modulo arithmetic on 24h markets), Session identification (time-based regex for Asia/London/NY periods), and 90m window calculation (minute offset from 02:00 EST baseline)
- Intermediate cycle accumulation: Complex state management for multi-bar cycles (Sessions, 90m, TrueDay) that build complete cycle values across constituent bars before finalizing
- 90m hierarchy system: Proprietary grouping algorithm (gtype, gca, gx fields) that links sub-90m cycles to parent windows for intelligent overlap filtering
- Automatic symbol mapping: Custom logic for 40+ correlation pairs including futures contract recognition and exchange inheritance
- Adaptive purge system: Cycle-specific memory management (1S to 12M) optimized through backtesting
- Multi-level tracking: Simultaneous monitoring of multiple active divergences across different cycle types with state management for "taken" levels
Standard SMT indicators use fixed timeframes. This script analyzes institutional cycles that don't align with standard bar periods, requiring complex time arithmetic and multi-bar aggregation logic.
TECHNICAL COMPONENTS
Core structures:
- Cycle Object: Tracks high/low/time for each cycle type with intermediate values (nh1, nl1) for multi-bar cycles and complete cycle values (h1, l1, t1) upon cycle completion
- CycleType Enum: Defines 11 cycle types (year, quarter, month, week, day, trueday, session, m90, m30, m10, m3, m1) with associated period strings and purge thresholds
- Point Object: Stores divergence formation data for chart symbol level and correlated symbol level with "taken" status tracking
- SMT Object: Visual representation with line extension, tooltip showing formation time (EST), and optional 90m group timestamp (gx) for hierarchy filtering
Cycle detection logic:
- TrueDay: Tests if hour==0, minute==0 at candle close OR day-of-week changes (with Monday exception for markets closed weekends)
- Session: Matches specific hour:minute combinations (16:30=Void, 02:00=Asia end, 06:30=London end, 11:00=NY AM end, 15:30=NY PM end)
- 90m: Calculates (hour*60 + minute - 120) % 90 == 0 to detect 90-minute boundaries from 02:00 EST baseline
HOW TO USE
Setup (Automatic Mode - Recommended):
1. Apply to chart of supported pair (see correlation list above)
2. Indicator automatically detects optimal comparison symbols
3. Enable/disable specific cycle categories (Swing or Intraday) in settings
4. Enable/disable individual cycles within each category
5. Adjust visual preferences (colors, line styles, labels)
Setup (Manual Mode):
1. Uncheck "Automatic Symbol Mode" in settings
2. Enter "Manual Symbol #1" (e.g., ES1! when chart shows NQ1!)
3. Optional: Enter "Manual Symbol #2" for three-way comparison
4. Check "Invert" if symbol is inversely correlated (e.g., DXY vs EURUSD)
Chart Timeframe Requirements:
- Swing cycles: Chart TF must be <= cycle period (e.g., Daily cycle requires 1H or lower chart)
- Intraday cycles: Chart TF must divide evenly into cycle (e.g., 90m cycle requires 30m, 15m, 10m, 5m, or lower chart)
- TrueDay: Automatically selected for 1H and below chart TF on 24-hour markets (futures, forex, crypto)
Interpretation:
- Blue lines = Bullish SMT (chart made lower low within cycle, correlated pair held higher). Potential reversal up.
- Red lines = Bearish SMT (chart made higher high within cycle, correlated pair stayed lower). Potential reversal down.
- Dots in labels = Multiple SMT signals overlap. Hover to see all cycles showing divergence.
SETTINGS EXPLAINED
Symbols:
- Automatic Symbol Mode: Uses built-in correlation intelligence (recommended)
- Manual Symbol #1/2: Override automatic selection
- Invert: For inverse correlations (DXY vs majors)
- Hide Exact Overlap: Removes duplicate signals with identical start/end times
- Hide 90m Hierarchy Overlap: Hides sub-90m SMT (30m, 10m, 3m, 1m) when contained within parent 90m window
- Hide All Overlap: Hides lower precedence SMT when start/end points overlap higher precedence SMT
Intraday Cycles (Enable/Disable per symbol):
- Session: Asia (18:00-02:00), London (02:00-08:30), NY AM (08:30-12:00), NY PM (12:00-17:00) EST
- 90m: Three 90-minute institutional windows per day
- 30m: 30-minute cycles
- 10m, 3m, 1m: Scalping cycles
- Each cycle has two checkboxes: left for Symbol #1, right for Symbol #2
Swing Cycles (Enable/Disable per symbol):
- Yearly: 12-month cycles
- Quarterly: 3-month cycles
- Monthly: Calendar month cycles
- Weekly: 7-day cycles
- Daily: Standard daily bars (18:00-18:00 EST) OR TrueDay (00:00-00:00 EST on 1H and below chart TF for 24h markets)
- Each cycle has two checkboxes: left for Symbol #1, right for Symbol #2
Display:
- Bull/Bear: Enable/disable directional signals
- Line colors, styles (solid/dashed/dotted), widths
- Label: Show/hide text labels with color and size options
- SMT formation time: Displays timestamp in tooltip (New York time)
UPDATES
This script is actively maintained. Updates released through TradingView's native update system. For technical questions, use the comment section below.

SMT Custom by AlgoKingsSMT Custom by AlgoKings
RISK DISCLAIMER: This indicator is an analytical tool for educational purposes only, not financial advice. Trading carries substantial risk of loss. This tool does not guarantee profitable trades. Always use proper risk management and never risk more than you can afford to lose.
WHAT IS SMART MONEY TECHNIQUE (SMT)?
SMT identifies divergences between correlated market pairs when one asset makes a new high/low but its correlated counterpart fails to do so. These divergences often signal institutional repositioning and potential reversal points.
Example: NQ makes a new high at 15,200 but ES fails to exceed its previous high = Bearish SMT divergence
UNDERLYING METHODOLOGY
This indicator combines three analytical layers:
1. AUTOMATIC CORRELATION MAPPING
Built-in correlation intelligence for 40+ pairs:
- Futures: NQ, ES, YM cross-correlation | GC/SI | 6E/6B
- Forex: EURUSD/GBPUSD/DXY(inverse) | AUDUSD/NZDUSD
- Stocks: MAG7 (META, NVDA, MSFT, etc.) vs NDX
- Crypto: BTCUSD/ETHUSD
Algorithm automatically mirrors contract types (perpetual/quarterly futures) and exchange prefixes using regex-based parsing. Recognizes quarterly contracts (NQU2025), micro contracts (MNQ, MES), and perpetual syntax (NQ1!).
2. MULTI-TIMEFRAME CYCLE ANALYSIS
Proprietary cycle detection algorithm:
- Tracks price structure across 9 configurable timeframes simultaneously
- Maintains independent high/low tracking for each symbol pair using request.security()
- Identifies cycle completions with time-synchronized bar analysis
- Implements adaptive purge logic (1min to Monthly) to balance historical context vs performance
Technical implementation compares previous period extremes (high , low ) across correlated pairs and timestamps divergence formations at chart timeframe precision.
3. DIVERGENCE CLASSIFICATION SYSTEM
Bullish SMT: Chart symbol makes lower low, correlated pair does NOT = Institutional buying pressure
Bearish SMT: Chart symbol makes higher high, correlated pair does NOT = Institutional selling pressure
Advanced features include level tracking (monitors when extremes are revisited), automatic extension until both levels violated, overlap filtering to remove redundant signals, and inverse correlation support for DXY relationships.
WHY CLOSED-SOURCE?
This script protects proprietary algorithms:
- Automatic symbol mapping: Custom logic for 40+ correlation pairs including futures contract recognition (expiration codes, micro contracts) and exchange inheritance
- Cycle synchronization engine: Complex timestamp matching ensures divergences only flagged when both symbols' cycle periods align perfectly (prevents false signals from data lag)
- Adaptive purge system: Timeframe-specific memory management (1S to 12M) optimized through backtesting
- Multi-level tracking: Simultaneous monitoring of multiple active divergences with state management for "taken" levels
- Overlap intelligence: Algorithm determines when to hide/combine signals from different timeframes while preserving information in tooltips
Standard divergence indicators simply compare two moving averages. This script performs real-time institutional flow analysis across correlated instruments.
HOW TO USE
Setup (Automatic Mode - Recommended):
1. Apply to chart of supported pair (see correlation list above)
2. Indicator automatically detects optimal comparison symbols
3. Enable/disable specific timeframes in settings
4. Adjust visual preferences (colors, line styles, labels)
Setup (Manual Mode):
1. Uncheck "Automatic Symbol Mode" in settings
2. Enter "Manual Symbol #1" (e.g., ES1! when chart shows NQ1!)
3. Optional: Enter "Manual Symbol #2" for three-way comparison
4. Check "Invert" if symbol is inversely correlated (e.g., DXY vs EURUSD)
Interpretation:
- Blue lines = Bullish SMT (chart made lower low, correlated pair held higher). Potential reversal up.
- Red lines = Bearish SMT (chart made higher high, correlated pair stayed lower). Potential reversal down.
- Dots in labels = Multiple SMT signals overlap. Hover to see all timeframes.
SETTINGS EXPLAINED
Symbols:
- Automatic Symbol Mode: Uses built-in correlation intelligence (recommended)
- Manual Symbol #1/2: Override automatic selection
- Invert: For inverse correlations (DXY vs majors)
- Hide Exact Overlap: Removes duplicate signals with identical start/end times
- Hide All Overlap: Hides lower timeframe SMT within higher timeframe ranges
Timeframes:
- 9 configurable timeframe rows
- Toggle each symbol independently (Sym #1, Sym #2 checkboxes)
- Default: Chart TF, 1m, 5m, 15m, 1H, 4H, Daily, Weekly, Monthly
Display:
- Bull/Bear: Enable/disable directional signals
- Line colors, styles (solid/dashed/dotted), widths
- Label: Show/hide text labels with color and size options
- SMT formation time: Displays timestamp in tooltip (New York time)
UPDATES
This script is actively maintained. Updates released through TradingView's native update system. For technical questions, use the comment section below.

Price Probability Engine - Volatility & Structure-Based TargetsThe aim of the indicator is:
To provide adaptive, probability-weighted price target zones that help traders frame where price is most likely to interact next, without predicting when or guaranteeing direction.
Price Probability Engine is a target-projection overlay that blends three independent “next-move” reference methods into a single pair of AVG targets:
AVG Bull = a probabilistic upside objective
AVG Bear = a probabilistic downside objective
It is designed to help you frame the most reasonable near-term price zones using both volatility (ATR) and structure (pivot swings + measured moves) rather than relying on a single indicator.
What you see on the chart
When enabled, the script plots:
AVG Bull line (upper target)
AVG Bear line (lower target)
Optional last-bar labels that print the current target values
The overlay is scale-locked so the plots stay aligned with price when you scroll/zoom the chart.
How it works (conceptual, step-by-step)
1) ATR “reach filter” (probability gating)
All components are first checked against a reach filter:
A target is considered “reachable” only if it is within
Reach Filter × ATR from the current price.
This prevents extremely distant projections from dominating the final average.
2) Three component target engines
The script computes three upside candidates and three downside candidates:
A) ATR Component (volatility projection)
Uses ATR Length and ATR Multiplier
Projects a simple near-term band around price:
atrBull = close + ATR × mult
atrBear = close - ATR × mult
Direction mode:
Candle: compares close to close
Momentum(3): uses close − close
B) AutoFib Component (swing extension)
Detects swing highs/lows using pivot logic (Left/Right bars)
Projects an extension using a selectable Fib level (1.272 / 1.414 / 1.618 / 2.0 / 2.618)
Gives a structure-based target derived from the current swing range
C) Lindsey Component (measured-move target)
Detects a 3-point pivot sequence (P1/P2/P3) and projects a measured move to P4:
Bull: from a low-high-higher-low sequence
Bear: from a high-low-lower-high sequence
Optional P1/P2/P3 markers can be displayed for learning/debugging
3) Dynamic weighting (closer targets matter more)
If Dynamic Weights is enabled, each component’s weight increases as the target gets closer to price (within the reach window).
This means the final AVG tends to favor targets that are both reachable and near-term relevant.
You can control:
Base Weight (Fib / Lindsey / ATR)
Dynamic Power (how aggressively “closer” becomes “heavier”)
4) Outlier trimming (stability)
If Trim Outlier Component is enabled, the script:
computes a simple median reference of the remaining component targets
drops any target that deviates from the median by more than
Outlier Threshold × ATR
This reduces sudden jumps when one method produces an unusually extreme projection.
5) Final output: a weighted average (bull + bear)
The remaining eligible components are combined into:
AVG Bull (weighted average of bull candidates)
AVG Bear (weighted average of bear candidates)
If no components pass the reach filter (or are trimmed), the AVG line can temporarily become unavailable until valid inputs re-appear.
How to use it (practical workflow)
Pick your timeframe, then tune ATR:
Start with ATR Length 14 and ATR Mult 1.0–1.5
Set a reasonable Reach Filter (x ATR):
Smaller = only near targets
Larger = includes more distant projections
Decide how you want it to behave:
Dynamic Weights ON for “closer targets dominate”
Outlier Trim ON for smoother / less erratic averages
Use the AVG lines as planning zones, not certainties:
They are best treated as “where price is most likely to seek next” based on the blend of volatility + structure.
A common use is to monitor how price reacts as it approaches either AVG line (stalling, rejection, acceleration), and then reassess as new pivots/ATR values update.
Settings guide (quick)
ATR Length / Multiplier: controls the volatility envelope
Direction Mode: changes the bias input for ATR projection
Lindsey Left/Right: smaller = more sensitive pivots; larger = fewer, more meaningful pivots
Fib Left/Right + Extension: controls the swing structure target
Reach Filter: controls what qualifies as a realistic near-term target
Dynamic Power: higher = stronger preference for the nearest target
Outlier Threshold: higher = fewer removals; lower = more aggressive trimming
Notes / Transparency
This script does not place trades or guarantee outcomes. It is a visual target framework that adapts as volatility and market structure change. For best clarity, publish charts with this script on a clean layout so the AVG lines and labels are easy to identify.

Volatility Adaptive Precision Trend [JOAT]Volatility Adaptive Precision Trend – REGMA/ZLEMA Trend & Volatility Engine
IMPORTANT NOTES (READ FIRST)
This is an indicator (not a strategy). It does not place trades. It provides a structured trend and volatility framework.
This script is written in Pine Script v6 and is intended to be used on standard candlestick charts .
Source code visibility: This script is published as Protected Source (closed-source) . The purpose is to protect the work from unauthorized re-uploads/copies and to maintain a stable versioning path. This description is intentionally detailed so you can understand what the indicator does and how to use each feature without needing access to the implementation.
Protected Source / Closed-Source Clarification
Protected source does not mean "trust me blindly". It means the internal implementation is not publicly viewable.
The operational behavior is documented here: what is plotted, what each dashboard cell means, what each input controls, and how to interpret the output.
If you see re-uploads or near-identical copies elsewhere, treat them with caution and rely on the official publication.
Overview
Volatility Adaptive Precision Trend (VAPT) is a professional trend engine designed to stay responsive in fast markets while remaining stable in chop. It combines:
Regularized EMA (REGMA) – advanced smoothing with lambda parameter for noise reduction while maintaining responsiveness
Zero-Lag EMA (ZLEMA) – optional mode that eliminates traditional EMA lag for faster trend detection
Adaptive ATR Bands – volatility-based envelopes that expand and contract with the regime
Dynamic Risk Zones – extended envelopes beyond bands highlighting extreme stretch areas
Session Analysis – Asian, London, and New York session awareness with background shading
Professional Gradient Visualization – multi-layer trend lines with strength-based coloring
The purpose is to provide a clean, adaptive trend framework that adjusts to volatility conditions automatically.
What Makes It Original (Originality & Usefulness)
This script is not a simple moving average with bands. It is a coordinated workflow:
REGMA/ZLEMA Hybrid introduces a regularization term into the EMA recursion: REGMA = alpha x price + (1-alpha) x (REGMA + lambda x (price - REGMA ))
Adaptive Volatility Engine combines fast and slow ATR measures to estimate whether volatility is expanding or contracting
Volatility Regime Classifier compares current ATR to its moving average and standard deviation to label conditions as LOW/NORMAL/HIGH
Trend Strength Model measures distance between fast and slow trend lines, normalized by ATR
Session Context provides awareness of major trading sessions for regime interpretation
The combination creates a trend system that adapts to market conditions rather than using static parameters.
1) Chart Visuals – What You See on the Chart
A) Trend Lines (REGMA or ZLEMA)
Three trend lines form the core spine:
Trend Core – thickest line (linewidth 4), full gradient color, primary decision spine
Trend Mid – medium line (linewidth 2), slightly transparent, provides depth
Trend Fast – thin line (linewidth 1), emphasizes short-term shifts around the core
All lines share the same gradient which transitions from bull tones to bear tones as normalized strength crosses through zero.
REGMA Mode:
Lambda parameter (0.0-1.0) controls regularization strength
Lambda = 0.0 = standard EMA behavior
Higher lambda = more smoothing, reduced noise
Default lambda = 0.5 for optimal balance
ZLEMA Mode:
Compensates for EMA lag by subtracting half-length delay before smoothing
Creates faster, more reactive spine
Toggle between modes based on preference
B) ATR Bands and Risk Clouds
Upper/Lower Bands – ATR x multiplier around the trend spine, semi-transparent envelopes
Upper/Lower Risk Zones – extended envelopes (1.5x ATR multiplier) beyond bands, lightly filled
Three regimes created:
Inside bands = "normal" price movement
Between band and risk cloud = elevated excursion
Beyond risk cloud = extreme stretch (often precedes reversion or acceleration)
C) Signal Labels (optional)
When enabled, VAPT marks:
BULL – when trend direction flips positive with sufficient strength (> signal threshold)
BEAR – when direction flips negative with sufficient strength
VOL – when volatility expansion event is detected (regime shifts to HIGH)
Labels are compact, positioned at local highs/lows to avoid overlapping bands.
D) Background Layers
Session background – subtle tint showing active session (Asian=blue, London=orange, NY=green) or OFF-HOURS
Price position tint – faint red when price sits above upper band, faint green when below lower band
2) VAPT System Dashboard – Full Glossary
A compact table in the top-right corner displays:
Row 1 – Trend
BULLISH : Fast trend line > Slow trend line
BEARISH : Fast trend line < Slow trend line
NEUTRAL : Lines approximately equal
Row 2 – Strength
Absolute normalized trend strength in percent (0-100%)
Calculated as distance between fast and slow lines, normalized by ATR, clipped to -1 to +1 range
Higher values = stronger directional conviction
Row 3 – Volatility
LOW : ATR < (ATR MA - 1 StdDev) – compressed ranges, mean-reverting behavior
NORMAL : ATR within +/-1 StdDev of MA – typical oscillation
HIGH : ATR > (ATR MA + 1 StdDev) – trending, impulsive conditions
Row 4 – ATR
Current Average True Range value
Useful for stop-loss placement and position sizing
Row 5 – Position
ABOVE BANDS : Price > upper band (potential overbought, bearish reversal context)
BELOW BANDS : Price < lower band (potential oversold, bullish reversal context)
IN BANDS : Normal price action, trend continuation context
Row 6 – Session
ASIAN : 20:00-00:00 UTC
LONDON : 03:00-12:00 UTC
NEW YORK : 09:30-16:00 UTC
OFF-HOURS : Outside major sessions
3) How the Engines Work (High-Level)
REGMA Calculation:
alpha = 2.0 / (length + 1.0)
REGMA = alpha x price + (1 - alpha) x (REGMA + lambda x (price - REGMA ))
Lambda term pulls the EMA path toward smoothness
ZLEMA Calculation:
lag = floor((length - 1) / 2)
ema_data = price + (price - price )
ZLEMA = EMA(ema_data, length)
Adaptive ATR Calculation:
atr_base = ATR(length)
atr_fast = ATR(length / 2)
atr_slow = ATR(length x 2)
volatilityRatio = atr_fast / atr_slow
adaptedATR = atr_base x volatilityRatio (when adaptive mode enabled)
Trend Strength Calculation:
diff = fast_trend - slow_trend
strength = diff / ATR
normalizedStrength = clamp(strength, -1, +1)
Signal Generation:
Bullish: trend direction changes from non-positive to positive AND strength > signal threshold
Bearish: trend direction changes from non-negative to negative AND strength < -signal threshold
Volatility Expansion: regime shifts from LOW/NORMAL to HIGH
4) Inputs & Settings – Full Reference
Trend System
Trend Period (default: 34): Base period for core trend spine. Larger = stability; smaller = sensitivity.
REGMA Lambda (default: 0.5): Regularization factor. 0.0 = standard EMA, higher = more smoothing.
Enable Zero-Lag Mode : Switches from REGMA to ZLEMA for faster response.
Volatility Bands
ATR Multiplier (default: 2.0): Width of bands around trend spine.
ATR Period (default: 14): Period for ATR calculation.
Adaptive Band Width : Toggles dynamic scaling based on volatility regime.
Session Analysis
Enable Session Zones : Toggle session background shading.
Asian Session (default: 2000-0000): Configurable session time.
London Session (default: 0300-1200): Configurable session time.
New York Session (default: 0930-1600): Configurable session time.
Signal Generation
Show Trend Changes : Toggle BULL/BEAR labels.
Show Volatility Expansion : Toggle VOL labels.
Signal Threshold (default: 0.3): Minimum strength for signal generation.
Visual Settings
Color Theme : Classic, Deep Purple, Sweden, Ocean, or Monokai.
Band Transparency (default: 90): Controls fill opacity for bands.
Show Risk Zones : Toggle extended risk cloud visibility.
5) Recommended Workflow (Practical Use)
For Scalping (1-5 min charts):
Trend Period: 21
ATR Multiplier: 1.5
Signal Threshold: 0.2
For Day Trading (5-30 min charts):
Trend Period: 34 (default)
ATR Multiplier: 2.0 (default)
Signal Threshold: 0.3 (default)
For Swing Trading (1H-4H charts):
Trend Period: 55
ATR Multiplier: 2.5
Signal Threshold: 0.4
For Position Trading (Daily charts):
Trend Period: 89
ATR Multiplier: 3.0
Signal Threshold: 0.5
Step-by-Step Usage:
Step 1 – Check dashboard Trend and Strength for directional bias
Step 2 – Note Volatility regime (avoid fighting strong bands when HIGH)
Step 3 – Use Position readout to identify stretched vs normal conditions
Step 4 – Consider Session context for move quality assessment
Step 5 – Enter on pullbacks toward core trend line from beyond bands in strong trends
Step 6 – Use mean-reversion ideas primarily when volatility is LOW
Step 7 – Manage risk externally using ATR for stop placement
6) Alerts
VAPT ships with alert conditions for:
VAPT Bullish Signal : Bullish trend change detected
VAPT Bearish Signal : Bearish trend change detected
VAPT Volatility Expansion : High volatility regime entered
VAPT Price Above Bands : Price exceeded upper band
VAPT Price Below Bands : Price exceeded lower band
Recommended: Attach alerts to "Once Per Bar Close" to avoid reacting to intra-bar fluctuations.
7) Limitations & Best-Use Guidance
VAPT is an analytical tool, not an automatic trading system. It does not manage orders or risk for you.
Normal caution around indicator lag, volatility shocks, and gaps still applies.
Back-testing any workflow built on this indicator should account for realistic spreads, slippage, and commissions.
Always validate settings on your own symbols and timeframes; there is no single configuration that suits every market.
Session times are in exchange timezone; adjust if needed for your specific instruments.
Disclaimer
This script is for educational and informational purposes only. It does not constitute financial advice. Trading involves risk, and you are responsible for your own decisions, sizing, and risk controls. Always test settings and workflows in a simulated environment before using them in live markets.
-Made with passion by officialjackofalltrades

SMC + Dual UT Bot buy and sell AlertsMise a jour avec un EMA 20/50 et vwap
his script is a composite indicator for TradingView (Pine Script v5) that merges Smart Money Concepts (SMC) with a Dual-instance UT Bot. It has been styled with a high-contrast "Neon Cyberpunk" theme (Cyan/Pink) and is fully compliant with the CC BY-NC-SA 4.0 license.
Here is a breakdown of its two main components:
1. Smart Money Concepts (SMC)
This portion, originally by LuxAlgo, is designed to identify institutional price levels and structural market shifts. It provides a detailed map of market structure rather than simple entry/exit signals.
Market Structure (BOS & CHoCH):
BOS (Break of Structure): Marks trend continuation (e.g., breaking a higher high in an uptrend).
CHoCH (Change of Character): Marks potential trend reversals (e.g., the first time a higher low is broken in an uptrend).
Order Blocks (OB):
Highlights specific candles where institutional buying or selling likely occurred. These act as high-probability support/resistance zones.
Neon Blue/Cyan for Bullish OBs.
Neon Pink for Bearish OBs.
Fair Value Gaps (FVG):
Identifies imbalances (gaps) in price action where the market often returns to "fill" orders.
Neon Mint for Bullish FVGs.
Neon Red for Bearish FVGs.
Premium/Discount Zones: Automatically plots the range equilibrium (50% level) to help you buy in "Discount" (low) and sell in "Premium" (high) areas.
Liquidity (EQH/EQL): Automatically detects "Equal Highs" and "Equal Lows," which are magnets for price as they represent liquidity pools (stop losses).
2. Dual UT Bot Alerts
This portion provides the actual Entry Signals. It runs two separate instances of the "UT Bot" strategy simultaneously with different sensitivity settings to filter noise.
Instance 1 (Buy Only):
Settings: Key Value = 4, ATR Period = 10 (Faster, more sensitive).
Visual: Plots a Neon Cyan "Buy" label.
Function: Looks for bullish reversals earlier to catch the start of a move.
Instance 2 (Sell Only):
Settings: Key Value = 7, ATR Period = 20 (Slower, smoother).
Visual: Plots a Neon Pink "Sell" label.
Function: Uses a wider ATR band to avoid getting shaken out of shorts too early, focusing on major downtrends.
How to Use It
The strength of this script is confluence.
Wait for a Signal: Look for a UT Bot "Buy" or "Sell" tag.
Confirm with SMC: Check if the signal aligns with SMC concepts.
Example Buy: Did the UT Bot give a "Buy" signal while price was bouncing off a Bullish Order Block?
Example Buy: Did price just sweep Liquidity (EQL) before the Buy signal?
Example Sell: Is the "Sell" signal happening inside a Premium Zone or a Bearish Fair Value Gap?
avant-hier
Notes de version
1. "Pro" Badge Buy/Sell Labels
The standard text signals have been replaced with modern, professional Badge Labels that provide more information at a glance.
Visuals: Instead of simple text, the script now uses label.new to create high-visibility badges.
BUY: A Neon Cyan badge with a Rocket icon (🚀).
SELL: A Neon Pink badge with a Chart icon (📉).
Price Details: Each badge displays the exact Entry Price directly on the label.
Tooltips: If you hover your mouse over a Buy or Sell badge, a tooltip will appear showing the exact Take Profit (TP) and Stop Loss (SL) prices calculated for that trade.
2. Dynamic Take Profit (TP)
The script now automatically calculates a profit target for every trade the moment a signal is generated.
Calculation: It measures the distance between your Entry Price and the initial Stop Loss (the ATR Trailing Stop).
Risk:Reward: It multiplies that distance by your chosen Risk:Reward Ratio (default is 1.5) to project a TP target.
Visual Line: A Green Line is drawn on the chart at the TP level. It remains active until price hits it or the stop loss.
3. Active Trailing Stop Loss (SL)
The Stop Loss is no longer static; it is now "alive" and manages the trade for you.
Trailing Logic: If Use Trailing SL? is enabled (default), the SL line will automatically move up (for longs) or move down (for shorts) as the trend continues in your favor. It locks in profit by following the UT Bot's ATR trailing band.
Visual Line: A Red Line is drawn at the SL level. You can see it physically step up or down on the chart as the trend progresses.
4. Real-Time Trade Simulation
The script now simulates the lifecycle of a trade directly on the chart:
Active State: When a trade is live, the TP and SL lines extend to the right of the current candle (bar_index + 1), showing you exactly where your exit points are in real-time.
Closed State: Once the price hits either the Green TP line or the Red SL line, the script detects the "Exit." The lines stop extending and turn dotted, indicating that the trade is closed and waiting for the next signal.
Summary of New Settings
You will find a new group in the settings panel called "UT Bot: Trade Management":
TP Risk:Reward Ratio: Adjust this to change how far the Green TP line is placed (e.g., set to 2.0 for 2x return).
Use Trailing SL?: Uncheck this if you want the Red SL line to stay fixed at the initial entry risk level.
avant-hier
Notes de version
1. Live Strategy Performance Dashboard (Backtester)
Since this is an indicator, TradingView does not automatically calculate PnL (Profit and Loss). I have built a custom Simulation Engine inside the script that tracks every UT Bot signal as if you had taken the trade.
Location: Bottom Right of your chart.
Win Rate: Displays the percentage of trades that hit the Take Profit target versus the Stop Loss.
Trades (W/L): Shows the total number of signals generated, broken down by Wins and Losses.
Net Profit (R): Calculates your theoretical profit in "R-Multiples" (Risk Units).
Example: If you set your Risk:Reward to 2.0, every win adds +2R, and every loss subtracts -1R.
Dynamic Colors: The Win Rate and Profit cells turn Neon Cyan if positive (>50% or >0R) and Neon Pink if negative.
2. Multi-Timeframe Trend Dashboard
A new panel at the Top Right gives you an instant "Market Bias" reading so you don't have to scan the whole chart.
SMC Trend: Reads the Smart Money structure (Break of Structure/Change of Character) to determine if the high-level timeframe is BULLISH or BEARISH.
UT Bot Status: Displays the current active signal state:
BUY (Active): You are currently in a Long trade.
SELL (Active): You are currently in a Short trade.
NEUTRAL: No active signal or the last trade hit TP/SL.
3. Integrated Alert System
I have connected the visual lines to the alert system. You can now set a single alert on this indicator, and it will trigger for:
Entry Signals: "UT Long Entry" / "UT Short Entry"
Exits: "Take Profit Hit" / "Stop Loss Hit"
4. Consolidated Settings
To make the script easier to manage, I organized the settings into clear groups:
Dashboards: Toggle the visibility of the new panels or move the Performance Panel to a different corner.
UT Bot: Trade Management: Quickly adjust your Risk:Reward Ratio (e.g., change from 1.5 to 2.0) to see how it affects your Win Rate in real-time on the dashboard.
avant-hier
Notes de version
1. Multi-Timeframe (MTF) Trend Scanner
I have replaced the basic "Market Bias" panel with a comprehensive MTF Trend Dashboard located at the Top Right of your chart.
What it tracks: It simultaneously monitors the trend direction on 5 distinct timeframes:
15 Minute
1 Hour
4 Hour
Daily
Weekly
How it works: It runs a background calculation (using UT Bot settings Key=5, ATR=15) on these higher timeframes without you needing to switch charts.
Visuals:
BULLISH: Highlighted in Neon Cyan.
BEARISH: Highlighted in Neon Pink.
2. Strategic Confluence (How to use it)
This new dashboard transforms the script from a simple "signal generator" into a complete trading system by allowing you to filter trades based on the bigger picture.
The "All-Green" Rule: If you are scalping on a 5-minute chart and you get a BUY signal, check the dashboard. If the 1H, 4H, and Daily are all Neon Cyan (Bullish), that trade has a significantly higher probability of success.
Avoid Counter-Trend Trades: If your main chart says BUY, but the dashboard shows the 4H and Daily are Neon Pink (Bearish), you are trading against the major trend. You might want to skip that trade or reduce your risk size.
3. Summary of Dashboards
You now have two professional-grade panels on your screen:
Bottom Right (Performance): Shows the past results of the strategy on your current timeframe (Win Rate, Profit Factor).
Top Right (Trend): Shows the current state of the market across all timeframes.
