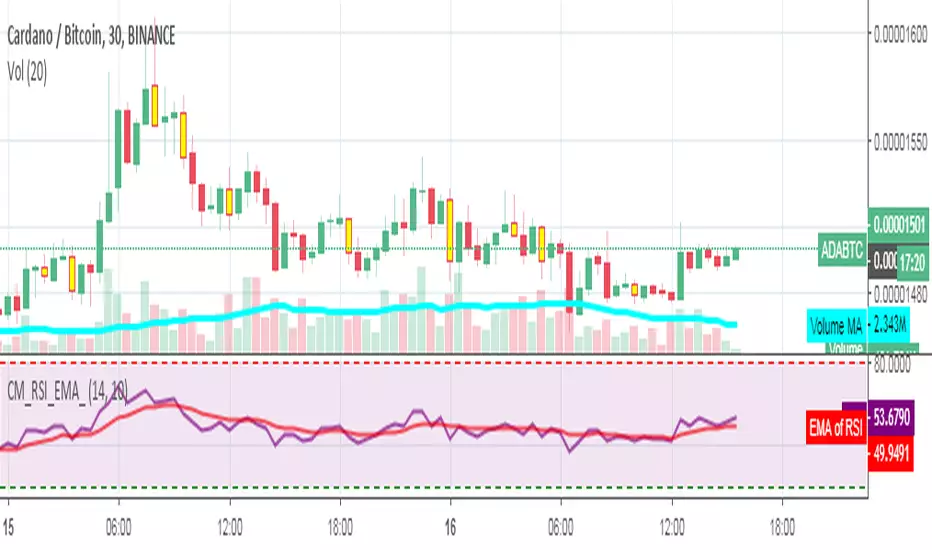
Bullish and Bearish Engulfing Patterns auto detectionThis simple indicator detects automatically most important bullish and bearish candlestick patterns formations. Used to locate potential supply and demand imbalances.
Copyright 2017 Alfonso Moreno www.set-and-forget.com
ค้นหาในสคริปต์สำหรับ "bear"
Super Envolvente (Bullish y Bearish)Identificador de Super-envolventes (SE), se encarga de darle un color verde a la SE alzista (Bullish) verde y rojo a la bajista (Bearish).
Bears VS BullsThis indicator will work on ANY instrument.
The red line is a moving average of ONLY sellers in the market.
The blue line is a moving average of ONLY buyers in the market.
The period or "length" of the individual moving averages can be adjusted in the indicator settings.
The default, it is set to 50.
Buying and selling trends often provide indications of market moves such as the most recent bottom in Cryptocurrencies.
Feel free to comment and share any indicator concepts or ideas for content you would like to see added to the Technical Indicator Bundle on www.kenzing.com
Bearish Trailing stopIt is a trailing SL. Works very well. Good good very good. Looks like my description needs more, so here is more random text.
bearish Price Below PDL - Complete Multi-Confirmation Alert🎯 KEY IMPROVEMENTS:
1. Enhanced Alert Visibility:$jmoskyhigh
✅ HUGE triangle down marker with "SELL" text
✅ Alert title: "SELL SIGNAL - PDL BREAKDOWN CONFIRMED"
✅ Prominent info panel with red theme
✅ Clear "SELL ALERT: TRIGGERED" status
2. Better Visual Feedback:
Red frame around info panel
Larger shapes and markers
Color-coded confirmations (green = OK, red = FAIL)
Progress percentage displayed
Breakdown price label
3. Complete Alert System:
Main Alert: "SELL SIGNAL - PDL BREAKDOWN CONFIRMED"
Early Warning: "PDL Breakdown Started - Monitoring"
Reset Alert: "Confirmation Lost - Breakdown Reset"
Bearish signal using Point of Control (POC) with PAC by guruThis indicator code helps traders identify potential sell opportunities using several important technical indicators:
Point of Control (POC) – This is the price level where the most volume was traded over the past several days.
Previous Day's Low – This shows the lowest price reached during the previous day.
PAC (Price Action Channel) EMA – These are two moving averages (one based on the low price and one based on the close price) that help determine if the price is trending within a certain range.
Volume SMA – This is a 3-day simple moving average (SMA) of volume, which helps filter out signals based on market activity.
What the Script Does:
Point of Control (POC):
The script looks at the last 50 days (configurable) and calculates which price level had the highest trading volume.
It then plots a red line on the chart at the POC level. This is important because it helps identify areas where there was strong market interest in the past.
Volume Moving Average:
The script calculates a 3-day SMA of volume, but it excludes the current day to avoid premature signals based on today’s trading.
The volume SMA is used to ensure there’s enough market activity (with a threshold set to 25 units) before triggering a sell signal.
Price Action Channel (PAC) EMA:
The PAC consists of two exponential moving averages (EMAs):
The PAC Low EMA: This is based on the low prices over the last 34 periods (configurable).
The PAC Close EMA: This is based on the closing prices over the last 34 periods.
These EMAs help determine if the price is trending above or below certain price levels.
Sell Signal Logic: The script checks three conditions before displaying a "Sell" signal:
Price Below POC and Previous Day’s Low:
The close price must be below both the Point of Control (POC) and the previous day's low.
Volume SMA Above 25:
The 3-day volume SMA must be greater than 25. This ensures the signal only triggers when there’s enough trading volume in the market.
Today’s Low is Above PAC EMAs:
Today's low price must be above both the PAC low EMA and the PAC close EMA. This prevents sell signals when prices are already significantly below the PAC, indicating possible exhaustion in the downtrend.
If all three conditions are met, the script will display a red "Sell" label on the chart, signaling a potential selling opportunity.
No Sell Signal if Price Reverses:
If the price crosses back above the POC or the previous day's low, the script will remove the sell signal and reset for a new opportunity.
Summary of Conditions:
For the script to display a "Sell" label:
The close price must be below the Point of Control (POC) and the previous day’s low.
The 3-day volume SMA (excluding today) must be greater than 25 units.
The low price of the current day must be above both the PAC low EMA and the PAC close EMA.
If these conditions are met, a red sell label appears on the chart as a potential signal for a short (sell) trade.
Bearish FS Continuation S1BB - baby bar / inside bar
DF - downflow, meaning 20MA below 50MA
EXE - execution bar, indicator to short
Mainly to identify execution bar for shorting using inside bar identification and force top
Guneet-ScalperBearish trend candle color change to red with sell print
Bullish trend candle color change to green with buy print
thanks
jas toor
QQQ EOD Sentiment + Flip Points (3:55 ET) - Final Fix### QQQ EOD Sentiment + Flip Points (3:55 ET) — Overnight Swing Bias Helper
This indicator is designed for **QQQ overnight holds / short swing setups** where your decision is made **near the end of the trading day** (ex: around **3:55pm Eastern**) to decide whether you want to hold **calls or puts** into the next session.
It does **one job**:
**Turn end-of-day price positioning into a simple bullish/bearish “bias score”, and show the exact price distance needed to flip that bias.**
---
## What the indicator is measuring (simple idea)
At the end of the day, you want to know:
* Did QQQ close strong relative to **yesterday’s range**?
* Did QQQ close strong relative to **yesterday’s close**?
* Did QQQ finish the day in the **upper part** of yesterday’s range (or the lower part)?
The indicator converts those answers into a **Score**, then labels the day as:
✅ **BULLISH**
✅ **BEARISH**
✅ **NEUTRAL**
---
## What you see on the chart
### 1) Key levels from the previous day
The indicator plots important reference lines from the **previous trading day**:
* **Previous Day High**
* **Previous Day Low**
* **Previous Day Midpoint (50%)**
* **Previous Day Close**
* Optional “strength lines” inside the range (based on your thresholds)
These lines help you visually understand **where today’s price is sitting** compared to the prior day.
---
### 2) A live Score + Sentiment (the “math”)
The indicator builds a score using 3 simple conditions:
**Condition A — Above/Below the 50% midpoint of yesterday**
* Above midpoint = bullish point
* Below midpoint = bearish point
**Condition B — Above/Below yesterday’s close (optional toggle)**
* Above yesterday’s close = bullish point
* Below yesterday’s close = bearish point
**Condition C — Close Location Value (CLV)**
This is just: *“Are we finishing near the top of yesterday’s range or the bottom?”*
* If price is high in the range → bullish point
* If price is low in the range → bearish point
Those points are combined into a **Score**, and once the score is high enough you get:
* **BULLISH**
* **BEARISH**
* or **NEUTRAL** if it’s mixed.
**Why this helps:**
It keeps you from guessing based on emotion into the close. You’re using a consistent checklist.
---
### 3) Flip Points (this is the best feature)
The indicator calculates:
* **How many points QQQ would need to rise to flip bullish**
* **How many points QQQ would need to drop to flip bearish**
So instead of debating “it feels bullish,” you can say:
> “If price holds above this area, bias stays bullish.”
> “If price drops X points, bias flips bearish.”
This is especially helpful into **3:55pm ET** when price is still moving.
---
### 4) Snapshot at 3:45 ET (15 minutes before close)
At **3:45pm Eastern**, the indicator stores a snapshot of:
* Score
* Sentiment
* CLV
That snapshot is saved for the day so you can compare:
* “What did the bias look like 15 minutes before close?”
* “Did price shift aggressively into the bell?”
---
### 5) Decision Label at 3:55 ET
At **3:55pm Eastern**, it prints a label on the chart showing:
* Current sentiment + score
* CLV now
* Flip points to bullish/bearish
* The 3:45 snapshot results
This makes it easy to make a consistent end-of-day decision.
---
## How to use it for a QQQ overnight swing
### My simple flow (new trader friendly)
1. Around **3:45 ET**, I check the Snapshot score/sentiment.
2. Around **3:55 ET**, I use the Decision label:
* If **BULLISH** → I’m leaning calls / bullish overnight bias
* If **BEARISH** → I’m leaning puts / bearish overnight bias
* If **NEUTRAL** → I usually avoid holding overnight unless I have another setup
3. I check the flip points:
* If price is close to flipping the other direction, I size smaller or pass.
---
## Settings you can adjust
* **Score needed for Bullish/Bearish**
Higher = stricter signals, fewer trades
Lower = more signals, more noise
* **Include Previous Day Close**
Turn ON if you want the “above/below yesterday close” rule included.
* **Bullish / Bearish CLV thresholds**
Controls what counts as “strong finish near the top/bottom of range.”
---
## When NOT to use this
* During major news events (CPI, FOMC, big earnings that impact markets)
* On extremely low volume holiday sessions
* If QQQ is inside a tight chop range and your score keeps flipping rapidly
This tool is **bias + structure**, not a guaranteed prediction.
---
## Disclaimer
This indicator is for educational purposes only and is not financial advice. Trading involves risk and you are responsible for your own decisions. Always manage risk and position size appropriately.
---
ProIndex v8ProIndex v8 — One indicator that shows trend strength + smart reversal hints
Non-repaint / stability notes
Most signals can be set to closed bars only.
Optional Hard Non-Repaint Mode is provided for the most sensitive modules (VPR + divergence), at the cost of fewer/laggier prints.
Intrabar VPR uses lower-timeframe data only when the selected TF is valid for the chart.
ProIndex v8 is an all-in-one trading indicator designed to answer two questions clearly:
- Is the market more bullish or bearish right now (and how strong is it)?
- Is a reversal starting to build (exhaustion / absorption / divergence)?
Instead of juggling lots of indicators, ProIndex v8 combines them into one easy-to-read histogram, plus optional labels on the chart.
What you get
1) A “Strength Meter” histogram (simple to read)
The main histogram changes color to show:
Weak Buy / Buy / Strong Buy
[Weak Sell / Sell / Strong Sell
special color when price is at an RSI extreme (overbought/oversold)
Optional “neutral” bars near the middle to show no clear edge
There’s also a signal line to help spot momentum shifts.
2) Clear buy/sell markers (optional)
You can show:
Small dots in the indicator when a buy/sell signal happens
Arrows on the price chart (so you don’t miss it)
You can choose if signals trigger when:
- the score crosses the signal line, or
- the score crosses the zero line (bullish vs bearish side)
3) A “confidence score” for signals (optional)
If you want fewer, higher-quality signals, ProIndex v8 can require extra confirmation before printing BUY/SELL labels.
You can turn on confirmations like:
- Double RSI
- Triple CCI
- Ultra low-lag MACD
When enabled, labels can show something like:
BUY 2/3 (2 confirmations out of 3 were aligned)
Extra tools for spotting reversals (optional)
4) Divergence labels (bullish/bearish)
ProIndex v8 can automatically mark:
Bullish divergence (selling pressure weakening)
Bearish divergence (buying pressure weakening)
…and also hidden divergence if you want it.
5) Exhaustion / sweep labels (turning point clues)
This feature looks for common reversal behaviour like:
price “sweeping” a recent high/low (liquidity grab),
then snapping back with strong rejection.
It can print labels like:
EXH BUY
EXH SELL
6) VPR reversal labels (ProIndex’s “smart reversal engine”)
This is the advanced reversal module, but the idea is simple:
When RSI goes extreme (overbought/oversold), ProIndex v8 watches:
where the most trading activity happened (the “busy price area”)
whether price is showing rejection / absorption / weakness
whether flow confirms it
Then it can print:
VPR BUY
VPR SELL
…and even ABSORB BUY/SELL labels when it detects absorption (lots of volume but price not moving much).
You can also show live guide lines on the chart (optional) during these RSI extreme phases.
Controls to reduce noise (important)
ProIndex v8 includes tools to help avoid “messy” market conditions:
A dead-zone near the middle (to reduce chop)
Optional volume filter (avoid low activity periods)
Optional chop filter (avoid sideways conditions)
Settings to keep labels readable (auto-delete old labels + smart stacking)
Who it’s for
ProIndex v8 is useful if you:
- trade trends and want to know when momentum is strong,
- trade pullbacks and want better timing,
- trade reversals and want extra warning signs (divergence/exhaustion/absorption),
- want one clean tool instead of 5–10 indicators.
Important note
This indicator does not guarantee wins. It’s a decision-support tool. Always test it on your market/timeframe and use proper risk management.
SUSTAIN - Trend Strength Meter📊 SUSTAIN - Trend Strength Meter
Measures if a trend has the "fuel" to continue or is running out of steam. Uses 3 key components to calculate a sustainability score from 0-100%.
What It Measures:
Momentum (40%) - ADX-based directional movement strength
Volume (30%) - Is volume supporting the trend direction?
Consistency (30%) - Are price bars following through in trend direction?
How to Read:
🟢 Green Dots = Bullish trend is SUSTAINED (safe to hold longs) 🔴 Red Dots = Bearish trend is SUSTAINED (safe to hold shorts)
🟠 Orange Bars = WEAK trend (40-60% score) - use caution ⬜ Gray X marks = FAILED trend (<40%) - no reliable direction
Entry/Exit Signals:
🟢 "LONG" label = Bullish trend just became sustained - consider long entry
🔴 "SHORT" label = Bearish trend just became sustained - consider short entry
❌ Gray X = Trend sustain lost - consider reducing/exiting position
Info Table Shows:
Current Score (0-100%)
Status: SUSTAINED / WEAK / FAILED
Trend Direction: BULLISH / BEARISH
Individual component scores
Use Cases:
Entry Confirmation - Wait for "LONG" or "SHORT" label before entering
Position Holding - Stay in trade while dots appear (trend sustained)
Exit Warning - Reduce position when gray X appears
Filter Other Signals - Only take signals from other indicators when SUSTAIN confirms direction
Settings:
Lookback: 14 bars (adjustable)
Sustain Threshold: 60% (score needed to confirm trend)
Weak Threshold: 40% (below this = failed)
Component weights customizable
Supertrend with Keltner Channels ~ CharonQuantThe Supertrend with Keltner Channels Strategy is a trend-following and volatility indicator designed to filter noise and highlight high-quality directional opportunities.
Core Logic
The indicator is based on two complementary components:
• Supertrend defines the primary market regime (bullish or bearish)
• Keltner Channels define volatility expansion and contraction
Signals are only generated when both trend direction and volatility breakout agree.
Signal Conditions
A Buy signal is triggered when:
• Supertrend flips bullish
• Price breaks above the upper Keltner Channel
A Sell signal is triggered when:
• Supertrend flips bearish
• Price breaks below the lower Keltner Channel
If one condition is missing, no signal is produced. This design prioritizes signal quality over signal frequency.
Visual Structure
The indicator uses a clear visual hierarchy:
• Bar coloring reinforces directional bias
• Supertrend acts as the main directional spine
• Keltner Channels provide volatility context
• Buy and Sell labels mark execution points
All visual elements can be enabled or disabled from the Visual Settings panel.
Development and usage notes:
This indicator was developed and calibrated on the 1D INDEX:BTCUSD chart.
You must tweak the parameters to fit your market, timeframe, and trading style.
If you do not read this description or do not understand what the indicator is designed to do, do not use it.
Indicators amplify both discipline and mistakes.
Important reminder: No single indicator is sufficient on its own.
Brahmastra Trend Fusion🔱 BRAHMASTRA TREND FUSION 🔱
━━━━━━━━━━━━━━━━━━━━━━━━━━━━━━
A professional-grade trend detection system that fuses THREE powerful indicators into ONE smooth, color-coded trend line with a premium glow effect.
This indicator eliminates noise and delivers crystal-clear trend signals by requiring MULTIPLE confirmations before changing state.
█ CORE TECHNOLOGY
━━━━━━━━━━━━━━━━━
- RSI (14) → Momentum confirmation
- ADX (14) → Trend strength filter
- Bollinger Bands (20, 2.0) → Price position & squeeze detection
█ HOW IT WORKS
━━━━━━━━━━━━━━
The indicator plots a SINGLE glowing trend line:
🟢 GREEN GLOW = Strong Bullish Trend
→ RSI > 50 and rising
→ ADX > 20 and rising (strong trend)
→ Price above Bollinger middle band
🔴 RED GLOW = Strong Bearish Trend
→ RSI < 50 and falling
→ ADX > 20 and rising
→ Price below Bollinger middle band
⚫ GRAY = Sideways / No Trend
→ ADX weak OR Bollinger squeeze detected
→ Avoid trading in this phase
█ KEY FEATURES
━━━━━━━━━━━━━━
✅ Multi-Layer Glow Effect - Premium visual design
✅ Non-Repainting - Uses confirmed bar close only
✅ Sideways Market Filter - Avoids false signals in ranging conditions
✅ Real-Time Info Panel - Live RSI, ADX, BB status & trend strength
✅ Trend Strength Meter - STRONG / MODERATE / WEAK labels
✅ Persistent State - Holds trend until opposite confirmation
✅ Built-In Alerts - Get notified on trend changes
█ INFO PANEL METRICS
━━━━━━━━━━━━━━━━━━━
┌────────────┬──────────────────────┐
│ Trend │ BULLISH/BEARISH/SIDEWAYS │
│ RSI │ Current value │
│ ADX │ Current value │
│ BB Status │ ABOVE/BELOW/INSIDE │
│ Strength │ STRONG/MODERATE/WEAK │
└────────────┴──────────────────────┘
█ SETTINGS
━━━━━━━━━━
- RSI Length (default: 14)
- ADX Length (default: 14)
- ADX Threshold (default: 20)
- Bollinger Length (default: 20)
- Bollinger Deviation (default: 2.0)
- Enable/Disable Glow Effect
- Enable/Disable Info Panel
- Customizable Colors
█ HOW TO TRADE
━━━━━━━━━━━━━━
SCALPING (5M-15M)
→ Enter on color change with tight stops
→ Exit when glow turns gray
INTRADAY (15M-1H)
→ Trade in direction of glow color
→ Use strength meter for position sizing
SWING (4H-Daily)
→ Hold positions until color reversal
→ Add on pullbacks when strength is "STRONG"
█ ENTRY RULES
━━━━━━━━━━━━━
1. GREEN line → Look for LONG entries only
2. RED line → Look for SHORT entries only
3. GRAY line → Stay flat, avoid new trades
█ EXIT RULES
━━━━━━━━━━━━
1. Exit LONG when line turns RED or GRAY
2. Exit SHORT when line turns GREEN or GRAY
3. Reduce size when strength shows "WEAK"
█ PROFESSIONAL GUARANTEES
━━━━━━━━━━━━━━━━━━━━━━━━━
❌ NO REPAINTING - Signals don't change after bar close
❌ NO FUTURE LEAK - All calculations use historical data
✅ CONFIRMED SIGNALS - Multiple indicators must agree
✅ CLEAN CODE - Optimized Pine Script v5
█ BEST FOR
━━━━━━━━━━
- Indices (NIFTY, BANKNIFTY, SPX, NQ)
- Stocks
- Crypto
- Forex
- All Timeframes
█ CREDITS
━━━━━━━━━
Developed by Brahmastra Trading Systems
For discretionary and algorithmic traders
━━━━━━━━━━━━━━━━━━━━━━━━━━━━━━━━━━
💡 Like & Follow for more premium indicators!
🔔 Enable alerts to never miss a trend change!
Breakout Targets [AlgoAlpha]🟠 OVERVIEW
This script identifies consolidation zones and provides automated breakout targets with risk management levels. It focuses on finding periods where price action compresses and then tracks the subsequent breakout from these ranges. When a price breakout is confirmed, the script automatically projects three take-profit (TP) levels and a stop-loss (SL) based on current market volatility. This helps traders move from identifying a range to executing a trade with predefined exit points without manual calculation.
🟠 CONCEPTS
The script uses a relationship between Weighted Moving Averages (WMA) and Exponential Moving Averages (EMA) of price ranges to detect consolidation. When these moving averages cross, it triggers the detection of recent pivot highs and lows to draw a visual "box" or channel. This channel represents the current trading range. Once price closes outside this box, the script uses the Average True Range (ATR) to determine the volatility-adjusted distance for the stop loss. The take-profit levels are then calculated as multiples of this risk distance, ensuring a consistent reward-to-risk approach.
🟠 FEATURES
Dynamic box drawing that highlights potential supply and demand zones within the range.
Real-time breakout signals with bullish (green) and bearish (red) markers.
Automated trade projection including Entry, SL, and three TP levels.
Integrated alert system for breakouts and hits on any profit or loss target.
🟠 USAGE
Setup : Add the script to your chart and adjust the "Range Detection Period." A higher period will find larger, more significant ranges, while a lower period will find smaller, short-term consolidation zones.
Read the chart : Look for the grey boxes on your chart; these represent areas where the market is "coiling." A green arrow label indicates a bullish breakout from the top of the box, while a red arrow indicates a bearish breakout from the bottom. Once a breakout occurs, follow the projected horizontal levels for your trade management.
Settings that matter : The Stop Loss ATR Multiplier is the most critical setting for risk; increasing it will give the trade more room to breathe but will also push your TP levels further away. The Prevent Overlap toggle is useful for keeping the chart clean by ensuring the script doesn't draw new boxes until the current range has been resolved.
SHIFT - Binary Trade Signal⚡ SHIFT - Binary Trade Signal
A simple ON/OFF trend indicator that tells you exactly when to be long or short. Based on optimized Supertrend logic with RSI confirmation.
How It Works:
Uses ATR-based bands that trail price during trends
When price closes below the lower band → "Shift OUT" (bearish)
When price closes above the upper band → "Shift IN" (bullish)
RSI confirmation prevents false signals in choppy conditions
How to Read:
🟢 Green cloud = IN mode (long bias, hold or add longs)
🔴 Red cloud = OUT mode (short bias, hold or add shorts)
▲ Arrow = Shift to IN (bullish flip - consider long entry)
▼ Arrow = Shift to OUT (bearish flip - consider short entry)
X markers = Dynamic stop level (trail with the Supertrend line)
Info Table:
State: Current confirmed direction or "Unconfirmed" if RSI doesn't align
Stop: Exact price level for stop-loss
Risk: Distance to stop in ATR (Low/Medium/High)
Trading Application:
Enter LONG when ▲ appears with green bars
Enter SHORT when ▼ appears with red bars
Use the Supertrend line as your trailing stop
Yellow bars = wait for confirmation before acting
Optimized Settings (backtested on 8 symbols):
ATR Period: 14
ATR Multiplier: 3.5
Win Rate: ~36%, Positive expectancy
Forecast Trend Filter ~ CharonQuantThe Forecast Trend Filter (FTF) is a trend and momentum confirmation indicator built on the original Forecast Oscillator concept developed by Tushar Chande.
The original Forecast Oscillator measures how far price deviates from a linear regression forecast to highlight momentum shifts.
This version extends that foundation and restructures it into a practical, signal-quality focused trend filter designed for real trading conditions.
What’s different in this implementation:
• Forecast Oscillator combined with slope confirmation to ensure momentum is accelerating, not stalling
• Trend alignment filter using a user-selectable moving average (SMA, EMA, WMA, HMA, ALMA, VWMA)
• Minimum deviation threshold to filter out weak or noisy signals
• Directional state logic that clearly defines bullish, bearish, or neutral conditions
• Visual trend context using adaptive colors, background bias, and overlay plots
Signals are only generated when all conditions align:
• Price deviates meaningfully from its linear regression forecast
• Oscillator slope confirms momentum continuation
• Deviation exceeds the minimum quality threshold
• Price is aligned with the higher-level trend filter
If one condition fails, the signal is ignored.
This design prioritizes signal quality over signal frequency.
Development and usage notes:
This indicator was developed and calibrated on the 1D INDEX:ETHUSD chart.
You must tweak the parameters to fit your market, timeframe, and trading style.
If you do not read this description or do not understand what the indicator is designed to do, do not use it.
Indicators amplify both discipline and mistakes.
Important reminder: No single indicator is sufficient on its own.
ForexArchitects Buy Sell Singals📊 ForexArchitects Buy Sell Signals
ForexArchitects Buy Sell Signals is a trend-following indicator designed to identify high-probability BUY and SELL opportunities by filtering market noise and tracking sustained price direction.
The indicator uses a dynamic range-based price filter that adapts to volatility and helps traders stay aligned with the dominant trend while avoiding false signals during choppy market conditions.
🔍 How It Works
Applies dual smoothed volatility ranges (fast & slow) to create an adaptive trend filter.
Generates BUY signals when price crosses above the trend filter.
Generates SELL signals when price crosses below the trend filter.
Automatically adjusts to market volatility instead of using fixed levels.
Highlights trend direction visually using color-filled regions.
📈 Key Features
✔ Non-lagging adaptive trend filter
✔ Clear BUY / SELL labels on chart
✔ Works on Forex, Crypto, Indices, and Stocks
✔ Effective on intraday and swing timeframes
✔ Built-in alert conditions for automation
✔ Clean and uncluttered chart view
🔔 Alerts
The indicator includes ready-to-use alerts:
BUY Alert – when bullish trend confirmation occurs
SELL Alert – when bearish trend confirmation occurs
These alerts can be used for manual trading or connected to automation systems.
⚙️ Best Usage
Works best in trending markets
Combine with support & resistance, price action, or higher-timeframe confirmation
Avoid using as a standalone system in low-volatility or sideways conditions
⚠️ Disclaimer
This indicator is a decision-support tool, not a complete trading system.
Always apply proper risk management and confirm signals with additional analysis.
Anhnga 4.3 - Single Signal & MA 140 DashThis indicator, **Anhnga 4.3**, is a high-level **Multi-Timeframe (MTF) Dashboard** and **Signal Generator**. While the previous script was an execution strategy, this one is designed to give you a "command center" view of the market across different time horizons.
---
## 1. The Multi-Timeframe Dashboard
The standout feature is the table in the top-right corner. It monitors four timeframes simultaneously (Default: 1m, 5m, 15m, and 30m) and checks if the price is above or below four key Moving Averages: **20, 25, 50, and 140.**
* **Golden Status (Gold):** Triggered when the price is above all MAs, and the MAs are stacked perfectly (). This indicates a super-strong uptrend.
* **Strong Bearish (Red):** Triggered when the price is below all MAs and they are stacked negatively ().
* **Mixed (Gray):** Triggered when the trend is messy or consolidating.
---
## 2. Triangle Signal Logic
The script plots **Lime Triangles (Buy)** and **Red Triangles (Sell)** on your chart. These aren't just random signals; they require a "perfect storm" of conditions:
1. **The Momentum Dot:** First, a WaveTrend crossover must occur (a hidden "dot").
2. **The Lookback Window:** The signal only remains valid for a few bars (default: 3). If price doesn't align quickly, the signal expires.
3. **Trend Alignment:** * **For a Buy:** Price must be above the **Basis (MA 20)** AND the **MA 140**.
* **For a Sell:** Price must be below the **Basis (MA 20)** AND the **MA 140**.
4. **Single Signal Rule:** The script is coded to only show **one triangle per momentum dot**. This prevents signal spamming during choppy markets.
---
## 3. Visual "Heatmap" Zones
The background of the chart is filled with colored zones based on **Standard Deviation**:
* **Green Zones:** Upper volatility bands. When price enters here while in a bullish trend, it shows strength.
* **Red Zones:** Lower volatility bands.
* **Orange Line:** This is the **MA 140**, your "line in the sand" for the long-term trend.
---
ARVEX Context Glass ARVEX Context Glass v2.0 is a market-structure and context indicator that overlays an ATR-based channel around price and provides an optional setup grading display to support consistent evaluation of market conditions.
Display
The script can render the following elements (configurable):
• ATR-based channel (“Glass Channel”) around price
• Adaptive trend path (“Spine Line”)
• Setup windows / boxes projected forward (when enabled)
• Grade label (A+ to F) and score display (0–100)
• ATR-based stop lanes (optional)
• HUD panel showing grade, score, state (Long / Short / Flat), and stop status
Coloring can be used to visually distinguish bullish vs. bearish structure.
⸻
Intended use
This script is a context / framework tool. It is not intended to be used as a standalone entry or exit system.
Typical uses:
• filtering trade opportunities based on market context
• visualizing volatility-aware structure zones
• applying a consistent grading approach (optional)
• displaying optional ATR-based stop reference levels
⸻
Core logic (high-level overview)
The grading and context framework combines multiple independent dimensions (weighted and normalized), such as:
1. Price structure / trend flow (adaptive moving average logic)
2. Momentum assessment (comparative moving-average momentum logic)
3. Swing-structure confirmation (HH/HL vs. LH/LL interpretation)
4. Proximity to key levels (support/resistance awareness)
5. Regime classification (trend/range conditions via ADX-style logic)
These components are combined into a unified score (0–100) which can be mapped to a grade (A+ to F). All thresholds, weights, and visibility can be adjusted via inputs.
⸻
Optional setup windows
When enabled, the script can display setup windows/boxes based on the active filters and grading rules. Boxes are visual context zones and may be filtered by minimum grade.
⸻
Optional stop lanes
When enabled, the script can display ATR-based stop reference lanes that adapt to volatility and direction. These are visual references and not trade instructions.
⸻
Alerts
Alerts can be enabled for qualified long/short setup windows (subject to grade and filter settings).
⸻
Disclaimer
This script is provided for informational and educational purposes only and does not constitute financial advice, investment advice, or a recommendation to buy or sell any asset. Trading involves risk. No guarantees are made regarding outcomes. Use at your own discretion and apply appropriate risk management.


