Best scalping toolExplanation:
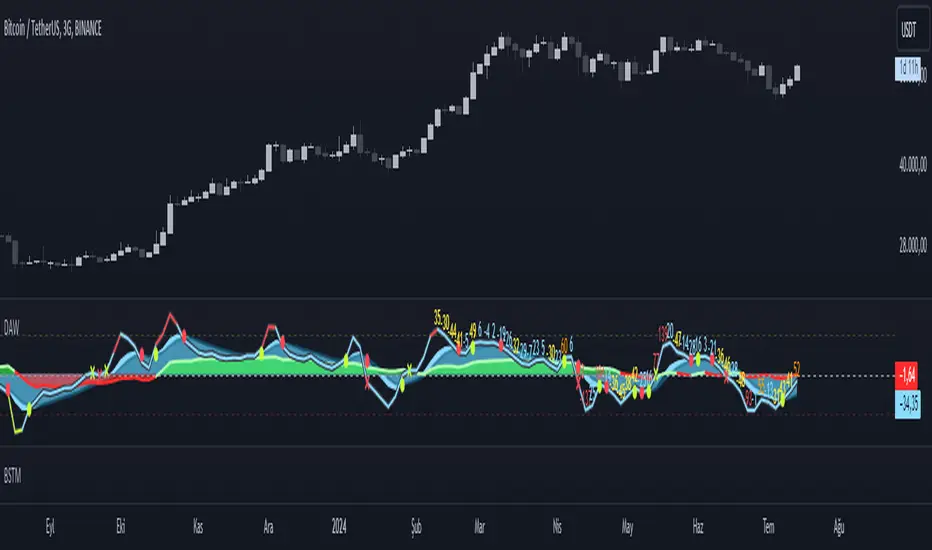
This script is a comprehensive indicator that combines three essential technical analysis tools: Money Flow Index (MFI), Relative Strength Index (RSI), and Bollinger Bands (Bollinger %B). It provides insights into market conditions related to cross points of mfi,rsi and B%B.
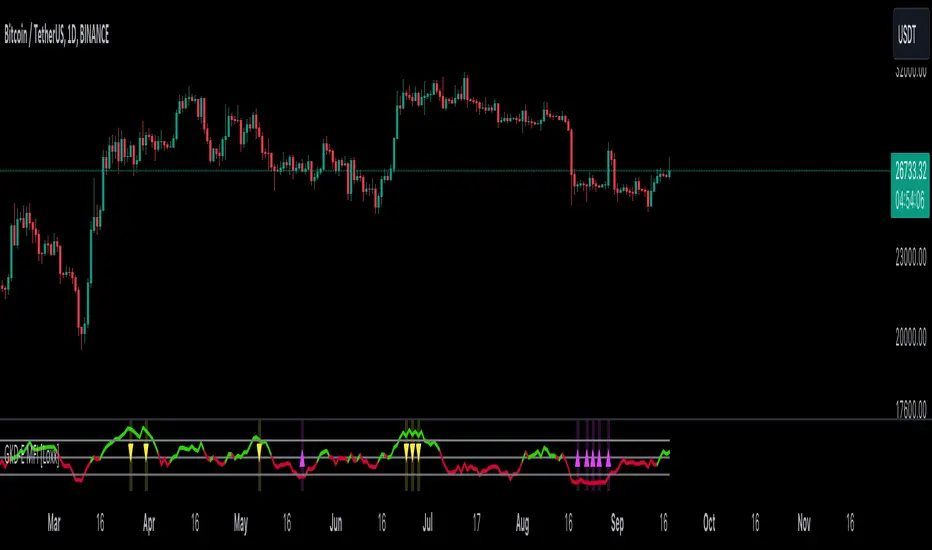
A buy condition is created when the last candle RSI and MFI are under the bollinger bands, and then in the actual candle the RSI cross up the bollinger low band.
A sell condition is created when the last candle RSI and MFI are above the bollinger bands, and then in the actual candle the RSI cross down the bollinger high band.
Key Components:
MFI (Money Flow Index):
Utilizes the MFI indicator based on a specified length.
Overbought and oversold levels (80 and 20, respectively).
RSI (Relative Strength Index): (Adapted to the mfi chart)
Allows selection of different moving average types (SMA, EMA, etc.) for the RSI calculation.
RSI along with upper and lower bands (70 and 30).
Bollinger Bands:
Provides upper and lower Bollinger Bands based on the RSI's standard deviation.
Visualization Options:
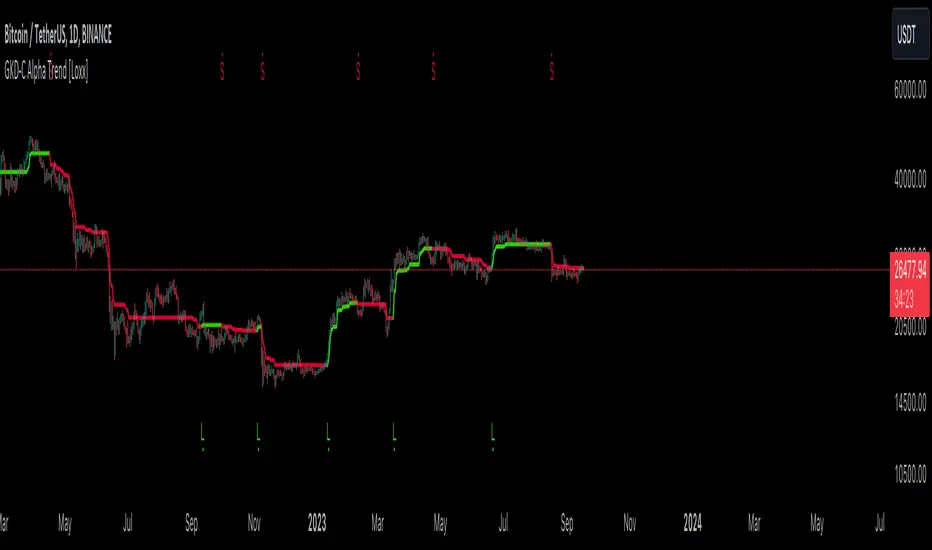
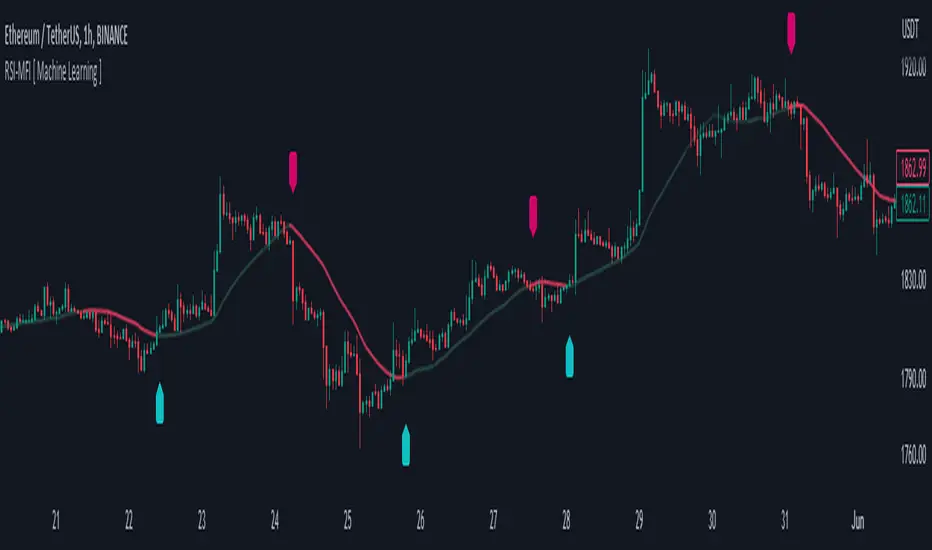
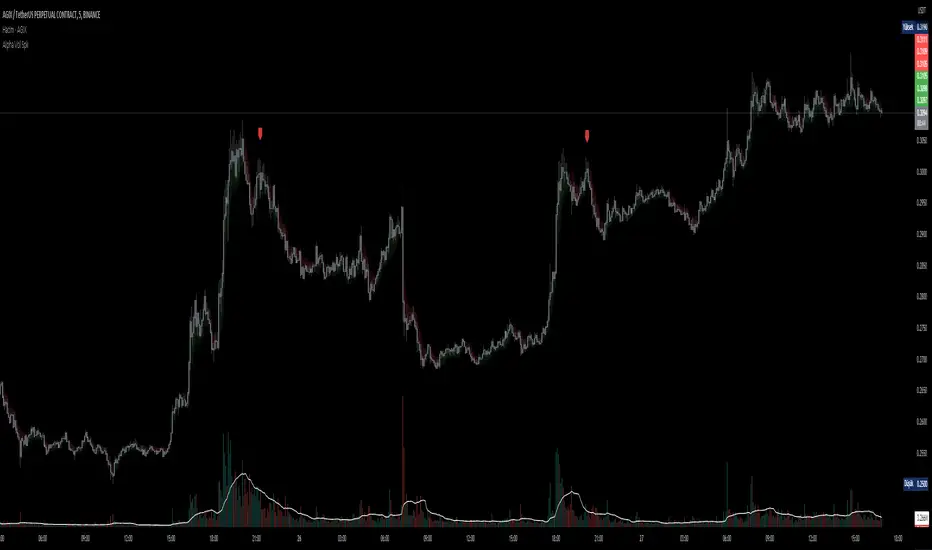
Allows the user to choose between show the buy (green arrow) and the sell (red arrow) .
How It Works:
The indicator amalgamates these three powerful technical indicators to help traders identify potential entry or exit points. The green arrow its a buy signal and the red arrow is a sell signal.
By offering configurable settings and clear visual cues, this indicator assists traders in recognizing critical market conditions and potential trading opportunities.
Disclaimer: This indicator should be used as a tool in a broader trading strategy and not solely for making trading decisions. It's recommended to combine it with other technical or fundamental analysis for comprehensive trading decisions.
อินดิเคเตอร์ Pine Script®