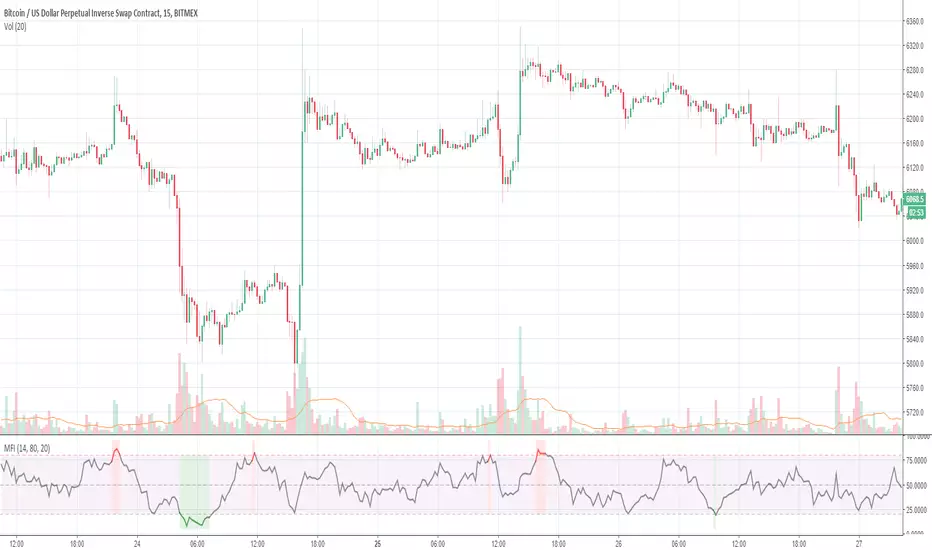
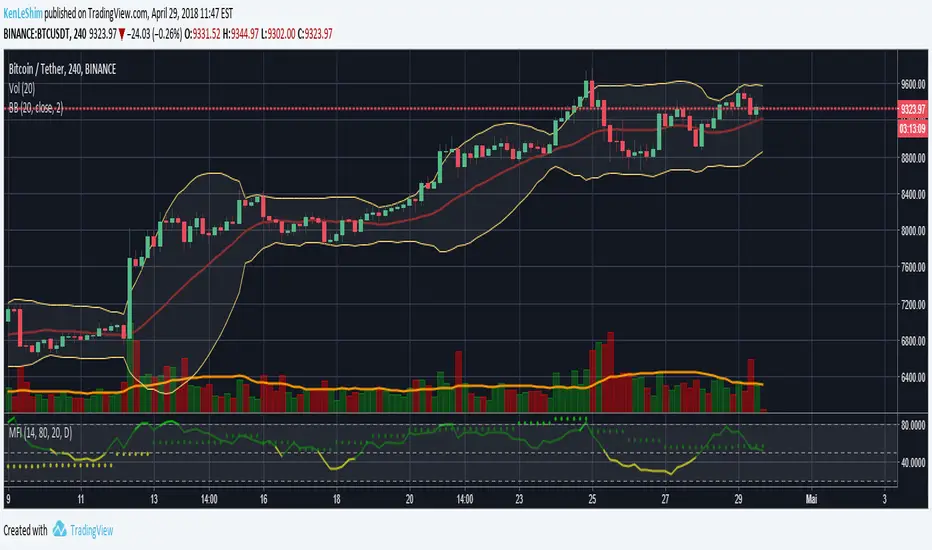
MFI with highlights when value is overbought/oversold and adjustable overbought/oversold thresholds. There is also an option to disregard candle wicks in the calculation in case that could be helpful.
RSI is an indicator that is dependent only on price. I modified RSI to factor in volume as well. On BTC chart presented above, VFRSI is more accurate than RSI in detecting extreme conditions (green line is VFRSI). In some instances, it seems to be better than RSI in detecting divergences as well (scroll to March 2018). In smaller time frames, it reduces the bart...
This study is based on the work of TV user Beasley Savage ( ) and all credit goes to them. Changes I've made: 1. Added a visual symbol of an overbought/oversold threshold cross in the form of a red/green circle, respectively. Sometimes it can be hard to see when a cross actually occurs, and if your scaling isn't set up properly you can get misleading visuals....
Strategy accompanying the study of the same name; uses RSI, StochRSI, and MFI indicators. Mix and match to find what you think could be the best entries and exits using these indicator combinations. All the switches are in the Inputs page so have fun with it. I created this primarily for crypto currencies and long positions. Perfect for users of AutoView. ...
Study using RSI, StochRSI, and MFI indicators. Mix and match to find your best entries and exits using these indicator combinations. All the switches are in the Inputs page so have fun with it. Alert setups are easy. I created this primarily for crypto currencies and long positions. Perfect for users of AutoView. Backtest component by @pbergden...
Study using RSI, StochRSI, and MFI indicators. Mix and match to find what you think could be the best entries and exits using these indicator combinations. All the switches are in the Inputs page so have fun with it. Alert setups are easy. I created this primarily for crypto currencies and long positions. Perfect for users of AutoView. Alert conditions are...
The Money Flow Index (MFI) is an oscillating momentum and market strength indicator that was developed by Gene Quong and Avrum Soudack. It is also a leading indicator, which means it tends to lead price action, and is similar in calculation as J. Welles Wilder's Relative Strength Index (RSI) with the significant difference being that the MFI uses both price and...
I allowed myself to take a piece of code of one of the indicators MFI present on Tradingview for the added to a RSI! I made this srcipt to avoid cluttering the screen, so we can see the oversold / overbought of the MFI without having any additional indicator
The Money Flow Index indicator (MFI) is a tool used in technical analysis for measuring buying and selling pressure. This is done through analyzing both price and volume. The MFI's calculation generates a value that is then plotted as a line that moves within a range of 0-100, making it an oscillator. When the MFI rises, this indicates an increase in buying...
Just like the standard Stochastic RSI, this is a MFI(Money Flow) version. The MFI is a Volume Weighted RSI and so this indicator will give that dimension to your technical analysis. It also includes a "midway" line that can be altered if need be. // Created 2018 - by @Squiggles#8806 // LTC Tip Jar: LX4bUBdjiRPsagUbZoAczSGgDC4YqTJL7w
This is a very simple indicator for quickly spotting points of momentum exhaustion and potential trend reversal. It is NOT a Buy or Sell signal. Instead, it tries to isolate periods of maximum risk and maximum opportunity. Internally, it combines the RSI and MFI indicators to reduce noise and provide more accurate signals.
This indicator is a combination of Money Flow Volume with an Exponential Moving Average of the MFV and a Standard Deviation. The default setup is better suited for the 1H timeframe. The indicator shows Money Flow Volumes in bars positive and negative, an area which is the EMA of MFV of (20 default) periods, and the STDEV of that EMA (2 default multiplier/factor),...
This is a hybrid of both the RSI and MFI indicators. Includes options to show coloured alert bars when threshold limits are reached. Includes: RSI indicator - yellow line MFI indicator - green line Customisable limits include: Top threshold - 80 Upper limit - 70 Middle line - 50 Lower limit - 30 Bottom limit - 20
This is a Hybrid of the RSI and MFI indicators. It also shows coloured alerts when extreme conditions are met.
Take on LazyBear's SB_RSI/MFI with Volatility Indicator. The original indicator is coupled with the Bollinger Band strategy. Original Idea: Wanted to test the indicator with bbstrategy. Message if you think of any modifications/ enhancements/ any opportunities. :) Donations/Tips... :) - BTC: 1BjswGcRR6c23pka7qh5t5k56j46cuyyy2 ETH:...