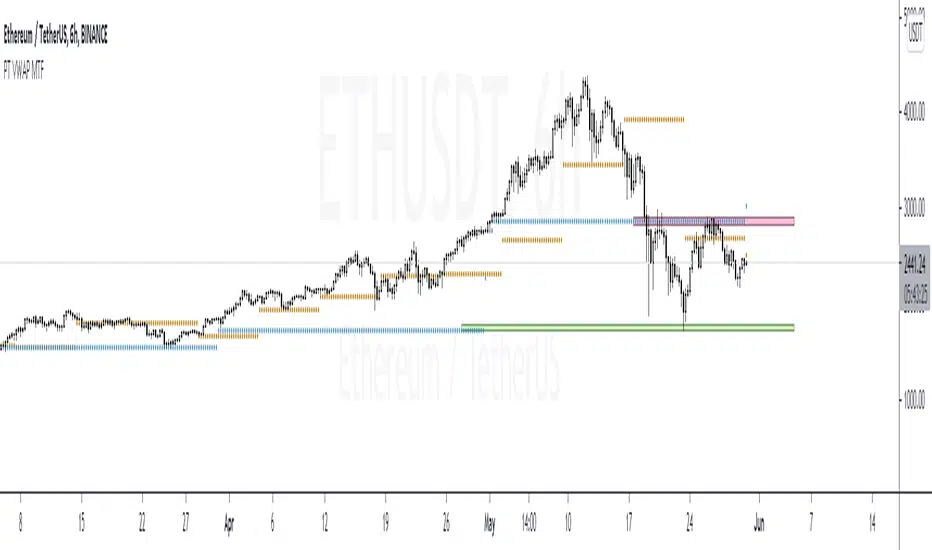
PT VWAP MTFVersion 1.0 -
A Multi Timeframe - Daily, Weekly, Monthly VWAP. Also added a feature for previous day, Daily, Weekly, Monthly VWAP .
The main strategy to this indicator is the previous day vwaps. So we put in additional logic that allows us to visually see previous day, previous week and previous monthly vwap. This helps us get a gage of bullish vs bearish trends. For instance, if price is trading above both daily and previous daily vwaps, that signifies micro trend is bullish. If price is above daily vwap but below previous daily vwap, you can use the previous day vwap as a target for you long.
If you are interested in using our version of the MTF vwap, shoot us a message!
Volume Weighted Average Price (VWAP)
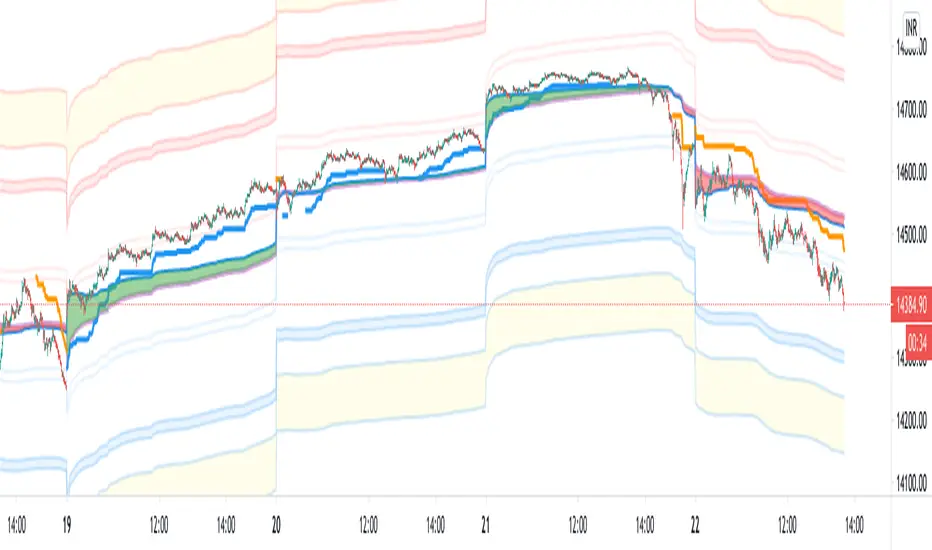
Intraday VWAP weighted averaged KAMA BandsFor Intraday trading!
This indicator helps in figuring out the directivity as well as optimum entry criteria in an Intraday Trade
Most of the times in market,
it makes a good sense for any trader to have a particular bias, the indicator helps provide biases with the potential target bands
Explore it and come up with your own explanation! The indicator is self intuitive
Buy when Blue price tracker line appears
Sell when Orange price tracker line appears
Target the just next band line! or Pivot
Which timeframes it works best ?
It is designed for 1 minute
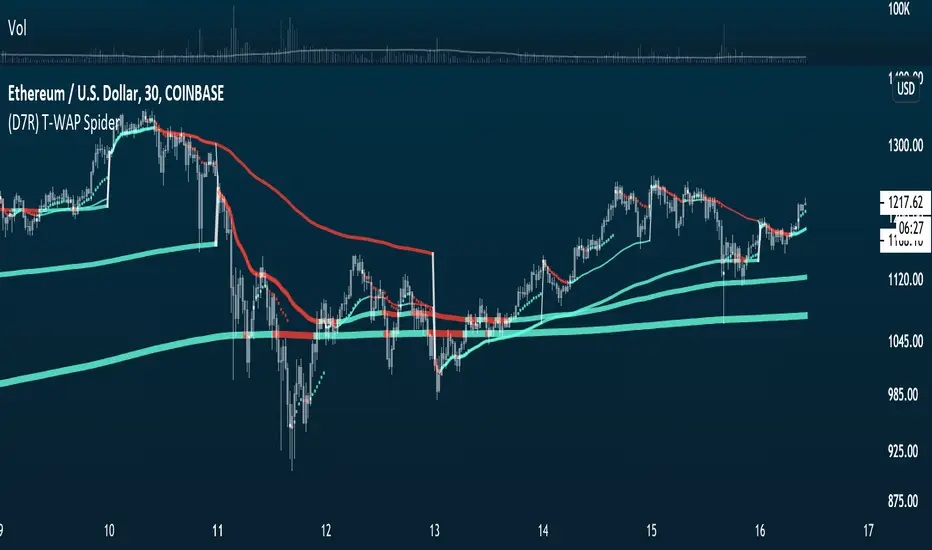
(D7R) T-WAP SpiderT-WAP spider is a simple script to gather most important T-WAP levels often used by algos and intraday traders to track mean reversion and high probability Support & Resistances.
The lines will chance color depending on price placement above or bellow.
Traders can use this to gauge over or under extension from the mean and identify RR opportunities within intraday with these levels mapped out.
There is an option to also turn on Volume (V-WAP)
VWAP with Standard Deviation BandsVolume Weighted Average Price (VWAP), with Standard Deviation Bands
VWAP is a moving average with weighting for traded volume, so heavier trading activity has a greater impact on its direction. Low volume periods will move the VWAP less than high volume periods.
The VWAP is important because institutional investors often use it to determine what is ‘fair value’. You can often see the market reacting when it gets close to the VWAP.
This version is time segmented VWAP. It reset ma values when selected time period expires.
Time periods are able to be selected in the settings: "1D", "2D", "W", "14D", "M", "60D", "12M", "24M", "Custom".
Additionally script determines VWAP standard deviations.
Multipliers for VWAP Standard Deviation Bands can be changed in the settings.
There is also option to show previous VWAP and its Standard Deviation Bands before timeframe reset.

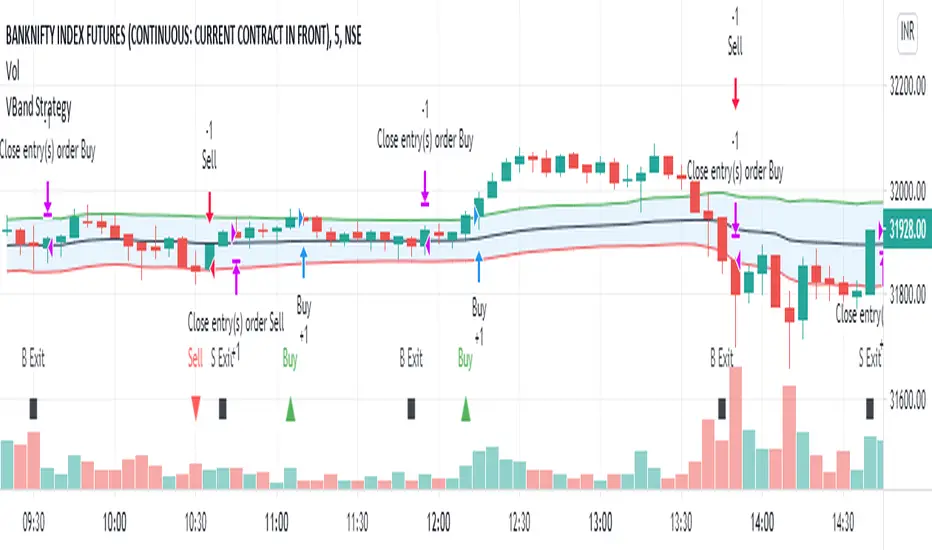
VBand StrategyVBand Strategy is simply used Vwap funcation and atr 14 for find the entry and exit points. This simple Strategy.
Scalping Strategy with SL and TP activation settingsThis strategy can be used on pretty much every timeframe that gives you a satisfying performance and will give you entries with a high probability of a winning trade.
Recommended are lower timeframes, because after all this is a scalping strategy and with that your chart wont be cluttered.
How to use this script?
Currently you can setup your positions SL and TP, because the markets vary in volatility it could improve the performance of the strategy.
You will simply get your signals and can decide to act upon them.
Stop loss: Simply your stop loss order which will trigger when price moves a given % away from your entry.
TP-Activation: When price reaches your % target it will trigger a stop limit order. So if price turns against your position after reaching your target it will close your position in profit and if it runs in your favoured direction it will trigger at a later stage.
Trailing-Offset-%: After reaching your % target it will trigger the TP order with an offset. So if you set your trailing offset to 0.1%, your TP order will be set behind 0.1 %. This can be used to test if the strategy would perform as well
if you leave more room for trades to play out.
Will this script make me profitable?
No strategy is a silver bullet and it depends mostly on you.
Trading is not easy and most people fail, because their risk management skills arent solid or they cant control their emotions.
This script will give you statistically often good entries, so even if you hit a losing streak your SL will protect you from losing more than necessary until you get a winning streak.
Patience and consistency is key to be profitable in the long run.
Does the script repaint?
Although you will get a notification when setting an alarm that the indicator may repaint, no security function is used and the signals will stay on the chart, because the signal is calculated based on the last candle close and will trigger with the next candle.
I am still looking into why that notification pops up.
You are free to try the indicator for a limited time to be sure.
My experience with the strategy
The overall statistical advantage is great. The strategy can be used simply as it is, but becomes better if you already have some experience with trading. Sometimes it will give you a good entry, reaches your target and the price still goes in your preferred direction. So your trading returns and experience could be improved with confluence, but it is totally fine as it is and if used right will help you get going.
Disclaimer: This is no financial advice. This is a tool and I am not responsible for your actions.
If you are interested in the indicator feel free to dm me on TradingView.

|AG| VWAP ANALYSIS|AG| VWAP ANALYSIS
The volume-weighted average price (VWAP) is a trading benchmark used by traders that gives the average price security has traded throughout the day, based on both volume and price.
It is important because it provides traders with insight into both the trend and value of the security.
VWAP is calculated by adding up the $ traded for every transaction (price multiplied by the number of shares traded) and then dividing by the total shares traded.
A detailed formula and calculations could be found here:
-> fanf2.user.srcf.net
Actually, TradingView has an option for Anchored Vwap is a really good implementation for specific analysis.
The following script takes into account the #Time_Period_Change and plots the VWAP calculation.
The #Time_Period Available for this script are:
-> Day
-> Week
-> Monthly
-> Quarter
-> Year
1. The option that we have is the SOURCE:
-> HLC3 (High, Low, Close)/3 is the right way to calculate VWAP.
-> But I included other traditional options:
-> open, high, low, close, hl2, hlc3, ohlc4
2. The option of Turn ON/OFF VWAP
-> Timeframe selection:
-> All, 1. Day, 2. Week, 3. Month, 4. Quarter, 5. Year, 6. >=Weekly, 7. >=Montlhy
-> With this, we could select the time for plotting the VWAP. And some cool features such as >= that we are going to plot different Timeframes VWAP calculations.
-> Vwap Label:
-> We could select if show labels or not
3. The option of Turn ON/OFF Previous VWAP Level
-> VWAP of one selected Time Period is going to end with a final price this level most of the time is retested and gives us a good opportunity for entry into one trade.
Or could be used as Stop Loss.
-> Timeframe selection:
-> 1. Day, 2. Week, 3. Month, 4. Quarter, 5. Year, 6. >=Weekly, 7. >=Montlhy, 8. >=Daily
-> Factor
-> The factor options lead as increment the extension of the previous time period.
-> Example: D is the normal time period and with factor, we change from 1D to 2D in order to extend previous levels of VWAP.
->The Factor option is only available in 1. Day and 2. Week. With a Min Value of 1 and a Maximum Value of 50.
-> Labels:
-> We could select if show labels or not
4. The option of Turn ON/OFF Standard Deviation Bands
-> Label:
-> We could select if show labels or not
-> Timeframe selection:
-> 1. Day, 2. Week, 3. Month, 4. Quarter, 5. Year
5. The option of Turn ON/OFF Previous Standard Deviation
-> Timeframe selection:
-> None, 1. Day, 2. Week, 3. Month, 4. Quarter, 5. Year, 6. >=Weekly, 7. >=Montlhy, 8. Quarter & Year
-> STDEV LEVEL
-> Since there are different options for Standard Deviation I included 4 options
-> 1
-> 2
-> 3
-> User Selection
-> In this option we could select any NUMBER for STVDEV 0.25 of step.
-> Label:
-> We could select if show labels or not
6. The Lockback Setting
-> This Script also includes an option to only plot a certain amount of days back.
The main reason in order to have a more clear chart.
-> We could select between:
-> PLOT ALL
-> CUSTOM
-> If we select Custom Then we could select the Number of Days Back that is going to be plotted.
7. Color Theme
Here we select the color (Visual Desing)
-> Color Theme
-> Text Color
-> Here I use the recent input.color option added for TradingView making the color selection really simple
8. Time Period Highlighter
-> In this option, we could select one time period in order to plot one tiny background and identify the change in the time period.
-> Timeframe selection:
-> 1. Day, 2. Week, 3. Month, 4. Quarter, 5. Year
9. Label Offset
-> Finally, this option leads us to change the position of the labels into the X-axis by default 20.
This script has many options the combinations and the possibilities of making different analyses are bast.
Here some examples of what we could make:
DEFAULT SETTING:
PREVIOUS VWAP FOR TIME PERIOD >= WEEK
(work good as S&D levels)
PREVIOUS VWAP Week WITH A FACTOR OF 4
STANDARD DEVIATION BANDS - DAY
STANDARD DEVIATION BANDS - WEEK
STANDARD DEVIATION BANDS - MONTH
STANDARD DEVIATION BANDS - QUARTER
STANDARD DEVIATION BANDS - YEAR
PREVIOUS STANDARD DEVIATION - DAY SDTV 3
PREVIOUS STANDARD DEVIATION - WEEK SDTV 3
USING STANDARD DEVIATION BANDS - WEEK
WITH LOCKBACK -> PLOT ALL
WITH CUSTOM 30 DAYS
I think the options possibilities of analysis using #VWAP are truly awesome.
I like the relationship that one previous VWAP has with Standard Pivot Points.
Good Luck,
Anderson,


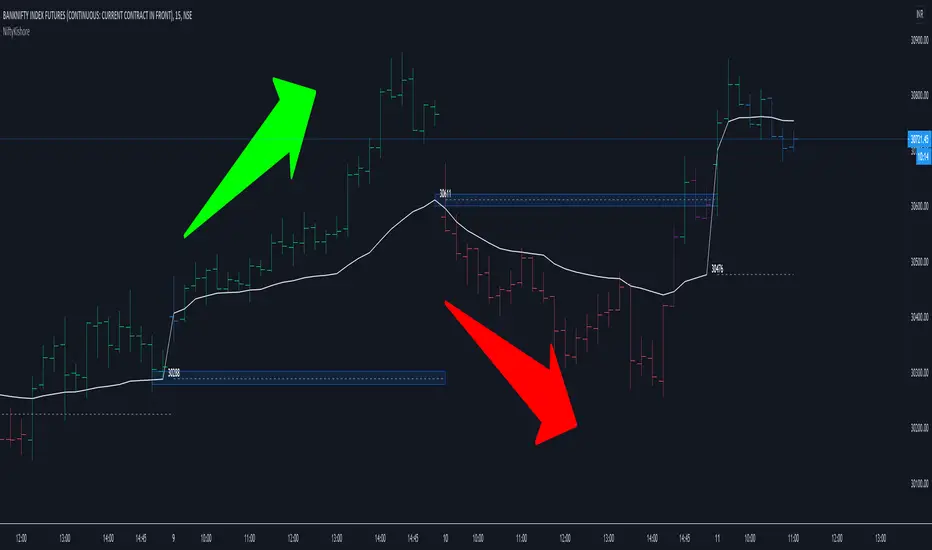
Vwap Pvwap Intraday Trend - NiftyKishoreHello Traders !!
This is a simple trend identification script which is based on the current vwap (Cvwap) and previous vwap (Pvwap).
Pvwap in the sense; previous day vwap closing value.
Bullish: price is closing above the current day vwap and previous day vwap(pvwap).
Bearish : Price is closing below the current day vwap and previous day vwap (pvwap).
Made a change to the barcolors as well :)
Bullish
Green Bar: close is above Pvwap and Cvwap.
Blue bar: close is above Pvwap but below Cwap.
Bearish
Red bar: close is below Pvwap and Cvwap.
Purple bar: close is below Pvwap but above Cvwap.
Simple but effective
Cheers !!
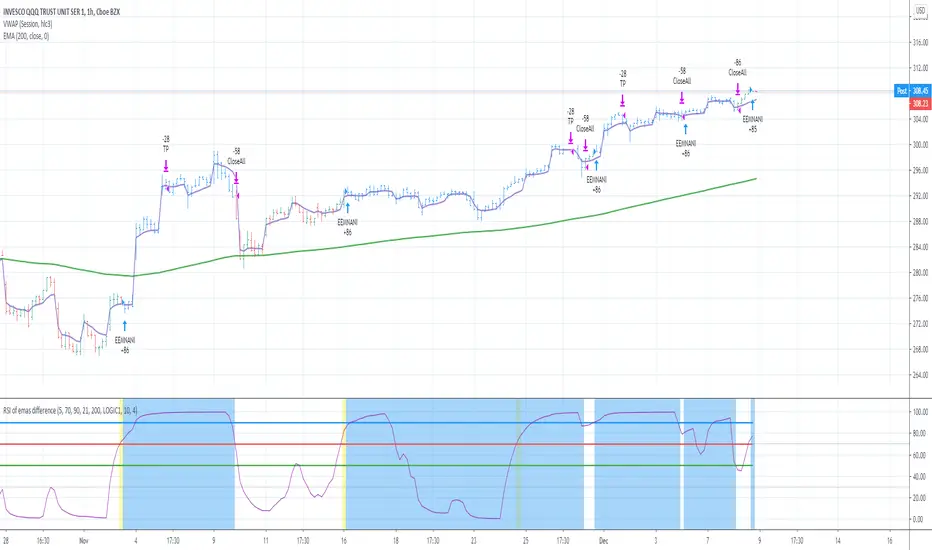
RSI of emas difference [ EEMANI ]This strategy is found by error.
Initially I started to find the weekly version of RSIofVWAP strategy. somehow I didn't see good results. Then , on the same script I did change it to find rsi emas difference strategy.
while changing the code , for the long term ema /slow ema input , I had entered fastema value instead of the price close. That is the error.
But strategy showed good results , then I extended it to add stop loss and take profits. Since this is found by error, I cant explain much how it is working.
Please check if your symbol works with this strategy and let me know ... your feedback is greatly appreciated to improve the strategy ...
I name it as EEMANI strategy
BUY
======
When the RSIofEMAsdiff is crossing above 70 (buy Line) and fastEma is rising
Note:
On the indicator it shows yellow background ... thats the entry point ....
when strategy is already in Long position , if you see yellow back ground thats where you can add or enter if you missed earlier signal
background and bar color color changes to blue when strategy is in Long position
Partial Exit
=========
when RSI value reaches 99 , 1/3 of the position si closed with profit
Close
======
when RSI value crossing down 90 (exitLine)
Stop Loss
=========
defaulted to 4% (increasing this value might improve the performance , but number of bars will go high , that means you need to wait longer time to get out of the trade ... Thats boring !!!
Note :
I have added two formulas , both of them are produce similar results. But different equities on different logic. check which formula is working for you
LOGIC1 => fastEMAval-slowEMAval
LOGIC2 => (slowEMAval+fastEMAval)/weeklyVwap
Warning
=========
For the use of educational purposes only
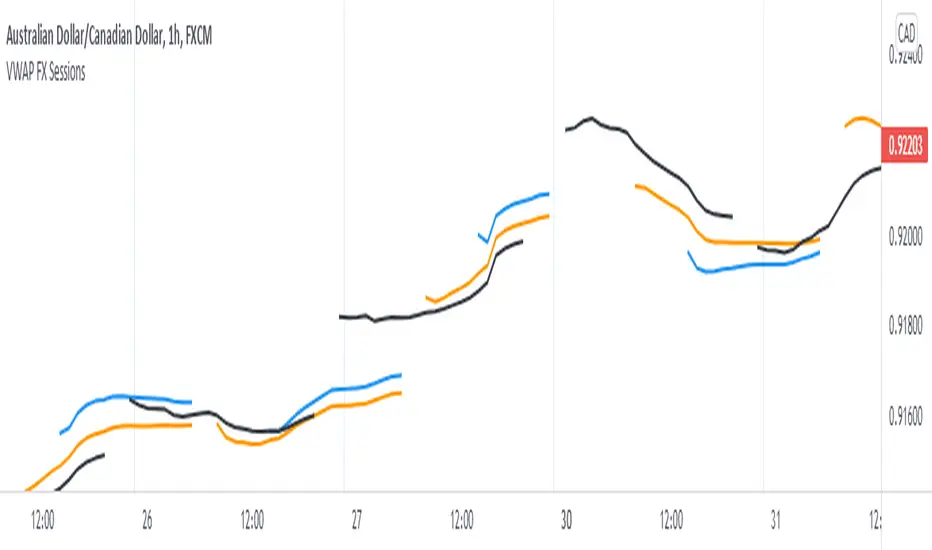
Triple VWAP for FOREX SessionsThis script runs on my previous script Masterwork VWAP .
►It uses regular built-in VWAP improved to avoid weird connecting of the line with its yesterday's value.
►It starts a new VWAP when London session opens . You can select to end it next morning or when the session is about to close.
►It starts a new VWAP when New York session opens . You can select to end it next morning or when the session is about to close.
►You can select intelligent_enabler function to plot the VWAPs on your chart when viewing low timeframe charts (1m, 5m, 15m, 30m)
VWAP_X_EMAVWAP and EMA 50 combo indicators
Long : if the close is above the VWAP and EMA
Short : Viceversa

BBofVWAP with entry at Pivot PointThis strategy uses BB of VWAP and Pivot point to enter and exit the Long position.
settings
BB length 50
BB Source VWAP
Entry
When VWAP crossing up BB midline and price/close is above weekly PivotPoint ( you can also use Daily pivot point )
Exit
When VWAP is crossing down BB lower band
Stop Loss
Stop loss defaulted to 5%
Note : Long will position will be exited on either VWAP crossing down BB lower band or stop loss is hit - whichever comes first . Being said that some time your stop loss exit is less than 5% which saves from more losses.
Entry is based on weekly Pivot point , so any time frame below weekly will work perfect. I have tested t on 30 min , 1 HR , 4 Hr , Daily charts. Even weekly setting shows good results , that will work for long term investing style.
if you change Pivot period to Daily , chose time frames below Daily.
I also noticed this strategy mostly do not enter Long position in a down trend. Even it finds one , it will be exited with minimal loss.
Warning
For the use of educational purposes only

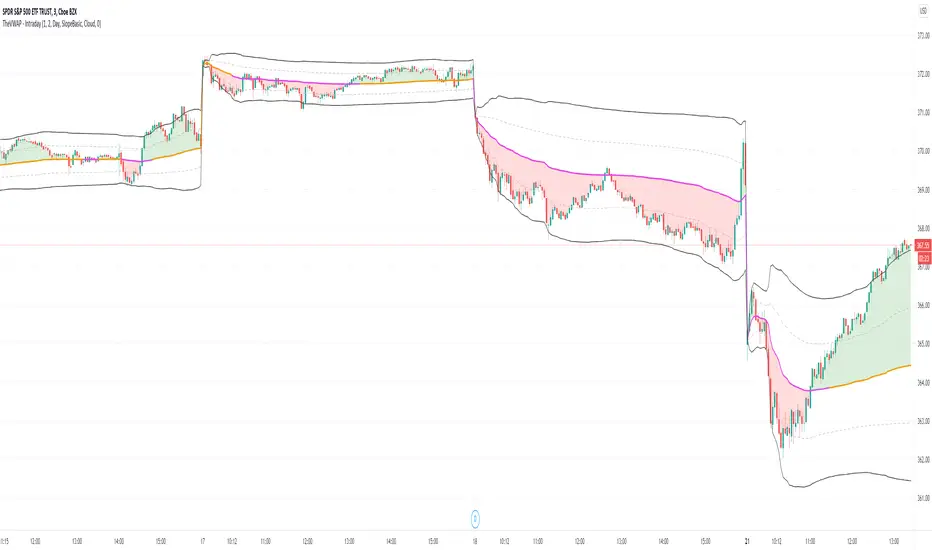
TheVWAP - IntradayOur custom intraday VWAP study, which includes a typical "market open to market close" VWAP , standard deviation bands and color-coding to reflect the market’s current position and slope. This can be applied to a Day, Week or Month timeframe.
This is the backbone of our intraday strategy, as it reveals areas of support and resistance that would otherwise remain hidden and highlights them through custom colorization.
Inputs include standard deviation values, time frame, VWAP color, background color signal, tolerance band width, and the ability to turn on a color-coded deviation signal.
Use the link below to obtain access to this indicator and to learn more.
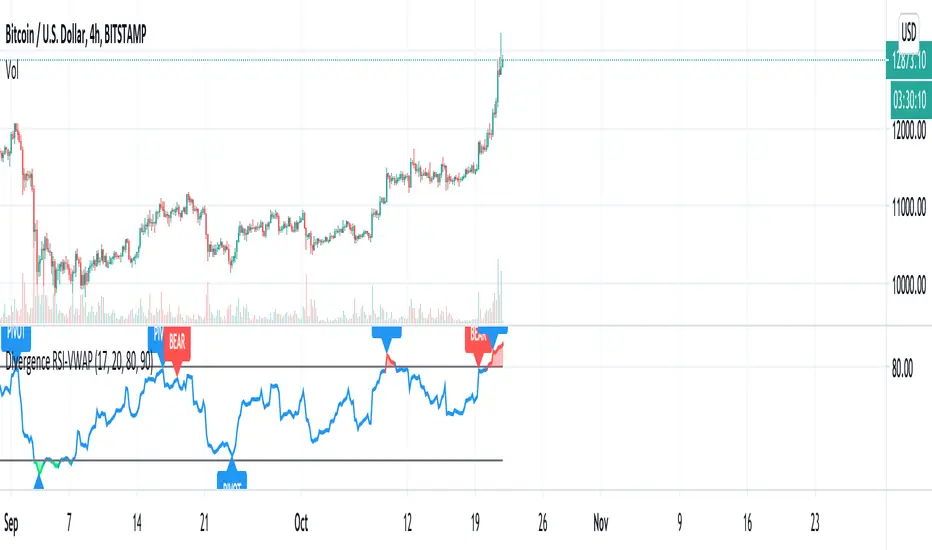
EOD re-entriesThis indicator is designed to compliment another of my trading scripts which gives signals for long-term trends on the daily chart. Here, I'm using the same daily 50 and 200MAs, but projecting them on the 4 hour chart to potentially catch faster trade re-entry points.
There are built in alerts for the following:
- Long: The price closed above the daily 50 MA while the 4 hour VWAP is above the MVWAP
- Long: The price closed above the daily 200 MA while the 4 hour VWAP is above the MVWAP
- Short: The price closed below the daily 50 MA while the 4 hour VWAP is below the MVWAP
- Short: The price closed below the daily 200 MA while the 4 hour VWAP is below the MVWAP
- VWAP long re-entry (large green triangle): The price closes above the VWAP and both the 50 & 200 MAs
- VWAP short re-entry (large red triangle): The price closes below the VWAP and both the 50 & 200 MAs
- EMA long re-entry (small green triangle): 4 EMAs of your choosing are fanning out above the 50 & 200 MAs when the price is above VWAP
- EMA short re-entry (small red triangle): 4 EMAs of your choosing are fanning out below the 50 & 200 MAs when the price is below VWAP
All of the above are filtered against stochastic RSI and numerous other oscillators to reinforce the signals.
This is a private script. Please DM me for access.

TheVWAP - AspectAspect measures any one of three critical VWAP elements —
1) Position: price distance from VWAP in standard deviations as a subgraph indicator
2) Slope: rate of change of VWAP to detect incrementally rising (or waning) directional aggression
3) Deviation Size: using VWAP standard deviation bands as a proxy for expected range, comparing current volatility to historical (‘typical’) volatility as a ratio
Aspect is most effective when paired with an intraday VWAP and is all about confirmation — telling you that ‘position’ is diverging from price, that slope is intensifying (or decaying), or that volatility is normal or abnormal.
Inputs include aspect type, slope length, sensitivity type or custom sensitivity input, and threshold.
Use the link below to obtain access to this indicator.

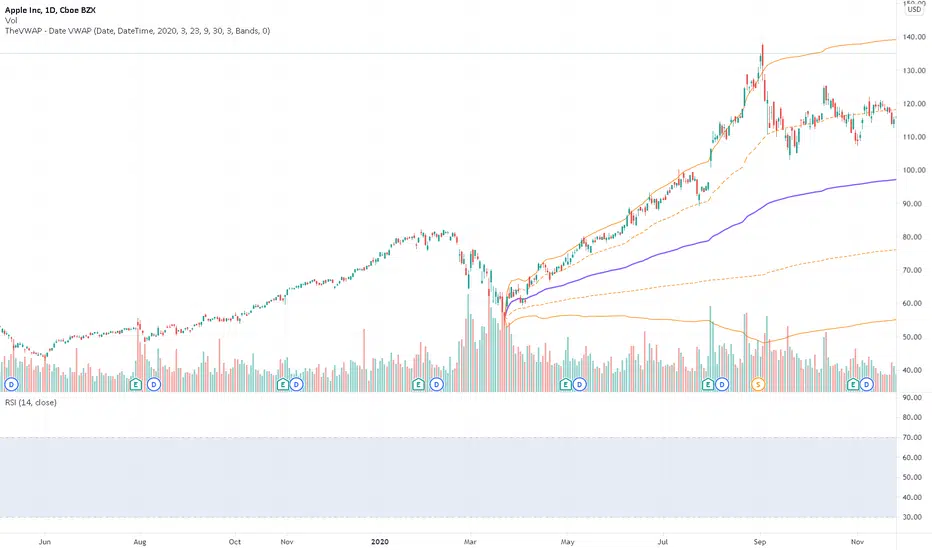
TheVWAP - DateVWAPDateVWAP gives traders the power to launch a volume-weighted average price and standard deviation bands from any user-input date. Anchor VWAPs to specific fixed dates and times (YYYYMMDD HHMM format) or, with the ‘DaysAgo’ setting, enable a recurring/rolling average that updates as new days elapse — for example, VWAP over the last five trading days.
This study allows traders to quickly gauge the average price since any date visible on the current chart, whether daily or intraday, with additional options to automatically identify — and launch VWAPs from — daily highs or lows. As such, multiple copies of this indicator can be layered on the same chart with distinct colorization for clarity.
Inputs include Date Method, VWAP Type, Start year/month/day/hour/minute, and whether or not to show deviation bands.
Use the link below to obtain access to this indicator.
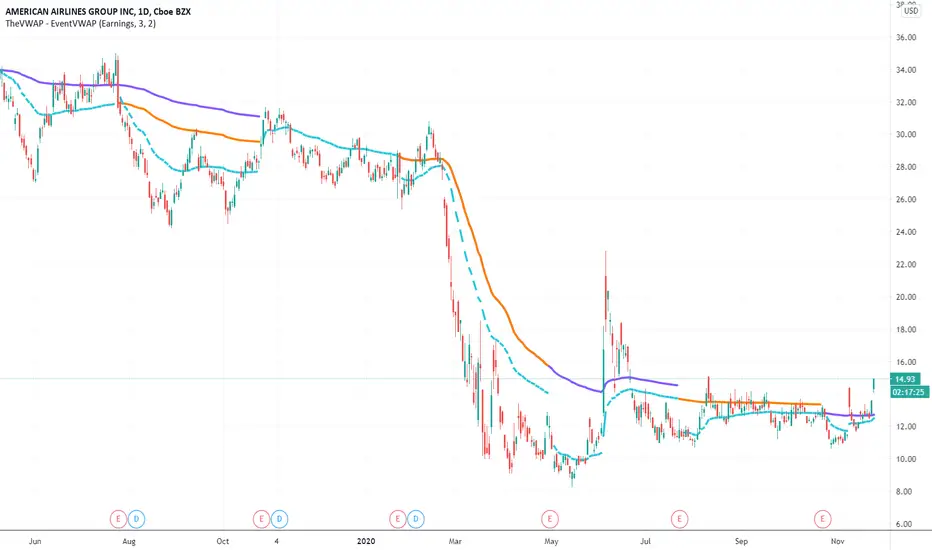
TheVWAP - EventVWAPRequiring no date input from the user, EventVWAP automatically launches custom-dated VWAPs from relevant events — earnings and user-defined gaps — to detect longer-term thematic support and resistance. Works on both intraday and daily charts and includes user-specified thresholds for detection of launch events, such as the minimum gap % required to qualify.
Inputs include the number of VWAPs (up to four), the line style, custom color selection and which event type to use.
Use the link below to obtain access to this indicator.
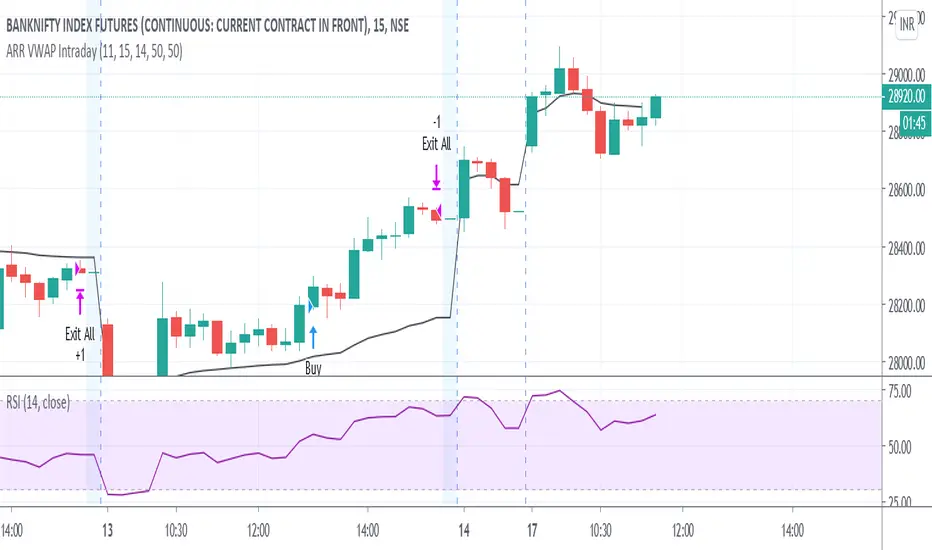
ARR VWAP IntradayIntra day VWAP Strategy
Strategy is
Buy when vwap goes up and RSI above 50 (Can be modified) .
Sell wehn vwap goes down and rsi bellow 50 (Can be modified)
Exit all at market close hour specified
GOJWH Balance Of ForceBOF ( Balance Of Force )
The BOF is a centred overlay indicator based on trading volume.
This is overlays "SRI" on the chart and works with it.
- You can understand the flow of volume, and you can see over-buying and over-selling at a glance.
- For channels, the Bollinger Bands and Keltner Channels and Chandelier Exit Strategy were used in combination.
- Trend Cloud is a value that overlays the position on the oscillator of the current price compared to the high and low prices in a chart, showing support and resistance, and also shows the trend.
- Centered Line is marked using a formula based on the open price of 52 candles, and when the closing price exceeds or falls below it, the momentum at that moment is confirmed.
- #1, 2 Support/Resistance play the same role as the trend cloud, but make a difference in resolution.
- "The lagging span" is omitted because there are many explanations on the Internet.

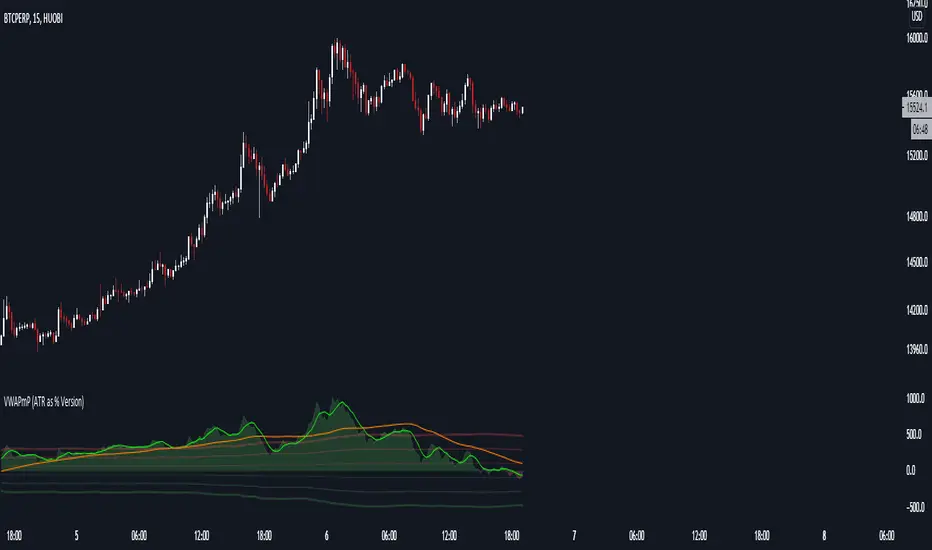
VWAPmP (ATR as % Version)This indicator displays a histogram for the distance of closing price from a VWAP value. The VWAP length is rolling and its value is user defined. Additionally, there are 3 bands which are based on the %-value of the underlying ATR. The ATR's length can be chosen by the user, and the distance multipliers may also be chosen. Lastly, there are two simple moving averages which have user-defined lengths and are based on the histograms value.
BANKNIFTY - Anchored VWAP
An attempt to make Anchored VWAP for NSE:BANKNIFTY from Volume of underlying securities.
Notes :
- To cross check one may verify by changing Symbol to any stock and use in-built VWAP indicator
- Works only with BANKNIFTY and stocks. Does not work with other NSE Indices

Divergence RSI-VWAPCombination of the script from XaviZ of RSI-VWAP and divergence detector from Libertus.