Cumulative Volume Price (Candle Body, High-Low)Indicator Description: Cumulative Volume Price (Candle Body, High Low)
This indicator features three cumulative plots that continuously accumulate values over time.
Cumulative Volume Plot:
The first plot displays the cumulative volume, calculated by continuously adding the volume values from zero.
Cumulative Candle Body Width Plot:
The second plot displays the cumulative width of the candle bodies, obtained by continuously adding the actual body widths from zero.
Cumulative Candle High-Low Width Plot:
The third plot displays the cumulative width of the candle high-low ranges, calculated by continuously adding the widths between the high and low prices from zero.
Usage Guidelines:
Due to the different orders of magnitude in value range used for volume and candlesticks, it is advisable to typically select and display any single plot.
説明
このインジケーターは、時間の経過とともに値を累積し続ける3つのプロットを備えています。
累積ボリューム:
ボリュームの値をゼロから累積的に加算しています。
ローソク足の累積実体幅:
ローソク足の実体幅の値をゼロから累積的に加算しています。
ローソク足の累積高安幅:
ローソク足の高安の幅の値をゼロから累積的に表示しています。
使用ガイドライン:
ボリュームとローソク足で使用する数値のオーダーが異なるため、通常は任意の一本を選択して表示することを想定しています。
Volume Indicator

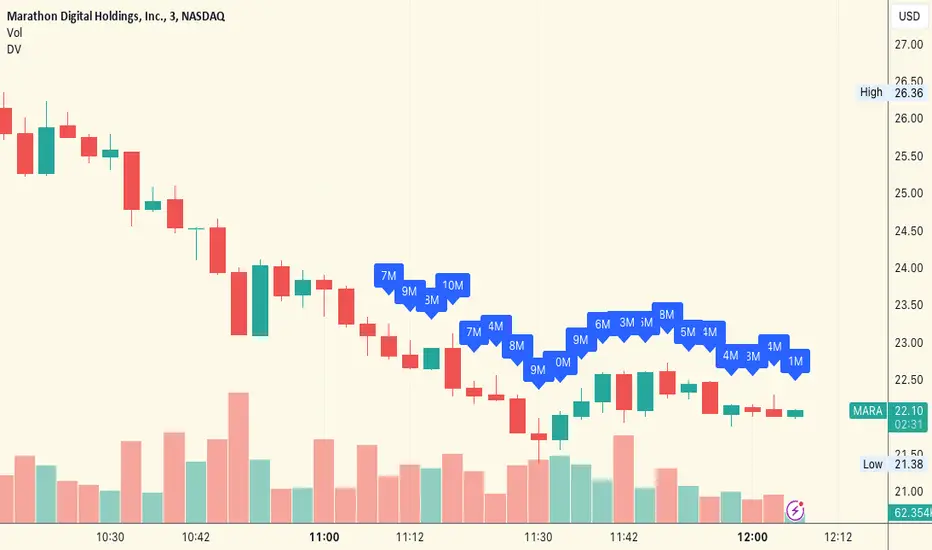
Dollar Volume Last 20 CandlesThe "Dollar Volume Last 20 Candles" indicator, abbreviated as "DV", is a practical and insightful tool for traders and analysts.
This indicator focuses on enhancing the visualization of trading data by calculating and displaying the dollar volume for each of the last 20 bars on a financial chart. It achieves this by multiplying the closing price of each bar with its trading volume, providing a clear dollar value of the trading activity.
The script also features an intuitive formatting system that simplifies large numbers into 'k' (thousands) and 'M' (millions), making the data easily digestible.
The dollar volume data is displayed directly above each bar, adjusted for visibility using the Average True Range (ATR), ensuring that it is both unobtrusive and readily accessible. This overlay feature integrates seamlessly with the existing chart, offering traders a quick and efficient way to assess monetary trading volume at a glance, which is particularly useful for identifying trends and market strength.
Split VolumeThe Split Volume indicator displays 'Upwards' and 'Downwards' volume with an additional method for distributing 'split' candle volume.
A 'split' candle is a candle whose direction is...'Split'...since the open and close are equal. (Ex. Doji)
Upwards and Downwards Volume is tracked by comparing the Open and Closes of the Lower Timeframes.
If the Close is Greater-than the Open, we track the Volume as 'Upwards' Volume.
If the Close is Less-than the Open, we track the Volume as 'Downwards' Volume.
If the Close and Open are Equal, we assume that the Volume is an even split 50/50, and track it as such.
The indicator pulls data from lower timeframes to achieve more granular Open,Close,& Volume Data
Specifically:
<5m Timeframe: 1 Second LTF
<60m Timeframe: 5 Second LTF
<1D Timeframe: 1 Minute LTF
>1D Timeframe: 60m LTF
We have also included some nice-to-have features
50% Volume Line: This line splits each columns in half, this is used as quick reference to see exactly which side the volume is on.
High Volume Candle Identification: We are detecting bars with high relative volume and coloring them on the upper chart for use as important zones.
Status Line Readouts: The Status line for this indicator is formatted for simple reading. It Reads(Left-to-Right):Total Volume, Downwards Volume, 50% Value, Upwards Volume

Saty Volume StackBreaks volume into buy and sell volume and stacks them based on which side has higher volume.
Dynamic Buy / Sell Stack
Unlike other buy/sell volume indicators, which statically display this information (typically green over red), this indicator dynamically stacks the higher volume side on top. For example, green over red indicates more buy-side volume, red over green indicators more sell-side volume.
Current Candle Volume Buy/Sell %
A label shows the % buy vs sell volume for the current candle in real-time. This label is also dynamic with the left position being higher volume.
How the Buy/Sell Volume is Calculated
Buy/Sell % is calculated based on price.
Buy % is calculated using the distance between the low of the candle to the closing value of the candle and dividing that by the total range of the candle high to low.
Sell % is calculated using the distance between the high of the candle to the closing value of the candle and dividing that by the total range of the candle high to low.
Please note this is a proxy metric and while it is incredibly useful, it is not going to match up exactly with actual buy/sell volume that can be found on tape.

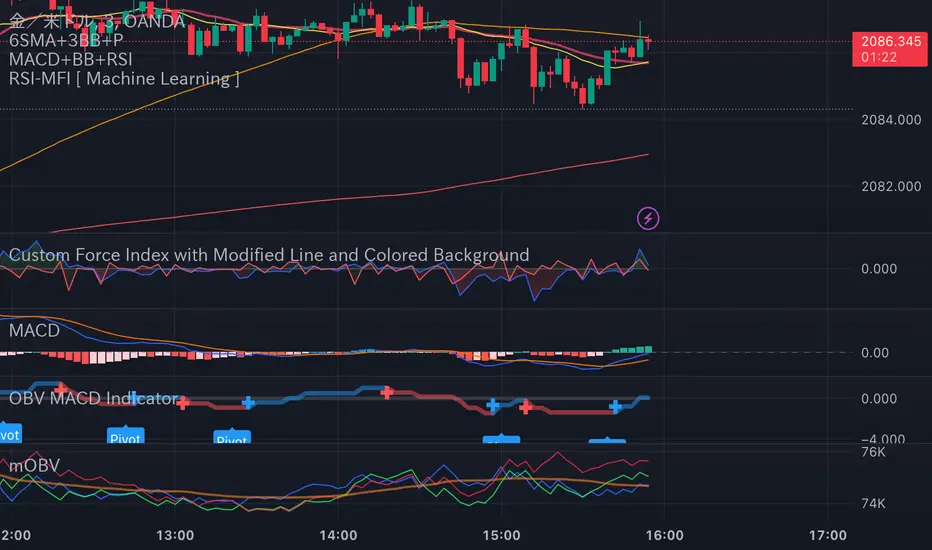
Modified On Balance VolumeModified On Balance Volume (mOBV) Indicator
The "Modified On Balance Volume" (mOBV) indicator is designed to provide insights into the cumulative buying and selling pressure in the market, with modifications for close, high, and low prices. It incorporates On Balance Volume (OBV) calculations for each of these price types and further refines the analysis by applying Simple Moving Averages (SMA).
Key Features:
Calculation of OBV for Close, High, and Low Prices:
Traditional OBV values are computed for close, high, and low prices, reflecting the cumulative volume based on the sign of price changes.
SMA Smoothing:
Simple Moving Averages (SMA) are applied to the calculated OBV values, introducing a smoothing effect to highlight trends in the buying and selling pressure.
Relative Values for High and Low OBV:
The script transforms the OBV values for high and low prices into relative values compared to the SMA of the OBV for close prices.
User-Defined SMA Length:
Users can customize the length of the SMA through a parameter, allowing flexibility in adapting the indicator to different market conditions.
Error Handling:
The script includes a mechanism to detect if no volume data is provided by the data vendor, alerting users to potential issues with the dataset.
Visual Representation:
The calculated OBV values for close, high, and low prices, as well as the SMA of the OBV for close prices, are visually represented on the chart with customizable colors and transparency settings.
Usage Tips:
Rising values indicate increasing buying pressure, while falling values suggest increasing selling pressure.
Crosses between the OBV lines and the SMA line may be used to identify potential trend changes.
Note:
This script is intended for informational purposes and should be used in conjunction with other technical analysis tools for comprehensive market analysis.
Volume Heatmap 2024 | NXT2017 Christmas EditionHi big players around the world,
I wish you a merry christmas time.
Today I have a nice present for you: a new volume heatmap indicator for free using!
HISTORY
My first volume heatmap project got a lot of feedback and a big demand. You can find it here:
In this time pinescript version 4 was the newest one and I worked the first time with arrays.
Today we have pinescript version 5 and some new features. This is why I tried again with matrix function and the results are better than I expected.
HOW IT WORKS
The indicator calculates similar like the volume profile. It looks back and every volume where the close price is on the same row area, the volume will cumulated. How much rows the new chart view is showing, you can choose manually.
The mind behind this is to find high volume levels, where high volume catch the price in a range or get function as support/resistance line.
PICTURES
I hope it helps for your trading. You are welcome to give some comments.
Merry christmas and best regards
NXT2017

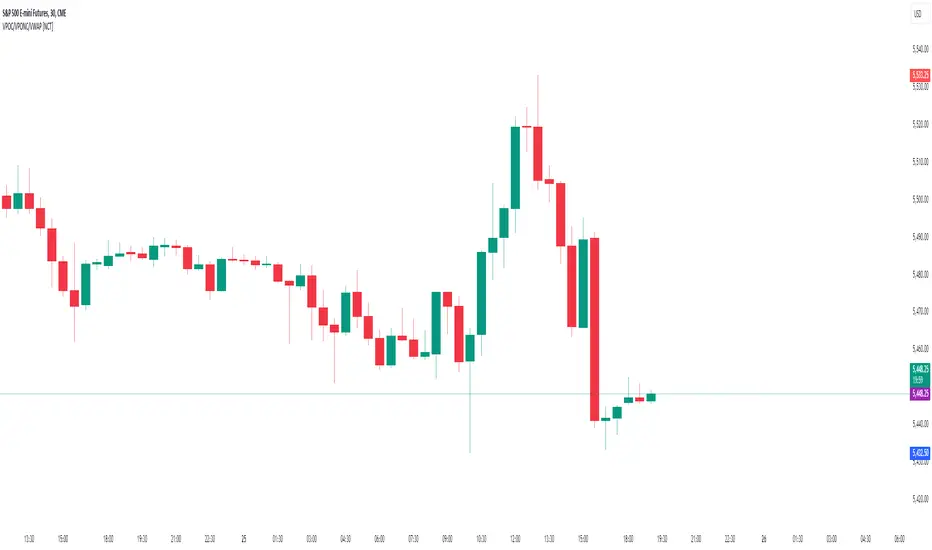
Volume Points of Control and No Control [NariCapitalTrading]Overview:
The "Volume Points of Control and No Control" (VPOC/VPONC) is a trading indicator/concept I designed to identify key price levels based on volume activity. It shows (on the price label on the y-axis) where there was the most (red) and the least (blue) volume over a specified lookback period. Read below for interpretation.
Key Features:
Identifies key price levels based on volume
Customizable lookback period and trade timeframe
Plots Volume Point of Control (VPOC) and Volume Point of No Control (VPONC)
Inputs and Calculations:
Custom Trade Timeframe: Allows users to set the desired timeframe for analysis (e.g., Daily, Weekly).
Lookback Period: Users can specify the period over which to analyze volume data.
VPOC Calculation: Determines the price level with the highest volume within the lookback period.
VPONC Calculation: Finds the price level with the lowest volume within the lookback period.
Indicator Usage:
The VPOC is considered a significant level where traders have shown the most interest, often acting as a strong support or resistance level. The VPONC, conversely, is a concept I made up. It represents a price level where 1) in an trending market, this price was accepted quickly, thus suggesting continuation of an trend. 2) price retracements will typically revisit thinly-traded price areas, the VPONC can sometimes signal an area of support in a downtrend.
Chart Representation:
VPOC Label: Plotted on the y-axis in red, indicating the price level with the highest volume.
VPONC Label: Displayed on the y-axis in blue, showing the price level with the least volume.
These labels are dynamically updated based on the user-specified lookback period and trade timeframe.
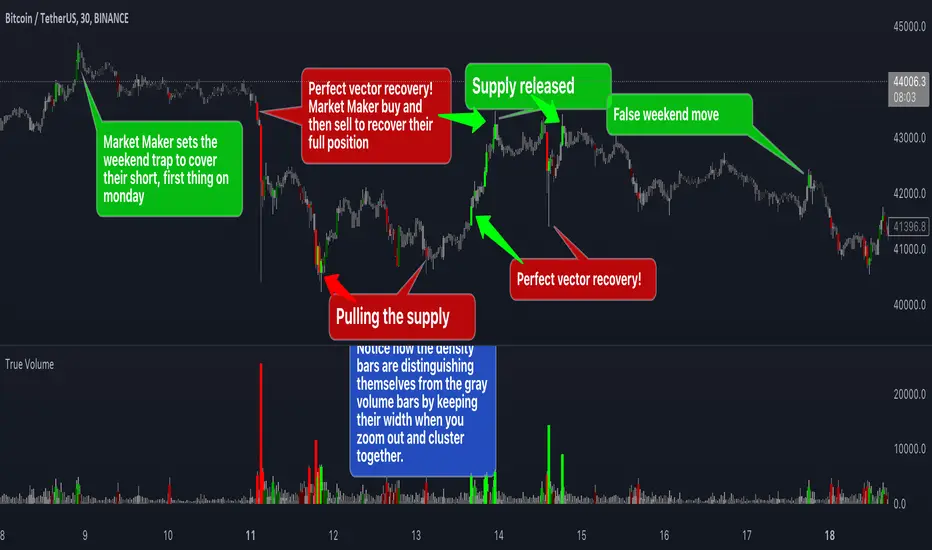
True VolumeThis indicator is designed to provide in-depth analysis of volume data from multiple sources and distinguish highly liquid candles by measuring the density of the volume. By focusing on the density and concentration of volume, rather than just the volume itself, it offers a more nuanced view of the market. This can be particularly beneficial in markets like cryptocurrencies, where understanding the role of market makers versus retail traders is crucial for strategic trading.
This is how it works:
Multiple Asset Integration:
Unlike standard volume indicators, True Volume allows the inclusion of up to four different assets (or the same asset from various exchanges) into its volume calculations. This feature provides a broader and more accurate total volume representation, essential in markets like cryptocurrencies where volume is dispersed across multiple exchanges.
Adjustable Time Anchors:
It offers various time anchor options, allowing traders to analyze volume data over different time periods or a specific amount of lookback candles. This flexibility helps in understanding volume trends over both short and long-term time frames.
Volume Density Analysis:
The core of this indicator is the innovative concept of Volume Density. It's calculated using a sigmoid function that normalizes the volume-to-price movement ratio in a unique way without needing a max cap or having the density column spike off the chart. This method helps in distinguishing between normal volume fluctuations and those that are unusually dense for the given price movement. This distinction is key in identifying potential market maker activities.
The Visuals:
The Volume Density is displayed in a unique way without compromising the original volume bars or cap the density. Infinite density can essentially be represented without having an infinitely large bar or caping out the density data. There's also two different color themes, optional bar color, and an option to flip the density bars up-side down for a different representation. Each of the original volume sources can be displayed separately as well. All colors as customizable as well for your own preference.
Price Volume Trend (PVT):
Included in this indicator is also the Price Volume Trend, which cumulatively measures the density delta, offering insights into the longer-term momentum of the market.
How do I trade it?
This indicator aims to give you insight into 'the other side of the trade', the Market Makers. When you buy, they provide liquidity by selling to you. That drives the Volume Density up.
Consider whether the market maker is currently long or short and might need to cover their position by wicking price back, or "adjust inventory". Especially towards the end of a market session.
Consider dense candles during market gaps or weekends to be market manipulation moves.
The density also goes up when stop losses are hit. If price makes a higher high or lower low, high density could indicate a liquidation event.
Gross and Net LTF Volume + Trailing Percentile Sessions CVOL Hi Traders !
Gross volume, net lower time frame (LTF) volume and trailing session percentile Cumulative session volume:
The code calculates and plots the following volume indicators:
Volume (Gross Volume): The total volume for the current bar.
Net lower time frame volume: The difference between the buy and sell volumes of the lower time frame.
Cumulative daily session volume: The cumulative sum of the volume for the current day.
Percentile Cumulative daily session volume: The percentile of the cumulative daily session volume (calculated on a rolling basis).
The above indicators may be plotted exclusively or exclusively.
Why is Volume important:
Volume is the number of shares or contracts traded (of a financial asset) during a given time period (timeframe). It is a crucial indicator in technical analysis and quantitative trading, as volume helps in identifying
Price Confirmation: Volume confirms price movements by indicating the level of interest and participation in the market. When prices move significantly, accompanied by strong volume, it suggests that the movement is likely to be sustained. Conversely, if prices move without significant volume, it suggests that the movement may be temporary or lacking conviction.
Trend Strength: Volume can help identify the strength and direction of a trend. During an uptrend, increasing volume alongside price increases indicates that the upward momentum is gaining traction. Conversely, decreasing volume during an uptrend suggests that the upward momentum may be weakening.
Reversal Points: Sharp volume spikes in the opposite direction of the prevailing trend can signal a potential reversal point. This is because large volume indicates a significant shift in trader sentiment, suggesting that the trend may be changing direction.
Liquidity: High volume indicates that a security is liquid, meaning that it can be easily bought and sold without significant price impact. Liquidity is important for traders who want to execute large orders without significantly affecting the market price.
For example, suppose we want to identify positive price confirmation and positive trend strength, in this case we may use the CVOL (with trailing percentile).
The above image showcases price expansion conditional on high positive volume (increasing CVOL), The price expansion also exhibits Volume confluences (the colored bars).
Positive Confluence: Increase in positive total volume and an increase in positive lower time frame volume in relative and absolute terms.
Negative Confluence : Increase in negative total volume and an increase in negative lower time frame volume in relative and absolute terms.
Also note how the percentile color does not change, this means that the new volume bars are > than the highest percentile (80%) of volume values from the beginning of the session.

ka66: Normalised/Relative VolumeThis is an idea taken from a John Bollinger (of Bollinger Bands fame) talk. Instead of showing volume with a moving average overlay, we show volume relative to its moving average:
avgVolume = sma(volume, 10) // several configurable MAs allowed
relativeVolume = volume / avgVolume
Now if we get a value of 1, that means the current volume is the same as its historical average. Under 0, less than average, and above zero, greater than its average.
If we get a value like 2, then current volume is twice its average. I hope the implication of this being displayed visually is becoming clearer.
We plot this relative volume as columns.
We then plot horizontal levels, like 1, 2, 3 to see the magnitude of the current volume relative to its average.
Consecutive rising or falling relative volume is shown in the same colour.
I am still exploring volume as trading data point, but we see some ideas from this visual representation:
How do volume patterns change across timeframes? Do we get better signals or higher or lower time frames (e.g. big relative volume spikes)
Can consecutive rises or falls indicate a big potential move, even though price is just fluctuating.
What about a switch from rise to fall.
If we get pinbars/spikes with a big relative volume spike, can we then infer more clearly whether buyers or sellers are in control.
Accumulation/Distribution Money Flow v1.0This indicator is intended to measure selling and buying pressure, calculates accumulation/distribution levels and suggests current trend intensity and direction.
Core calculations are based on open source script by cI8DH which was not updated ever since 2018. Also, it implements the technique to avoid price gaps issues as described in Twiggs® Money Flow .
The indicator can plot calculated A/D line, a smoothed A/D line and another smoother derivative from the smoothed line which serves as a signal line. By implementing crossovers detection between two lines and also measuring distance between them it plots the histogram of the difference and can also color chart bars accordingly.
You can also use settings to factor in price and/or volume into calculations.
Three options for visual color representation are available.
1) Simple color bars
In this case bars are colored in red and green by default, whereas green indicates positive distance between smoothed A/D line and signal line (upward movement), and red indicated negative distance (downward movement).
2) 4-color scheme
In this case pale green and pale red colors are added, whereas pale red used when the histogram is positive and A/D + signal lines are below zero lines (start of upward movement from lower levels), and pale green is where histogram is negative and both A/D and signal lines are above zero line (start of downward movement from top levels). Bright red and green colors indicate strong movement where the position of A/D + signal lines correspond to positive and.or negative histogram values. This option allows to visually track trend intensity more precisely.
3) Gradient bars color
In this scheme the candles are colored using gradient of either red or green color depending on the intensity and direction of the trend. For that color scheme you must specify the lookback parameter indicating number of bars back to determine highest/lowest values.

Volume Profile PlusThis indicator provides a high-resolution and high-precision implementation of Volume Profile with flexible range settings. Its key features include:
1. Support for a high resolution of up to 2,500 rows.
2. Capability to examine lower timeframe bars (default 5,000 intra-bars) for enhanced precision.
3. Three range modes — "Visible Range", "Anchored Range", and "All Range".
4. Highlighting of Point of Control and Value Area.
5. Extensive customization options allowing users to configure dimensions, on-chart placements, and color schemes.
🔵 Settings
The settings screen, along with the explanations for each setting, is provided below:
🔵 High Resolution using Polyline
Inspired by @fikira, this indicator utilizes the newly introduced `polyline` type in PineScript to plot the volume profile. It employs a single polyline instance to represent the entire histogram. With each polyline instance supporting up to 10,000 points and each histogram row requiring 4 points, this indicator can accommodate 2500 rows, resulting in a significantly higher resolution compared to conventional volume profile indicators that use `line`s or `box`es to draw the histogram.
🔵 High Precision Data-binning using Lower Timeframe Data
Conventional volume profile indicators often face one or both of the following limitations:
1. They only consider volume within the chart's current timeframe.
2. They assign each bar's total volume to a single price bucket based on the bar's average price, rather than distributing volume across multiple price buckets.
As a result, when the number of bars in the chart is low, those indicators may provide imprecise results, making it difficult to accurately identify significant volume nodes and the point of control.
To address these limitations and enhance accuracy, this indicator examines data from lower timeframes and distributes the volume to fine-grained price buckets. It intelligently selects an appropriate lower timeframe to ensure precise output while complying with a maximum specified number of bars to maintain good performance.
🔵 Three Range Modes
This indicator offers users the flexibility to choose from three range modes:
1. Visible Range (Default Mode): In this mode, the volume profile calculation begins at the time of the left-most bar displayed in the current viewport. As the user scrolls through the viewport, the volume profile updates automatically.
2. Anchored Range: This mode allows the user to set the start time either by using the datetime input boxes or by dragging the anchor line on the chart.
3. All Range: In this mode, the volume profile calculation is based on all the historical bars available in the chart.

Double Simple Moving AverageThe Double Simple moving average is an indicator developed to help traders identify dynamic levels of support and resistance as well as determine current trend direction.
This indicator shows both an SMA calculated on highs and one calculated on lows. In addition to that, it plots the deviation bands based on the space between the two main lines.
The gradient color between the two main lines can be used to determine the volumetric pressure and confirmation of the current trend.

MADALGO`s Enhanced OBV DivergencesDescription:
MADALGO's Enhanced OBV Divergences indicator is a unique tool designed for traders to visualize the divergences between price action and On Balance Volume (OBV), a fundamental aspect often indicative of underlying strength or weakness in the market. By keenly identifying these divergences, traders are better positioned to anticipate potential trend reversals or trend continuations, making this script an invaluable addition to their technical analysis toolkit.
This script meticulously scans for both regular and hidden bullish/bearish divergences, providing a comprehensive view of market sentiment. The core of this indicator is built around the OBV, which cumulatively adds or subtracts volume based on the price movement per period, thus providing a running total of volume and portraying the force behind the price movements.
The regular divergences are classic indicators of a potential reversal in the current trend, while hidden divergences are often indicative of trend continuation. These divergences are pinpointed based on the relative positions of the OBV and price highs/lows, over customizable lookback periods and within specified lookback ranges.
Features:
Regular and Hidden Divergences: Clearly marked bullish and bearish divergences provide insights into potential market turning points.
On Balance Volume (OBV) Line: Visualize the continuous flow of buying and selling pressure, enabling the identification of accumulation or distribution phases essential for understanding the market's strength or weakness.
Moving Average of OBV: An optional feature to smooth the OBV line, aiding in the identification of the overarching trend.
Dynamic Statistics Label: A floating label provides real-time updates on essential statistics like the Rate of Percentage Change (RPC) of OBV, the last divergences, and bars since the last divergences.
Inputs:
Pivot Lookback Right and Pivot Lookback Left: Define the lookback periods for identifying pivot points in the OBV line.
Max of Lookback Range and Min of Lookback Range: Define the range for considering divergences.
RPC Period: Defines the period for calculating the Rate of Percentage Change of the OBV.
MA Period: Defines the period for the optional moving average of the OBV.
Plot Bullish, Plot Hidden Bullish, Plot Bearish, Plot Hidden Bearish: Toggle visibility of respective divergences.
Plot Moving Average: Toggle visibility of the OBV moving average.
Usage:
Add the script to your TradingView chart.
Tailor the input parameters in the settings panel to align with your analysis requirements.
The divergences, OBV line, and optional moving average will be plotted on your chart, with a dynamic label displaying real-time statistics.
Set up alerts to be notified of identified divergences, enabling timely decision-making.
Alerts:
Regular bullish/bearish divergence in OBV found: Triggered when a regular bullish or bearish divergence is identified.
Hidden bullish/bearish divergence in OBV found: Triggered when a hidden bullish or bearish divergence is identified.
Underlying Concepts:
The OBV Divergences indicator is rooted in the principle that volume precedes price movement. When prices are rising with increased volume, it suggests that buying pressure is prevailing and may lead to continued upward momentum. Conversely, rising prices with decreasing volume might indicate a lack of buying conviction and could signal a potential price reversal. The identification of divergences between price and OBV can therefore serve as a powerful signal for traders. These examples can be seen below in the image
The Moving Average of the OBV further aids in understanding the prevailing trend by smoothing out the OBV line, providing a clearer picture of the market's longer-term momentum. The Rate of Percentage Change (RPC) provides insight into the momentum of volume, offering an additional layer of analysis. Together, these additional features enhance the core OBV analysis, enabling a more nuanced understanding of volume dynamics fundamental for making more informed trading decisions.
License:
This Source Code Form is subject to the terms of the Mozilla Public License, v. 2.0. If a copy of the MPL was not distributed with this file, you can obtain one at Mozilla Public License 2.0.

YD_Volume_Alert"YD_Volume_Alert" is a simple alert based on the increasing volume.
Although it is a simple indicator, strategies to determine accumulation and distribution can be developed using this indicator, which will also be published as well.
📌 Usage, Details and Alert
Using this indicator is simple.
You can enter two scales, "Increased Percentage 1 (%)" and "Increased Percentage 2 (%)", with default values set to 200% and 500%.
Signals are displayed in green and red triangles at the bottom of the bar, also printed with the text "Increased Volume" and "Hugely increased Volume".
Alerts are provided as a combination of the chart's symbol and the set percentage. For example,
"BINANCE:BTCUSDT.P 's Volume : 200% increased."
===========================================================
"YD_Volume_Alert" 는 거래량 증가에 따른 얼러트를 제공하는 간단한 지표입니다.
간단한 지표이지만 위 지표를 이용하여 매집과 매도의 타이밍으로 이용하는 전략 또한 개발할 수 있으며, 이 역시도 퍼블리시 할 예정입니다.
📌 사용 예시와 알림 설정
지표를 사용하는 방법은 간단합니다.
"Increased Percentage 1 (%)" 과 "Increased Percentage 2 (%)" 두 가지의 배율을 입력할 수 있으며, 기본값은 200%와 500%로 설정되어 있습니다.
시그널은 바 하단에 초록색, 빨간색 삼각형으로 각각 표시되며, "Increased Volume"과 "Hugely increased Volume"이라는 텍스트가 함께 출력됩니다.
얼러트는 자신이 설정한 차트의 심볼과 설정한 퍼센티지의 조합으로 제공되며 예를 들면 다음과 같습니다.
"BINANCE:BTCUSDT.P 's Volume : 200% increased."

Zaree - Bull & Bear Volume VoidThe "Zaree - Bull & Bear Volume Void" (BBVV) indicator is a versatile tool designed to help traders assess the dynamics of bull and bear power in the market, with a focus on volume-based analysis. This indicator offers a range of features that aid in identifying potential shifts in market sentiment and strength.
Details of the Indicator:
Volume Void Color Settings: This indicator allows you to customize the colors used for different conditions, such as strong bull areas, slowing bull areas, strong bear areas, and slowing bear areas. These colors play a crucial role in visualizing the indicator's output.
Volume Void Settings: The BBVV indicator provides options for selecting specific volume void functions, which include "Relative Volume Comparison," "Percentage of Average Volume," "Fixed Volume Threshold," "Volatility-Adjusted Volume," "Compare to Previous Volume Bars," "Volume Percentile Rank," and "Market Session Comparison." Each function has its own criteria for evaluating volume conditions.
Void Bull Sensitivity and Void Bear Sensitivity: These are key parameters in the settings. The values you choose for void bull sensitivity and void bear sensitivity will significantly impact the background color displayed by the indicator. Properly configuring these values is crucial for the indicator's effectiveness.
Moving Average Settings: You can specify the source and length of moving averages used in the indicator. This helps in smoothing out data and providing a clearer picture of bull and bear power.
Void Color Background Conditions: The indicator dynamically changes the background color of the chart based on the current market conditions. It takes into account bull and bear power, as well as the configured sensitivity levels to determine whether the market is in a strong or slowing bull/bear phase.
MACD and Signal Lines: The indicator also displays MACD and signal lines on the chart, helping traders identify potential bullish and bearish crossovers.
Histogram Bars: Histogram bars are used to represent the strength of bull and bear power. Above-zero bars indicate bullish strength, while below-zero bars indicate bearish strength.
How to Use the Indicator:
Begin by customizing the color settings for different market conditions to your preference.
Select a volume void function that aligns with your trading strategy and objectives.
Configure the void bull sensitivity and void bear sensitivity values carefully. These values should reflect your desired sensitivity to volume conditions.
Choose the source and length of moving averages based on your analysis requirements.
Pay attention to the background color of the chart. It will change dynamically based on the current market conditions, providing insights into the strength of bull and bear power.
Observe the MACD and signal lines for potential bullish or bearish crossovers, which can be used as additional confirmation signals.
Interpret the histogram bars to gauge the strength of bull and bear power.
Example of Usage:
As a swing trader with a focus on volume analysis, you can use the BBVV indicator to enhance your trading decisions. Here's an example of how you might use the indicator:
Select "Relative Volume Comparison" as the volume void function to assess volume relative to a simple moving average.
Configure void bull sensitivity and void bear sensitivity to match your risk tolerance and trading style.
Choose "SMA" as the moving average type with a suitable length.
Pay attention to the background color changes in the chart. Strong bull areas may indicate potential bullish opportunities, while strong bear areas may signal bearish conditions.
Monitor the MACD and signal lines for potential crossovers, aligning them with the background color to validate your trading decisions.
Use the histogram bars to assess the strength of bull and bear power, helping you gauge market sentiment.
Remember that the BBVV indicator is a valuable tool to complement your trading strategy. It provides insights into volume dynamics and market conditions, allowing you to make informed trading choices.
Be sure to adjust the indicator settings according to your trading preferences and always consider the broader market context in your analysis.

Volume Delta Trailing Stop [LuxAlgo]The ' Volume Delta Trailing Stop ' indicator uses Lower Time Frame (LTF) volume delta data which can provide potential entries together with a Volume-Delta based Trailing Stop-line .
🔶 USAGE
Our 'Volume Delta Trailing Stop' script can show potential entries/Stop Loss lines
A trigger line needs to be broken before a position is taken, after which a Volume Delta-controlled Trailing Stop-line is created:
🔶 DETAILS
🔹 Volume rises when bought or sold
🔹 When the opening price appears on the chart, a buy/sell order has been executed.
If that order is less than the available supply of that particular price, volume will rise, without moving the price.
🔹 When the opening price is the same as the closing price, the volume of that bar can be seen as "neutral volume" (nV); nor "up", nor "down" volume.
Example
A buy order doesn't fill the first available supply in the order book. This price will be the opening price with a certain volume.
When at closing time, price still hasn't moved (the first available supply in the order book isn't filled, or no movement downwards),
the closing price will be equal to the opening price, but with volume. This can be seen as "neutral volume (nV)".
🔹 Delta Volume (ΔV): this is "up volume" minus "down volume"
🔹 Standard volume is colored red when closing price is lower than opening price ( = "down volume").
🔹 Standard volume is colored green when closing price is higher OR equal (nV) than opening price ( = "up volume").
🔹 Neutral Volume
The "Neutral-Volume" is considered "Up-Volume" - setting will dictate whether nV is considered as green 'buy' volume or not.
🔶 EXAMPLE
29 July 10:00 -> 10:05, chart timeframe 5 minutes, open 29311.28, close 29313.89
close > open, so the volume (39.55) is colored green ("up volume").
(The Volume script used in the following examples is the open-source publication Volume Columns w. Alerts (V) from LucF )
Let's zoom to the 1-minute TF:
The same period is now divided into more bars, volume direction (color) is dependable on the difference between open and close.
Counting up and down volume gives a more detailed result, it remains in an upward direction though):
(ΔV = +15.51)
Let's further zoom in to the 1-second TF:
The same period is now divided into even more bars (more possibility for changing direction on each bar)
Here we see several bars that haven't moved in price, but they have volume ("neutral" volume).
(neutral volume is coloured light green here, while up volume is coloured darker green)
When we count all green and red volume bars, the result is quite different:
(ΔV = -0.35)
In total more volume is found when price went downwards, yet price went up in these 5 minutes.
-> This is the heart of our publication, when this divergence occurs, you can see a barcolor changement:
• orange: when price went up, but LTF Volume was mainly in a downward direction.
• blue: when price went down, but LTF Volume was mainly in an upwards direction.
When we split the green "up volume" into "up" and "neutral", the difference is even higher
(here "neutral volume" is colored grey):
(ΔV = -12.76; "up" - "down")
🔶 CONCEPTS
bullishBear = current bar is red but LTF volume is in upward direction -> blue bar
bearishBull = current bar is green but LTF volume is in downward direction -> orange bar
🔹 Potential positioning - forming of Trigger-line
When not in position, the script will wait for a divergence between price and volume direction. When found, a Trigger-line will appear:
• at high when a blue bar appears ( bullishBear ).
• at low when an orange bar appears ( bearishBull ).
Next step is when the Trigger-line is broken by close or high/low (settings: Trigger )
Here, the closing price went under the grey Trigger-line -> bearish position:
🔹 Trailing Stop-line
When the Trigger-line is broken, the Trailing Stop-line (TS-line) will start:
• low when bullish position
• high when bearish position
You can choose (settings -> Trigger -> Close or H/L ) whether close price or high/low should break the Trigger-line
When alerts are enabled ("Any alert() function call"), you'll get the following message:
• ' signal up ' when bullish position
• ' signal down' when bearish position
After that, the TS-line will be adjusted when:
• a blue bullishBear bar appears when in bullish position -> lowest of {low , previous blue bar's high or orange bar's low}
• an orange bearishBull bar appears when in bearish position -> highest of {high, previous blue bar's high or orange bar's low}
When alerts are enabled ("Any alert() function call"), and the TS-line is broken, you'll get the following message:
• ' TS-line broken down ' when out bullish position
• ' TS-line broken up ' when out bearish position
🔹 Reference Point
Default the direction of price will be evaluated by comparing closing price with opening price.
When open and close are the same, you'll get "neutral volume".
You can use "previous close" instead (as in built-in volume indicator) to include gaps.
If close equals open , but close is lower than previous close , it will be regarded as " down volume ",
similar, when close is higher than previous close , it will be regarded as " up volume "
Note, the setting applies for the current timeframe AND Lower timeframe:
Based on: " open " (close - open)
Based on: " previous close " (close - previous close)
🔹 Adjustment
When the TS-line changes, this can be adjusted with a percentage of price , or a multiple of " True Range "
Default (Δ line -> Adjustment - 0)
Δ line -> Adjustment 0.03% (of price)
Δ line -> Mult of TR (10)
🔶 SETTINGS
🔹 LTF: choose your Lower TimeFrame: 1S (seconds), 5S, 10S, 15S, 30S, 1 minute)
🔹 Trigger: Choose the trigger for breaking the Trigger-line ; close or H/L (high when bullish position, low when bearish position)
🔹 Δ line ( Trailing Stop-line ): add/subtract an adjustment when the TS-line changes ( default: Adjustment ):
• Adjustment ( default: 0 ): add/subtract an extra % of price
• Mult of TR : add/subtract a multiple of True Range
🔹 Based on: compare closing price against:
• open
• previous close
🔹 "Neutral-Volume" is considered "Up-Volume" : this setting will dictate whether nV is considered as green 'buy' volume or not.
🔶 CONSIDERATIONS
🔹 The lowest LTF (1S) will give you more detail and will get data close to tick data.
However, a maximum of 100,000 intrabars can be used in calculations .
This means on the daily chart you won't see anything since 1 day ~ 86400 seconds. (just over 1 bar)
-> choose a lower chart timeframe, or choose a higher LTF (5S, 10S, ... 1 minute)
🔹 Always choose a LTF lower than the current chart timeframe.
🔹 Pine Script™ code using this request.security_lower_tf() may calculate differently on historical and real-time bars, leading to repainting .

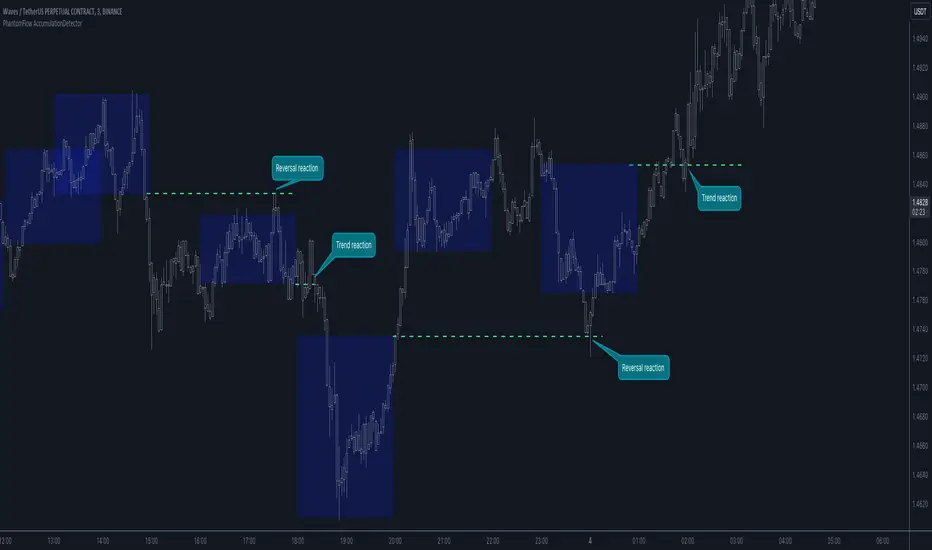
PhantomFlow AccumulationDetectorThe PhantomFlow AccumulationDetector indicator analyzes the volume profile and displays potential accumulation based on the selected timeframe in the settings. This indicator can be used both as zones for trend following and for identifying reversals, as shown in the examples on the chart. The logic behind the formation of the accumulation zone is based on the fact that the POC (Point of Control) of the current zone is within the Volume Area range of the previous period.
Optimal settings for the working timeframe should be chosen visually, and the size of the zones should not be too large or too small. Additionally, it's advisable not to consider overly wide zones during increased volatility.
Consecutive zones within the same range often indicate a potential reversal.
We borrowed the volume profile calculation code from @LonesomeTheBlue. Thank you for the work done!
buyer_seller_scalping_indicatorThis code is a custom script designed for analyzing trading volume within a specific time window on the TradingView platform. It offers a comprehensive analysis of buying and selling activity during a defined period and provides visual aids and data summaries for traders to make informed decisions. Here's a detailed breakdown of its functionality and how to use it:
1. Custom Time Period: The script starts by allowing you to specify a custom time period for analysis. In this example, it's set from 04:00 to 09:29. You can modify these time values to suit your specific trading needs.
2. Volume Calculation: The script calculates buying and selling volume based on price levels. It takes into account the open, high, low, and close prices to determine whether buying or selling pressure is dominant during the specified time frame.
3. Total Volume Calculation: It calculates the total volume within the custom time period. This can help you gauge the overall activity and liquidity during the chosen time window.
4. Visualizations: The script then plots visual elements on the chart:
- A volume histogram, which provides a graphical representation of the total volume during the time period.
- Buying and selling volume indicators, which are shown as circles on the chart, highlighting the relative strength of buyers and sellers.
- An average volume line, represented in gray, which helps you identify the average trading volume over a 50-period moving average.
5. Volume Type Determination: The script determines whether buyers or sellers dominate the market during the specified time period. It labels this as "Buyers Volume > Sellers Volume," "Sellers Volume > Buyers Volume," or "Buyers Volume = Sellers Volume." This information can be crucial for assessing market sentiment.
6. Percentage Breakdown: The script calculates the percentage of buying and selling volume in relation to the total volume, helping you understand the distribution of market participants. These percentages are displayed in a table.
7. Table Display: Finally, the script creates a table that displays the following information:
- The current volume type (buyers, sellers, or balanced), with corresponding text colors.
- The percentage of buyers and sellers in the market.
How to Use:
1. Copy the script and add it as a custom script on TradingView.
2. Apply the script to your desired financial chart.
3. Adjust the custom time period if needed.
4. Interpret the visual elements and table to gain insights into market sentiment and volume distribution during the specified time frame.
5. Use this information to inform your trading decisions and strategies, especially when trading within the chosen time window.
This script is a valuable tool for traders seeking to understand market dynamics and volume behavior during specific trading hours, ultimately aiding in more informed trading decisions.
Disclaimer:
The indicator provided herein is experimental and has not undergone comprehensive testing. Its usage is solely at your own risk.
The publisher assumes no responsibility for any trading decisions made based on the utilization of this indicator.

Bias of Volume Share inside Std Deviation ChannelThe "Bias of Volume Share inside STD Deviation Channel" indicator is a powerful tool for traders aiming to assess market sentiment within a standard deviation (STD) price channel. This indicator calculates the bullish or bearish bias by analysing the share of volume within the standard deviation channel and provides valuable insights for decision-making.
Usage:
This indicator is a valuable tool for traders seeking to gain in-depth insights into market sentiment within a specified price channel. By focusing on price movements that fall within the standard distribution range and filtering out noise and market manipulations, it provides a clear view of prevailing bullish or bearish biases. Traders can leverage this information to make well-informed trading decisions that align with current market conditions, enhancing their trading strategies and potential for success.
Please ensure you review and adhere to the terms of the Mozilla Public License 2.0, as outlined in the indicator's source code.

Exceptional Volume Spike - Potential Trend Reversal IndicatorWhat the Script Does:
The indicator aims to identify potential trend reversal points using the following steps:
Input Parameters: The script has three main input parameters that you can adjust:
relative_volume_threshold: This parameter sets the threshold for what is considered an exceptional volume spike in relation to the average volume.
ema_length: The length of the exponential moving average (EMA) used for smoothing calculations.
lookback_period: The period over which the script calculates potential support and resistance levels.
Relative Volume Calculation: The script calculates the relative volume by dividing the current volume by the average volume over the specified lookback_period.
Exceptional Volume Spikes: The script identifies exceptional volume spikes when the calculated relative volume exceeds the specified relative_volume_threshold.
EMA of Exceptional Volume Spikes: The script calculates the exponential moving average (EMA) of volume spikes. This EMA smooths out the volume spikes over the chosen ema_length.
Trend Direction: The script determines the trend direction using the crossovers of the EMA of exceptional volume spikes. If the EMA crosses above the EMA of regular volume (not spikes), it suggests a potential upward trend reversal. Conversely, if the EMA crosses below, it suggests a potential downward trend reversal.
Support and Resistance Levels: The script calculates potential support and resistance levels based on the highest high (hh) and lowest low (ll) over the specified lookback_period. These levels are then plotted on the chart.
Plot Shapes and EMA: The script plots triangle shapes below the bars for potential upward reversals and above the bars for potential downward reversals. Additionally, it plots the EMA of the closing price with different colors based on the trend direction.
By using this script as an indicator on your chart, you can visually assess potential trend reversal points based on exceptional volume spikes, trend direction crossovers, and support/resistance levels. Remember that this script serves as a tool to assist your analysis, and it's important to combine it with other technical analysis tools and strategies before making trading decisions.

Strategy - Relative Volume GainersStrategy - Relative Volume Gainers
Overview:
This trading strategy, called "Relative Volume Gainers," is designed for Long Entry opportunities in the stock market. The strategy aims to identify potential trading candidates based on specific technical conditions, including volume, price movements, and indicator alignments.
Strategy Rules:
The strategy is focused solely on Long Entry positions.
The volume for the current trading day must be greater than or equal to the volume of the previous day.
The percentage change in price must be greater than or equal to 2.5%.
The Last Traded Price (LTP) must be greater than or equal to the Exponential Moving Average (EMA) 200.
The Relative Volume for the current trading day (calculated over the last 30 days) must be greater than or equal to the Simple Moving Average (SMA) of Relative Volume over the same 30 days.
The current candle on the chart should be Green or Bullish, indicating positive price movement.
The price difference between bid and ask prices should be kept to a minimum.
It's recommended to also analyze market depth for better insights.
Strategy Requirements:
Add the Exponential Moving Average (EMA) 200 to your trading chart.
This strategy can be applied on charts of any timeframe.
For intraday trading, particularly for early entry, consider using a 1-minute timeframe.
It is advisable to create a screener to identify potential trades in real-time market conditions.
Risk Warning:
Stocks that meet the strategy criteria might exhibit high volatility and a high beta, making them inherently risky to trade. Exercise caution and adhere to predetermined risk management strategies.
Determine your trading quantity based on your entry price and stop loss in order to manage risk effectively.
Quantity Calculation Formula:
Quantity calculation is crucial to manage risk and position sizing. The following formulas can be used based on your trading scenario:
Quantity with Leverage:
Quantity = (((Using Capital / 100) * Risk Percent) / (Entry Price - Stop Loss)) * Leverage
Eg: Quantity = (((10000 / 100) * 0.2) / (405.5 - 398.5)) * 5
Quantity = 14
Risk = Rs.100 (Rs.100 is 1% of Rs.10000. So the risk is 1%, means we lose only Rs.100 when the SL is hit. If SL is increased the Quantity will get reduced to maintain a fixed risk of Rs.100)
Quantity without Leverage:
Quantity = (((Using Capital / 100) * Risk Percent) / (Entry Price - Stop Loss))
Note:
Always stay informed about market conditions and be prepared for potential rapid price movements when trading stocks that meet the strategy criteria. Strictly adhere to your predefined risk management strategy to safeguard your capital.

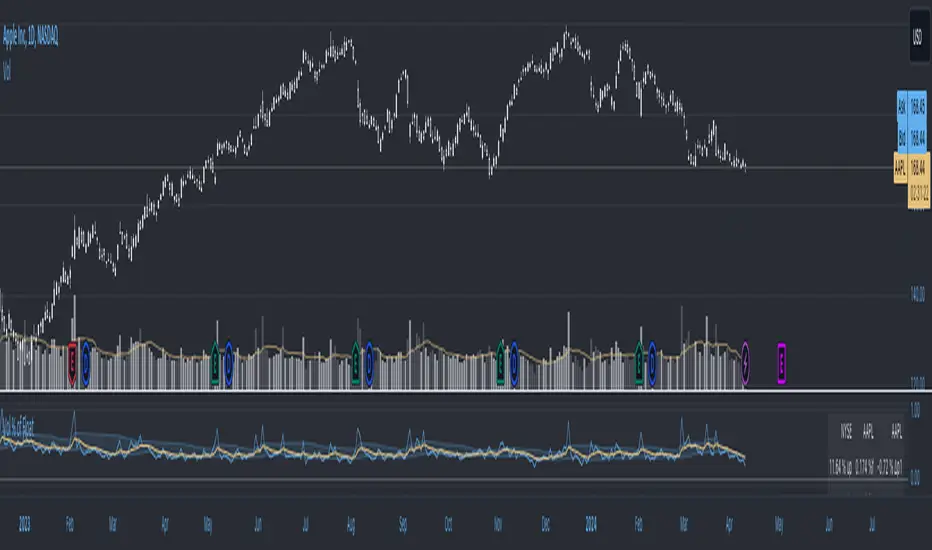
Volume as a Percent of Float by 3iauVolume as a Percent of Float
Plot the difference between current Chart Volume as a percent of Float/Outstanding and the moving average of the same.
Apply a multiplier to this value.
Plot the moving average of the difference between current Chart Volume as a percent of Float/Outstanding and the moving average of the same.