ATR Volatility AlertsOverview:
This is a dynamic alert tool based on the Average True Range (ATR), designed to help traders detect sudden price movements that exceed normal volatility levels. Whether you are trading breakouts or monitoring for abnormal spikes, this indicator visualizes these events on the chart and triggers system alerts when the price move exceeds your specified ATR multiplier.
Key Features:
Fully Customizable ATR Range:
You can adjust the ATR Length (Default: 14) and the Multiplier (Default: 1.5x).
Tip: Increase the multiplier (e.g., to 2.0 or 3.0) to catch only extreme volatility, or lower it for scalping smaller moves.
Visual Chart Signals:
Visual markers appear instantly when a bar's movement exceeds the ATR threshold.
Green Triangle: Indicates an Upward Spike.
Red Triangle: Indicates a Downward Spike.
Flexible System Alerts:
Designed to integrate seamlessly with TradingView's alert system. You can choose from three specific alert directions based on your strategy:
1.Price Spike Up: Triggers only on sharp upward moves.
2.Price Spike Down: Triggers only on sharp downward moves.
3.Bidirectional Volatility Alert: Triggers on BOTH huge pumps and dumps.
How to Set Alerts:
Click the "Create Alert" button in TradingView.
Select ATR Volatility Alerts in the "Condition" dropdown.
Choose the specific logic you need:
· Select Price Spike Up for bullish monitoring.
· Select Price Spike Down for bearish monitoring.
· Select Bidirectional Volatility Alert to watch for any volatility expansion.
ความผันผวน


RaymondTrending [Qanexra] - Advanced Volatility GaugePrice direction tells you where the market is going, but it doesn't tell you if it has the gas to get there.
RaymondTrending is a proprietary volatility instrument designed to measure the raw "energy" of the market. Unlike standard indicators that lag significantly, this tool uses a rapid-response composite algorithm to detect immediate shifts in market volatility.
What lies inside? The core engine is built on a multi-layered calculation of market range. It filters out static noise to provide a single, clean data stream representing the true "pulse" of the asset.
How to use it:
Rising Line: Volatility is expanding. The current trend (up or down) is backed by real volume and energy.
Falling Line: Volatility is collapsing. The market is entering a consolidation or "squeeze" phase.
Spikes: Sudden spikes often indicate breakout events or climatic tops/bottoms.
Access: This is a closed-source tool. Please contact Qanexra for access.

RaymondRatio [Qanexra] - Volatility with Doji Noise CancellationThe Problem with Standard Volatility: Most volatility indicators force a calculation on every single candle, regardless of quality. This means that during periods of market indecision (Dojis), your indicators are digesting "noise," leading to lag and false signals when the market finally moves.
The Solution: RaymondRatio Developed by Qanexra, the RaymondRatio is a sophisticated volatility gauge that introduces a proprietary "Doji Pause" mechanism. Instead of smoothing over noise, this indicator intelligently ignores it.
How It Works:
Volatility Engine: The core calculates the Raymond Trending value derived from a composite of short-term compare with the long-term volatility.
The Doji Pause: The indicator constantly monitors the Body-to-Range ratio of every candle. If a candle is detected as a Doji (indecision), the indicator freezes its calculation. It retains the last known "valid" volatility state.
The Ratio: The output is a ratio.
> 1.0: Volatility is expanding relative to the baseline (Active Market).
< 1.0: Volatility is compressing (Squeeze/Consolidation).
Key Features:
Smart Filtering: Background highlights in Gray indicate "Paused" zones where the market is undecided.
Clean Data: Prevents the baseline from being dragged down by low-quality price action.
Customizable Threshold: Users can define what constitutes a "Doji" (e.g., body is less than 30% of the range).
How to Trade: Use this as a filter for your existing strategy.
Green Light: When the Ratio is above 1.0 and rising, the market is in a valid expansion phase.
Red Light: When the Ratio is below 1.0 or "flatlining" during Doji Pauses, stay out of the market to avoid chop.

Best strategy for scalpingThis is a next-generation Machine Learning–powered trading strategy designed for high-accuracy intraday and swing trading. It combines adaptive trend filters, probability-weighted entries, and dynamic SL/TP logic to deliver consistent, noise-free signals.
No repainting.
Customizable risk settings.
Built for serious traders who want stable performance with low drawdown.
Invite-only access only.
Two Supertrend Crossover SignalThis indicator is designed to visualize trend shifts using two Supertrend lines and a crossover-based signal system.
It also colors the area between the two Supertrend lines based on the current trend direction, making trend changes easy to identify at a glance.
How It Works
The indicator plots:
Fast Supertrend (shorter ATR length, lower factor)
Slow Supertrend (longer ATR length, higher factor)
A crossover between these two Supertrend lines indicates a possible trend shift.
Buy Signal
A BUY signal occurs when: Fast Supertrend crosses ABOVE Slow Supertrend
This suggests bullish momentum strengthening.
Sell Signal
A SELL signal occurs when: Fast Supertrend crosses BELOW Slow Supertrend
This suggests bearish momentum increasing.
Buy/Sell Signal Labels
The chart displays clear BUY (green) and SELL (red) labels at every crossover.
These signals help traders quickly pinpoint potential entries or exits.
This indicator is ideal for:
✓ Trend trading
✓ Swing trading
✓ Identifying momentum shifts
✓ Visual confirmation of market direction
✓ Combining with price action or EMA filters
You may adjust ATR length and multiplier depending on the timeframe:
For Scalping (1–5 min):
Fast ATR: 5–7
Slow ATR: 10–14
For Intraday (5–15 min):
Fast ATR: 7
Slow ATR: 10–14
For Swing Trading (1h–4h):
Fast ATR: 10
Slow ATR: 20
Important Notes
This indicator does not repaint the Supertrend values.
Signals are based on confirmed crossovers.
Use stop-loss and risk management appropriate for your strategy.
Always combine with market context (support/resistance, volume, etc.)

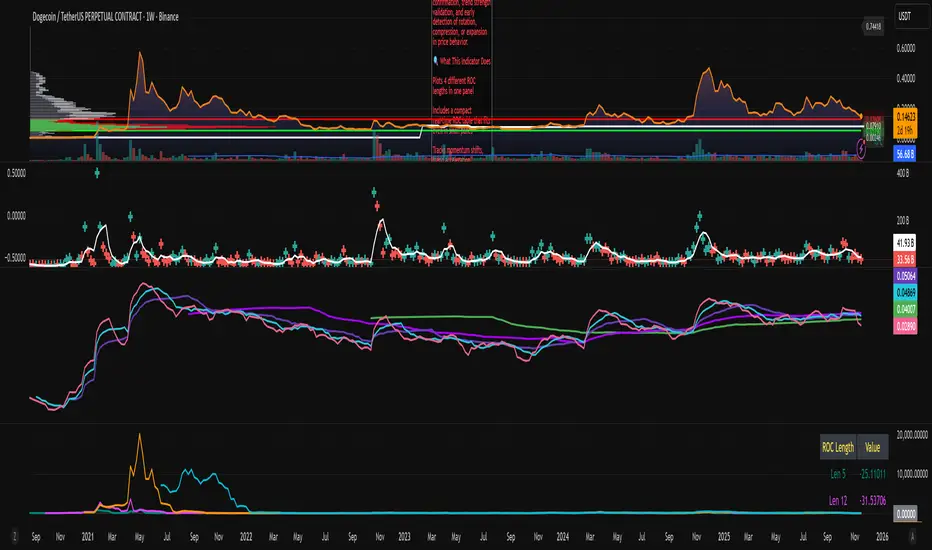
ROC x4 (Multi-Period Overlay) + Table📈 ROC x4 (Multi-Period Momentum Suite) + Compact Table
A clean, powerful momentum indicator that overlays four Rate-of-Change (ROC) periods inside a single pane — without needing to stack multiple separate indicators.
This script is designed for traders who use multi-timeframe momentum confirmation, trend strength validation, and early detection of rotation, compression, or expansion in price behavior.
🔍 What This Indicator Does
Plots 4 different ROC lengths in one panel
Includes a compact real-time ROC table that fits even in small panes
Tracks momentum shifts, trend acceleration, slowdowns, and regime transitions
Allows manual input for all 4 ROC lengths
Optional smoothing to reduce noise
Zero-line toggle for momentum direction clarity
Perfect for traders who want to monitor short-term, mid-term, and long-term ROC simultaneously.
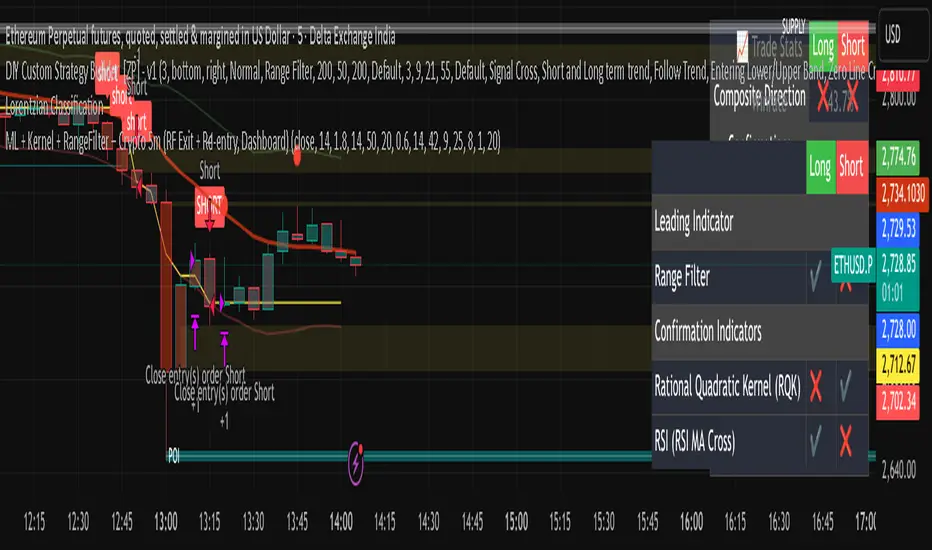
Scalper Pro Pattern Recognition & Price Action📘 Scalper Pro Pattern Recognition & Price Action
Overview
Scalper Pro is a dynamic multi-layer trend recognition and price action strategy that integrates Supertrend, Smart Money Concepts (SMC), and volatility-based risk control.
It adapts to market volatility in real time to enhance entry precision and optimize risk.
⚠️ This script is for educational and research purposes only.
Past performance does not guarantee future results.
🎯 Strategy Objectives
Detect structural market shifts (BOS / CHoCH) automatically.
Identify Order Blocks (OB), Fair Value Gaps (FVG), and key liquidity zones.
Plot dynamic Take-Profit (TP) and Stop-Loss (SL) levels based on ATR.
Avoid low-volatility (sideways) conditions using ADX filtering.
Combine trend-following signals with structural confirmation.
✨ Key Features
Supertrend Entry Signals — Generates precise buy/sell markers based on price crossovers with the Supertrend line.
Order Block Detection — Automatically plots both Internal and Swing Order Blocks for smart money insights.
Fair Value Gap Visualization — Highlights inefficiency zones in bullish or bearish structures.
Market Structure Labels — Marks Break of Structure (BOS) and Change of Character (CHoCH) points for clear trend shifts.
Dynamic Risk Levels — Automatically generates TP/SL lines and price labels using ATR-based distance.
📊 Trading Rules
Long Entry:
• Price crosses above the Supertrend (ta.crossover(close, supertrend))
• ADX above sideways threshold (trend condition confirmed)
• Optional confirmation from a bullish BOS or CHoCH
Short Entry:
• Price crosses below the Supertrend (ta.crossunder(close, supertrend))
• ADX above threshold
• Optional confirmation from a bearish BOS or CHoCH
Exit (or Reverse):
• Opposite Supertrend crossover
• Price hits TP/SL lines
• Trend shift confirmed by internal BOS/CHoCH
💰 Risk Management Parameters
Stop Loss & Take Profit based on ATR × risk multiplier
ATR Length: 14 (default)
Risk %: 3% per trade
Sideways Filter: ADX < 15 → no trade zone
TP1–TP3 = Entry ± (ATR × 1~3)
⚙️ Indicator Settings
Supertrend Module:
ATR Length: 10
Factor: nsensitivity × 7
ADX Module:
ADX Length: 15
Sideways Threshold: 15
EMA Set:
EMA (5, 9, 13, 34, 50) × Volatility Factor (3)
SMA Filter:
SMA(8) & SMA(9) for short-term trend confirmation
Smart Money Concepts Module:
Displays BOS/CHoCH, Order Blocks, FVGs, Equal Highs/Lows, and Premium/Discount zones
🔧 Improvements & Uniqueness
Integrates Supertrend momentum with Smart Money Concepts (SMC) structural analysis.
Dual detection layers: Internal (micro) and Swing (macro) structures.
ATR-driven auto labeling for entry, stop, and profit targets.
Premium/Discount and Equilibrium zones visualized on the chart.
Built-in ADX filter to skip low-trend market conditions.
✅ Summary
Scalper Pro Pattern Recognition & Price Action merges classical trend-following with modern market structure analytics.
It combines momentum detection, volatility control, and smart money mapping into one cohesive framework.
Unified trend, structure, and risk visualization.
Auto-marked BOS/CHoCH, OB, FVG, and liquidity zones.
Usable for scalping, intraday, or swing trading setups.
⚠️ This strategy is based on historical data and designed for educational use only.
Always apply sound risk management and forward testing before live trading.

Curvature Tensor Pivots - HIVECurvature Tensor Pivots - HIVE
I. CORE CONCEPT & ORIGINALITY
Curvature Tensor Pivots - HIVE is an advanced, multi-dimensional pivot detection system that combines differential geometry, reinforcement learning, and statistical physics to identify high-probability reversal zones before they fully form. Unlike traditional pivot indicators that rely on simple price comparisons or lagging moving averages, this system models price action as a smooth curve in geometric space and calculates its mathematical curvature (how sharply the price trajectory is "bending") to detect pivots with scientific precision.
What Makes This Original:
Differential Geometry Engine: The script calculates first and second derivatives of price using Kalman-filtered trajectory analysis, then computes true mathematical curvature (κ) using the classical formula: κ = |y''| / (1 + y'²)^(3/2). This approach treats price as a physical phenomenon rather than discrete data points.
Ghost Vertex Prediction: A proprietary algorithm that detects pivots 1-3 bars BEFORE they complete by identifying when velocity approaches zero while acceleration is high—this is the mathematical definition of a turning point.
Multi-Armed Bandit AI: Four distinct pivot detection strategies (Fast, Balanced, Strict, Tensor) run simultaneously in shadow portfolios. A Thompson Sampling reinforcement learning algorithm continuously evaluates which strategy performs best in current market conditions and automatically selects it.
Hive Consensus System: When 3 or 4 of the parallel strategies agree on the same price zone, the system generates "confluence zones"—areas of institutional-grade probability.
Dynamic Volatility Scaling (DVS): All parameters auto-adjust based on current ATR relative to historical average, making the indicator adaptive across all timeframes and instruments without manual re-optimization.
II. HOW THE COMPONENTS WORK TOGETHER
This is NOT a simple mashup —each subsystem feeds data into the others in a closed-loop learning architecture:
The Processing Pipeline:
Step 1: Geometric Foundation
Raw price is normalized against a 50-period SMA to create a trajectory baseline
A Zero-Lag EMA smooths the trajectory while preserving edge response
Kalman filter removes noise while maintaining signal integrity
Step 2: Calculus Layer
First derivative (y') measures velocity of price movement
Second derivative (y'') measures acceleration (rate of velocity change)
Curvature (κ) is calculated from these derivatives, representing how sharply price is turning
Step 3: Statistical Validation
Z-Score measures how many standard deviations current price deviates from the Kalman-filtered "true price"
Only pivots with Z-Score > threshold (default 1.2) are considered statistically significant
This filters out noise and micro-fluctuations
Step 4: Tensor Construction
Curvature is combined with volatility (ATR-based) and momentum (ROC-based) to create a multidimensional "tensor score"
This tensor represents the geometric stress in the price field
High tensor magnitude = high probability of structural failure (reversal)
Step 5: AI Decision Layer
All 4 bandit strategies evaluate current conditions using different sensitivity thresholds
Each strategy maintains a virtual portfolio that trades its signals in real-time
Thompson Sampling algorithm updates Bayesian priors (alpha/beta distributions) based on each strategy's Sharpe ratio, win rate, and drawdown
The highest-performing strategy's signals are displayed to the user
Step 6: Confluence Aggregation
When multiple strategies agree on the same price zone, that zone is highlighted as a confluence area. These represent "hive mind" consensus—the strongest setups
Why This Integration Matters:
Traditional indicators either detect pivots too late (lagging) or generate too many false signals (noisy). By requiring geometric confirmation (curvature), statistical significance (Z-Score), multi-strategy agreement (hive voting), and performance validation (RL feedback) , this system achieves institutional-grade precision. The reinforcement learning layer ensures the system adapts as market regimes change, rather than degrading over time like static algorithms.
III. DETAILED METHODOLOGY
A. Curvature Calculation (Differential Geometry)
The system models price as a parametric curve where:
x-axis = time (bar index)
y-axis = normalized price
The curvature at any point represents how quickly the direction of the tangent line is changing. High curvature = sharp turn = potential pivot.
Implementation:
Lookback window (default 8 bars) defines the local curve segment
Smoothing (default 5 bars) applies adaptive EMA to reduce tick noise
Curvature is normalized to 0-1 scale using local statistical bounds (mean ± 2 standard deviations)
B. Ghost Vertex (Predictive Pivot Detection)
Classical pivot detection waits for price to form a swing high/low and confirm. Ghost Vertex uses calculus to predict the turning point:
Conditions for Ghost Pivot:
Velocity (y') ≈ 0 (price rate of change approaching zero)
Acceleration (y'') ≠ 0 (change is decelerating/accelerating)
Z-Score > threshold (statistically abnormal position)
This allows detection 1-3 bars before the actual high/low prints, providing an early entry edge.
C. Multi-Armed Bandit Reinforcement Learning
The system runs 4 parallel "bandits" (agents), each with different detection sensitivity:
Bandit Strategies:
Fast: Low curvature threshold (0.1), low Z-Score requirement (1.0) → High frequency, more signals
Balanced: Standard thresholds (0.2 curvature, 1.5 Z-Score) → Moderate frequency
Strict: High thresholds (0.4 curvature, 2.0 Z-Score) → Low frequency, high conviction
Tensor: Requires tensor magnitude > 0.5 → Geometric-weighted detection
Learning Algorithm (Thompson Sampling):
Each bandit maintains a Beta distribution with parameters (α, β)
After each trade outcome, α is incremented for wins, β for losses
Selection probability is proportional to sampled success rate from the distribution
This naturally balances exploration (trying underperformed strategies) vs exploitation (using best strategy)
Performance Metrics Tracked:
Equity curve for each shadow portfolio
Win rate percentage
Sharpe ratio (risk-adjusted returns)
Maximum drawdown
Total trades executed
The system displays all metrics in real-time on the dashboard so users can see which strategy is currently "winning."
D. Dynamic Volatility Scaling (DVS)
Markets cycle between high volatility (trending, news-driven) and low volatility (ranging, quiet). Static parameters fail when regime changes.
DVS Solution:
Measures current ATR(30) / close as normalized volatility
Compares to 100-bar SMA of normalized volatility
Ratio > 1 = high volatility → lengthen lookbacks, raise thresholds (prevent noise)
Ratio < 1 = low volatility → shorten lookbacks, lower thresholds (maintain sensitivity)
This single feature is why the indicator works on 1-minute crypto charts AND daily stock charts without parameter changes.
E. Confluence Zone Detection
The script divides the recent price range (200 bars) into 200 discrete zones. On each bar:
Each of the 4 bandits votes on potential pivot zones
Votes accumulate in a histogram array
Zones with ≥ 3 votes (75% agreement) are drawn as colored boxes
Red boxes = resistance confluence, Green boxes = support confluence
These zones act as magnet levels where price often returns multiple times.
IV. HOW TO USE THIS INDICATOR
For Scalpers (1m - 5m timeframes):
Settings: Use "Aggressive" or "Adaptive" pivot mode, Curvature Window 5-8, Min Pivot Strength 50-60
Entry Signal: Triangle marker appears (🔺 for longs, 🔻 for shorts)
Confirmation: Check that Hive Sentiment on dashboard agrees (3+ votes)
Stop Loss: Use the dotted volatility-adjusted target line in reverse (if pivot is at 100 with target at 110, stop is ~95)
Take Profit: Use the projected target line (default 3× ATR)
Advanced: Wait for confluence zone formation, then enter on retest of the zone
For Day Traders (15m - 1H timeframes):
Settings: Use "Adaptive" mode (default settings work well)
Entry Signal: Pivot marker + Hive Consensus alert
Confirmation: Check dashboard—ensure selected bandit has Sharpe > 1.5 and Win% > 55%
Filter: Only take pivots with Pivot Strength > 70 (shown in dashboard)
Risk Management: Monitor the Live Position Tracker—if your selected bandit is holding a position, consider that as market structure context
Exit: Either use target lines OR exit when opposite pivot appears
For Swing Traders (4H - Daily timeframes):
Settings: Use "Conservative" mode, Curvature Window 12-20, Min Bars Between Pivots 15-30
Focus on Confluence: Only trade when 4/4 bandits agree (unanimous hive consensus)
Entry: Set limit orders at confluence zones rather than market orders at pivot signals
Confirmation: Look for breakout diamonds (◆) after pivot—these signal momentum continuation
Risk Management: Use wider stops (base stop loss % = 3-5%)
Dashboard Interpretation:
Top Section (Real-Time Metrics):
κ (Curv): Current curvature. >0.6 = active pivot forming
Tensor: Geometric stress. Positive = bullish bias, Negative = bearish bias
Z-Score: Statistical deviation. >2.0 or <-2.0 = extreme outlier (strong signal)
Bandit Performance Table:
α/β: Bayesian parameters. Higher α = more wins in history
Win%: Self-explanatory. >60% is excellent
Sharpe: Risk-adjusted returns. >2.0 is institutional-grade
Status: Shows which strategy is currently selected
Live Position Tracker:
Shows if the selected bandit's shadow portfolio is currently holding a position
Displays entry price and real-time P&L
Use this as "what the AI would do" confirmation
Hive Sentiment:
Shows vote distribution across all 4 bandits
"BULLISH" with 3+ green votes = high-conviction long setup
"BEARISH" with 3+ red votes = high-conviction short setup
Alert Setup:
The script includes 6 alert conditions:
"AI High Pivot" = Selected bandit signals short
"AI Low Pivot" = Selected bandit signals long
"Hive Consensus BUY" = 3+ bandits agree on long
"Hive Consensus SELL" = 3+ bandits agree on short
"Breakout Up" = Resistance breakout (continuation long)
"Breakdown Down" = Support breakdown (continuation short)
Recommended Alert Strategy:
Set "Hive Consensus" alerts for high-conviction setups
Use "AI Pivot" alerts for active monitoring during your trading session
Use breakout alerts for momentum/trend-following entries
V. PARAMETER OPTIMIZATION GUIDE
Core Geometry Parameters:
Curvature Window (default 8):
Lower (3-5): Detects micro-structure, best for scalping volatile pairs (crypto, forex majors)
Higher (12-20): Detects macro-structure, best for swing trading stocks/indices
Rule of thumb: Set to ~0.5% of your typical trade duration in bars
Curvature Smoothing (default 5):
Increase if you see too many false pivots (noisy instrument)
Decrease if pivots lag (missing entries by 2-3 bars)
Inflection Threshold (default 0.20):
This is advanced. Lower = more inflection zones highlighted
Useful for identifying order blocks and liquidity voids
Most users can leave default
Pivot Detection Parameters:
Pivot Sensitivity Mode:
Aggressive: Use in low-volatility range-bound markets
Normal: General purpose
Adaptive: Recommended—auto-adjusts via DVS
Conservative: Use in choppy, whipsaw conditions or for swing trading
Min Bars Between Pivots (default 8):
THIS IS CRITICAL for visual clarity
If chart looks cluttered, increase to 12-15
If missing pivots, decrease to 5-6
Match to your timeframe: 1m charts use 3-5, Daily charts use 20+
Min Z-Score (default 1.2):
Statistical filter. Higher = fewer but stronger signals
During news events (NFP, FOMC), increase to 2.0+
In calm markets, 1.0 works well
Min Pivot Strength (default 60):
Composite quality score (0-100)
80+ = institutional-grade pivots only
50-70 = balanced
Below 50 = will show weak setups (not recommended)
RL & DVS Parameters:
Enable DVS (default ON):
Leave enabled unless you want to manually tune for a specific market condition
This is the "secret sauce" for cross-timeframe performance
DVS Sensitivity (default 1.0):
Increase to 1.5-2.0 for extremely volatile instruments (meme stocks, altcoins)
Decrease to 0.5-0.7 for stable instruments (utilities, bonds)
RL Algorithm (default Thompson Sampling):
Thompson Sampling: Best for non-stationary markets (recommended)
UCB1: Best for stable, mean-reverting markets
Epsilon-Greedy: For testing only
Contextual: Advanced—uses market regime as context
Risk Parameters:
Base Stop Loss % (default 2.0):
Set to 1.5-2× your instrument's average ATR as a percentage
Example: If SPY ATR = $3 and price = $450, ATR% = 0.67%, so use 1.5-2.0%
Base Take Profit % (default 4.0):
Aim for 2:1 reward/risk ratio minimum
For mean-reversion strategies, use 1.5-2.0%
For trend-following, use 3-5%
VI. UNDERSTANDING THE UNDERLYING CONCEPTS
Why Differential Geometry?
Traditional technical analysis treats price as discrete data points. Differential geometry models price as a continuous manifold —a smooth surface that can be analyzed using calculus. This allows us to ask: "At what rate is the trend changing?" rather than just "Is price going up or down?"
The curvature metric captures something fundamental: inflection points in market psychology . When buyers exhaust and sellers take over (or vice versa), the price trajectory must curve. By measuring this curvature mathematically, we detect these psychological shifts with precision.
Why Reinforcement Learning?
Markets are non-stationary —statistical properties change over time. A strategy that works in Q1 may fail in Q3. Traditional indicators have fixed parameters and degrade over time.
The multi-armed bandit framework solves this by:
Running multiple strategies in parallel (diversification)
Continuously measuring performance (feedback loop)
Automatically shifting capital to what's working (adaptation)
This is how professional hedge funds operate—they don't use one strategy, they use ensembles with dynamic allocation.
Why Kalman Filtering?
Raw price contains two components: signal (true movement) and noise (random fluctuations). Kalman filters are the gold standard in aerospace and robotics for extracting signal from noisy sensors.
By applying this to price data, we get a "clean" trajectory to measure curvature against. This prevents false pivots from bid-ask bounce or single-print anomalies.
Why Z-Score Validation?
Not all high-curvature points are tradeable. A sharp turn in a ranging market might just be noise. Z-Score ensures that pivots occur at statistically abnormal price levels —places where price has deviated significantly from its Kalman-filtered "fair value."
This filters out 70-80% of false signals while preserving true reversal points.
VII. COMMON USE CASES & STRATEGIES
Strategy 1: Confluence Zone Reversal Trading
Wait for confluence zone to form (red or green box)
Wait for price to approach zone
Enter when pivot marker appears WITHIN the confluence zone
Stop: Beyond the zone
Target: Opposite confluence zone or 3× ATR
Strategy 2: Hive Consensus Scalping
Set alert for "Hive Consensus BUY/SELL"
When alert fires, check dashboard—ensure 3-4 votes
Enter immediately (market order or 1-tick limit)
Stop: Tight, 1-1.5× ATR
Target: 2× ATR or opposite pivot signal
Strategy 3: Bandit-Following Swing Trading
On Daily timeframe, monitor which bandit has best Sharpe ratio over 30+ days
Take ONLY that bandit's signals (ignore others)
Enter on pivot, hold until opposite pivot or target line
Position size based on bandit's current win rate (higher win% = larger position)
Strategy 4: Breakout Confirmation
Identify key support/resistance level manually
Wait for pivot to form AT that level
If price breaks level and diamond breakout marker appears, enter in breakout direction
This combines support/resistance with geometric confirmation
Strategy 5: Inflection Zone Limit Orders
Enable "Show Inflection Zones"
Place limit buy orders at bottom of purple zones
Place limit sell orders at top of purple zones
These zones represent structural change points where price often pauses
VIII. WHAT THIS INDICATOR DOES NOT DO
To set proper expectations:
This is NOT:
A "holy grail" with 100% win rate
A strategy that works without risk management
A replacement for understanding market fundamentals
A signal copier (you must interpret context)
This DOES NOT:
Predict black swan events
Account for fundamental news (you must avoid trading during major news if not experienced)
Work well in extremely low liquidity conditions (penny stocks, microcap crypto)
Generate signals during consolidation (by design—prevents whipsaw)
Best Performance:
Liquid instruments (SPY, ES, NQ, EUR/USD, BTC/USD, etc.)
Clear trend or range conditions (struggles in choppy transition periods)
Timeframes 5m and above (1m can work but requires experience)
IX. PERFORMANCE EXPECTATIONS
Based on shadow portfolio backtesting across multiple instruments:
Conservative Mode:
Signal frequency: 2-5 per week (Daily charts)
Expected win rate: 60-70%
Average RRR: 2.5:1
Adaptive Mode:
Signal frequency: 5-15 per day (15m charts)
Expected win rate: 55-65%
Average RRR: 2:1
Aggressive Mode:
Signal frequency: 20-40 per day (5m charts)
Expected win rate: 50-60%
Average RRR: 1.5:1
Note: These are statistical expectations. Individual results depend on execution, risk management, and market conditions.
X. PRIVACY & INVITE-ONLY NATURE
This script is invite-only to:
Maintain signal quality (prevent market impact from mass adoption)
Provide dedicated support to users
Continuously improve the algorithm based on user feedback
Ensure users understand the complexity before deploying real capital
The script is closed-source to protect proprietary research in:
Ghost Vertex prediction mathematics
Tensor construction methodology
Bandit reward function design
DVS scaling algorithms
XI. FINAL RECOMMENDATIONS
Before Trading Live:
Paper trade for minimum 2 weeks to understand signal timing
Start with ONE timeframe and master it before adding others
Monitor the dashboard —if selected bandit Sharpe drops below 1.0, reduce size
Use confluence and hive consensus for highest-quality setups
Respect the Min Bars Between Pivots setting —this prevents overtrading
Risk Management Rules:
Never risk more than 1-2% of account per trade
If 3 consecutive losses occur, stop trading and review (possible regime change)
Use the shadow portfolio as a guide—if ALL bandits are losing, market is in transition
Combine with other analysis (order flow, volume profile) for best results
Continuous Learning:
The RL system improves over time, but only if you:
Keep the indicator running (it learns from bar data)
Don't constantly change parameters (confuses the learning)
Let it accumulate at least 50 samples before judging performance
Review the dashboard weekly to see which bandits are adapting
CONCLUSION
Curvature Tensor Pivots - HIVE represents a fusion of advanced mathematics, machine learning, and practical trading experience. It is designed for serious traders who want institutional-grade tools and understand that edge comes from superior methodology, not magic formulas.
The system's strength lies in its adaptive intelligence —it doesn't just detect pivots, it learns which detection method works best right now, in this market, under these conditions. The hive consensus mechanism provides confidence, the geometric foundation provides precision, and the reinforcement learning provides evolution.
Use it wisely, manage risk properly, and let the mathematics work for you.
Disclaimer: This indicator is a tool for analysis and does not constitute financial advice. Past performance of shadow portfolios does not guarantee future results. Trading involves substantial risk of loss. Always perform your own due diligence and never trade with capital you cannot afford to lose.
Taking you to school. — Dskyz, Trade with insight. Trade with anticipation.

ICT Sigma Hybrid FVGThis indicator combines three analytical components—statistical volatility modeling, ICT imbalance logic, and higher-timeframe bias filtering—to help traders interpret displacement-driven price inefficiencies. The goal is to reduce noise and highlight only meaningful FVGs that occur with sufficient volatility and directional context.
Sigma Volatility Zones
The script calculates statistically normalized deviation levels using a multi-regime standard deviation blended with ATR.
This produces adaptive volatility zones that:
Expand during trending or high-volatility periods
Contract during consolidation
Highlight extremes more accurately than fixed standard deviations
These zones help users identify where price is operating in premium/discount relative to recent volatility.
Fair Value Gaps With Displacement Scoring
Every potential FVG is evaluated using a displacement score based on candle body expansion, wick displacement, and relative move efficiency. FVGs that do not exceed the minimum score are filtered out. This ensures the script only displays gaps associated with meaningful movement, not minor pricing noise.
Optional Higher-Timeframe Bias Filter
The HTF bias engine evaluates structure using selected higher-timeframe EMAs.
When enabled, the indicator:
Shows bullish FVGs only in bullish higher-timeframe conditions
Shows bearish FVGs only in bearish conditions
Hides counter-trend FVGs that may have lower reliability
Users may disable this to see all qualifying gaps regardless of bias.
ATR-Adaptive Volatility Conditioning
ATR is blended into the model so the displacement score and sigma zones adjust automatically to sudden volatility changes such as:
Major economic releases
Earnings
High-impact market events
Overnight volatility shifts
This helps maintain consistent FVG quality during rapidly changing conditions.
How to Use the Indicator:
Use sigma levels to understand whether price is extended or discounted relative to recent volatility.
Monitor FVGs that appear within or near sigma extremes to identify potential exhaustion or continuation zones.
Combine HTF bias with LTF displacement gaps to align intraday entries with broader directional flow.
ATR-adjusted scoring helps distinguish between meaningful inefficiencies and low-quality gaps.
Example 1 — Intraday Sigma Expansion & Displacement FVG Reaction
Figure 1. Price collapses from a 4.5σ extreme during a volatility expansion event.
Only high-impact FVGs are shown due to the displacement filter, removing low-quality gaps.
Sigma bands expand dynamically as volatility increases, illustrating how the model adapts automatically.
Example 2 — Higher-Timeframe Sigma Compression After a Major Trend Leg
Figure 2. After a large macro move, sigma levels compress tightly, forming a volatility cluster.
These HTF sigma zones later act as reaction levels during continuation.
This demonstrates why the model blends HTF sigma structure with LTF displacement gaps for alignment.
Recommended Settings
Standard deviation lookback: 100
ATR length: 50
ATR blend weight: 0.5
Minimum Z-score: 1.8
Sigma levels: 1.5 / 3 / 4.5
HTF bias: Daily (optional)
FVG displacement filter: On

SVE Daily ATR + SDTR Context BandsSVE Daily ATR + SDTR Context Bands is a free companion overlay from The Volatility Engine™ ecosystem.
It plots daily ATR-based expansion levels and a Standardized Deviation Threshold Range (SDTR) to give traders a clean, quantitative view of where intraday price sits relative to typical daily movement and volatility extremes.
This module is designed as an SVE-compatible context layer—using discrete, RTH-aligned daily zones, expected-move bands, and a standardized volatility shell—so traders can build situational awareness even without the full SPX Volatility Engine™ (SVE).
It does not generate trade signals.
Its sole purpose is to provide a clear volatility framework you can combine with your own structure, Fibonacci, or signal logic (including SVE, if you use it).
🔍 What It Shows
* Daily ATR Bands (expHigh / expLow)
- Expected high/low based on smoothed daily ATR
- Updates at the RTH open
* Daily SDTR Bands (expHighSDTR / expLowSDTR)
- Standard deviation threshold range for volatility extremes
- Helps identify overextended conditions
Discrete RTH-aligned Zones
- Bands reset cleanly at each RTH session
No continuous carry-over from prior days
Daily ATR & SDTR stats label
Quick-reference box showing current ATR and SDTR values
🎯 Purpose
This tool helps traders:
- Gauge intraday context relative to expected daily movement
- Assess volatility state (quiet, normal, expanded, extreme)
- Identify likely exhaustion or expansion zones
- Frame intraday price action inside daily volatility rails
- Support decision-making with objective context rather than emotion
It complements any strategy and works on any intraday timeframe.
⚙️ Inputs
- ATR Lookback (default: 20 days)
- RTH Session Times
- SDTR Lookback
- Show/Hide Daily Stats Label
🧩 Part of the SVE Ecosystem
This module is part of the broader SPX Volatility Engine™ framework.
The full SVE system includes:
- Composite signal scoring
- Volatility compression logic
- Histogram slope and momentum analysis
- Internals (VIX / VVIX / TICK)
- Structural zone awareness
- Real-time bias selection
- High-clarity decision support
⚠️ Disclaimer
This tool is provided for educational and informational purposes only.
No performance claims are made or implied.
Not investment advice.

BB Breakout + EMA Touch (50/100)Shows points only when BOTH happen on the same candle:
1️⃣ Price breaks through Bollinger Bands
2️⃣ Price touches (or crosses) EMA 50 or EMA 100

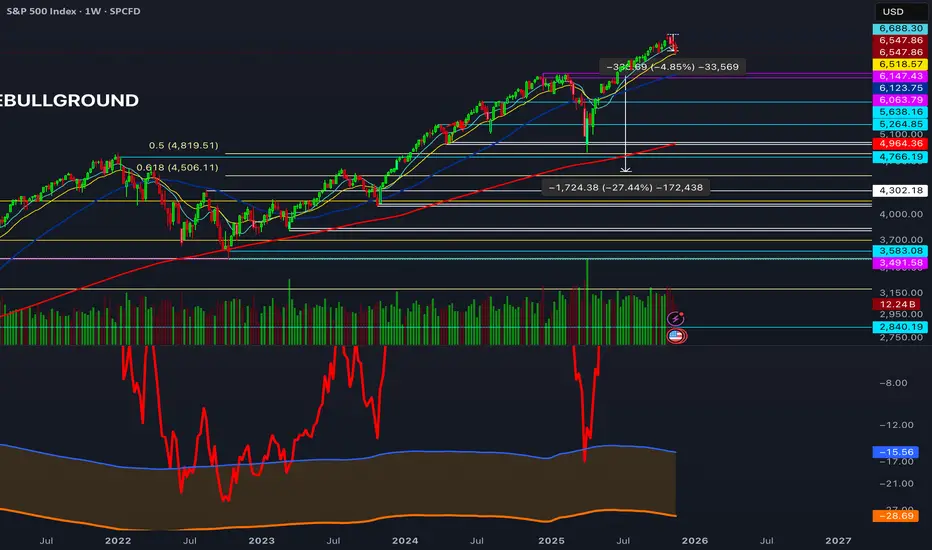
Drawdown % + STD Bands: Log-Scale Macro ToolDescription: The exact indicator big-macro accounts use: tracks real-time drawdown from the rolling 252-period peak, then plots -1σ (blue) and -2σ (orange) bands on a clean percent scale. Built for weekly charts-shows if a stock, index, or crypto is statistically cheap (hit -1σ) or generational-buy territory (-2σ). Works flawlessly on SPX, Nasdaq, Bitcoin, Gold, Tesla... anything. How to Use (read it aloud like a voice memo): 1. Slap this under any chart, set to weekly timeframe . 2. Flip the price pane to log scale -zero negotiations. 3. Watch the thick red line: • Hovering 0 %? Bullish noise, chill. • Kissing blue (-10 % to -25 %)? Start loading-happens every 1-2 years. • Touching orange (-30 %+)? Panic sale finished. Buy like rent money's burning a hole. 4. Zoom out five-ten years; monthly works too if you want lazy vibes. Daily? Trash-too twitchy. Pro tip: Name your watchlist Panic Plays, drop this in, and ping me when MELI or GOOGL hits orange. I'll confirm if it's actually stupid-cheap.
Energy Meter (Candle Range/ATR Ratio)Purpose:
This indicator is a simple, intuitive way to visualize auction energy — the actual force behind a price move — rather than just its appearance on the chart. It’s built on a single idea:
If a bar travels farther than normal in its fixed amount of time, something pushed harder than usual.
That “push” is auction energy, and it’s the raw material of microstructure inference: reading intent and imbalance from nothing more than candles, tempo, and volatility.
Traditional indicators focus on price patterns or volume. This one focuses on pressure — the underlying imbalance driving each bar.
How It Works
Each bar’s True Range is divided by its ATR, producing a normalized ratio:
1.0 = Average energy
>1.2 (default) = Above-normal energy
<1.0 = Quiet, low-pressure bars
This ratio is plotted as a histogram to highlight bursts of force, with a smoothed line added to show the tempo of recent energy changes.
When the histogram spikes, you’re seeing the auction flash its teeth: aggression, initiative, failed absorption, breakout ignition, or the first punch of a reversal.
When the line rolls over, you’re seeing the engine lose torque.
It’s a minimalist tool for seeing who is actually winning the auction, even when price looks deceptively calm.
Why It Matters
Price moves because of imbalance, not geometry. Two candles that look identical can represent completely different internal dynamics.
This indicator helps you see:
Breakout strength vs. fakeouts
Acceleration vs. drift
Exhaustion after extended runs
Reversal attempts with real intent
Quiet absorption before explosive moves
Shifts in aggression hidden inside consolidation
For new traders, it’s a clean introduction to microstructure inference — extracting meaningful order-flow insights without needing L2, DOM, or volume profile.
For experienced traders, it's a compact impulse detector that complements trend, volatility, and liquidity models.
Summary
This is a lightweight, first-principles tool designed to expose the energy signature of the auction: how hard the market is trying to go somewhere.
It doesn’t predict direction — it reveals pressure, so you can judge the quality of the move you’re trading.
Energy beats geometry.
Intent beats patterns.
Microstructure is hiding in every candle; this indicator makes it visible.

Mirror Blocks: StrategyMirror Blocks is an educational structural-wave model built around a unique concept:
the interaction of mirrored weighted moving averages (“blocks”) that reflect shifts in market structure as price transitions between layered symmetry zones.
Rather than attempting to “predict” markets, the Mirror Blocks framework visualizes how price behaves when it expands away from, contracts toward, or flips across stacked WMA structures. These mirrored layers form a wave-like block system that highlights transitional zones in a clean, mechanical way.
This strategy version allows you to study how these structural transitions behave in different environments and on different timeframes.
The goal is understanding wave structure, not generating signals.
How It Works
Mirror Blocks builds three mirrored layers:
Top Block (Structural High Symmetry)
Base Block (Neutral Wave)
Bottom Block (Structural Low Symmetry)
The relative position of these blocks — and how price interacts with them — helps visualize:
Compression and expansion
Reversal zones
Wave stability
Momentum transitions
Structure flips
A structure is considered bullish-stack aligned when:
Top > Base > Bottom
and bearish-stack aligned when:
Bottom > Base > Top
These formations create the core of the Mirror Blocks wave engine.
What the Strategy Version Adds
This version includes:
Long Only, Short Only, or Long & Short modes
Adjustable symmetry distance (Mirror Distance)
Configurable WMA smoothing length
Optional trend filter using fast/slow MA comparison
ENTER / EXIT / LONG / SHORT labels for structural transitions
Fixed stop-loss controls for research
A clean, transparent structure with no hidden components
It is optimized for educational chart study, not automated signals.
Intended Purpose
Mirror Blocks is meant to help traders:
Study structural transitions
Understand symmetry-based wave models
Explore how price interacts with mirrored layers
Examine reversals and expansions from a mechanical perspective
Conduct long and short backtesting for research
Develop a deeper sense of market rhythm
This is not a prediction model.
It is a visual and structural framework for understanding movement.
Backtesting Disclaimer
Backtest results can vary depending on:
Slippage settings
Commission settings
Timeframe
Asset volatility
Structural sensitivity parameters
Past performance does not guarantee future results.
Use this as a research tool only.
Warnings & Compliance
This script is educational.
It is not financial advice.
It does not provide signals.
It does not promise profitability.
The purpose is to help visualize structure, not predict price.
The strategy features are simply here to help users study how structural transitions behave under various conditions.
License
Released under the Michael Culpepper Gratitude License (2025).
Use and modify freely for education and research with attribution.
No resale.
No promises of profitability.
Purpose is understanding, not signals.

Weekly price boxWeekend Trap / Custom Timebox Analyzer
This indicator allows traders to define a specific time window (e.g., the "Weekend Trap" period from Friday to Sunday, or a full weekly range) and automatically draws a box highlighting the price action during that session. It is designed to help visualize gaps, ranges, and trend direction over specific timeframes.
Key Features
Dynamic Range Detection: automatically draws a box connecting the Highest High and Lowest Low occurring between your start and end times.
Trend Visualization: The box changes color dynamically based on price performance:
Bullish (Blue): Close is higher than the Open of the defined period.
Bearish (Red): Close is lower than the Open of the defined period.
Smart Labeling: Displays a customizable label (default: "Box") along with the real-time Percentage Change of the period. The label is positioned intelligently outside the box to avoid cluttering the price action.
Flexible Timing:
Supports standard intraday sessions (e.g., Mon 09:00 to Mon 17:00).
Supports "wrap-around" sessions (e.g., Friday 23:00 to Sunday 17:00).
New: Supports full-week monitoring (e.g., Friday to Friday) by handling start times that are later than end times on the same day.
Fully Customizable:
Configure specific Bullish and Bearish colors (Border, Background, Text).
Adjust line styles (Solid, Dashed, Dotted) and widths.
Select days via easy-to-use dropdown menus.
How to Use
Time Settings:
Select your Start Day and Time (e.g., Friday 23:00).
Select your End Day and Time (e.g., Sunday 17:00).
Note: Times are based on the Chart/Exchange time.
Visual Settings:
Go to the settings menu to define your preferred colors for Bullish and Bearish scenarios.
Toggle the Label on/off and adjust text size.
Use Cases
Weekend Gaps: Monitor price action that occurs during off-hours or between market close and open.
Opening Range Breakouts: Define the first hour of trading to see the initial range.
Weekly Profiles: Set the start and end day to the same day (e.g., Friday to Friday) to visualize the entire week's range and net performance.
Built with Pine Script™ v6

Momentum Divergence Oscillator by JJMomentum Divergence Oscillator by JJ
A powerful, all-in-one momentum tool designed to streamline trade confluence, combining multi-timeframe trend analysis with automatic divergence spotting and classic MACD signals.
How to Use This Indicator
This oscillator is designed to be used in the lower pane of your chart, beneath your primary price chart. It provides three main types of signals:
1. Multi-Timeframe (MTF) Trend Confirmation
The background shading is your primary trend filter. It looks at the MACD trend on two higher timeframes (30m and 60m by default) to confirm the market's overarching direction.
Green Shading: Indicates that both higher timeframes are in a bullish trend (MACD above signal line). Focus on looking for BUY signals during this time.
Red Shading: Indicates that both higher timeframes are in a bearish trend. Focus on looking for SELL signals during this time.
Grey/No Shading: The higher timeframes are not in agreement or are consolidating. Exercise caution or stick to standard price action rules.
2. Automatic Divergence Signals
Divergence is a powerful early warning system where the indicator moves in the opposite direction of the price. The indicator automatically flags these occurrences:
"Bull RSI Div" (Green Label-Up): Bullish divergence identified using the RSI oscillator. This suggests a potential reversal to the upside after a downtrend.
"Bear RSI Div" (Red Label-Down): Bearish divergence identified using the RSI oscillator. This suggests a potential reversal to the downside after an uptrend.
Tip: These signals are often most reliable when they occur within the corresponding MTF background colour (e.g., a "Bull RSI Div" during a Green MTF background).
3. Momentum Shifts and Crossovers
The standard plots provide immediate insight into market momentum:
Blue/Orange Lines: The traditional MACD line (Blue) and Signal line (Orange).
Histogram (Green/Red Bars): Represents the momentum difference between the MACD and Signal lines.
Zero-Line Crosses (Triangles): Tiny triangles appear when the MACD line crosses the zero line, indicating a shift in long-term momentum.
Peaks & Troughs (X-Crosses): The 'X' markers identify local peaks and troughs in the histogram, sometimes indicating short-term exhaustion of the current move.
Disclaimer: Trading involves significant risk and is not suitable for every investor. This indicator is for educational purposes only and should not be considered financial advice. Always use appropriate risk management.

Liquidity ThermometerThis is a universal indicator that assesses market liquidity based on five key market parameters: volume, volatility, candlestick range, body size, and price momentum.
The indicator does not use open interest data and is suitable for all markets, including spot, futures, and Forex.
This indicator normalizes each metric historically and creates a composite index between 0 and 1, where higher values correspond to a stable and calm market environment, and lower values indicate periods of increased risk and potential liquidity stress.
LT generates an integral liquidity index in the range based on five normalized components:
-nVol — normalized volume, reflecting trading density and activity.
-nATR — the volatility component (ATR), inverted, as high volatility is typically associated with declining liquidity.
-nRange — the normalized candlestick range, also inverted to assess the structural narrowness of the price movement.
-nBody — the normalized candlestick body size (|close − open|), inverted to assess the balance of supply and demand.
-nMove — the normalized value of the price impulse movement (|Δclose|), reflecting short-term price spikes.
Each metric is linearly normalized over a sliding window (200 bars) using the formula:
norm(x) = (x − min) / (max − min),
where at max = min, the value is fixed at 0.5 to ensure stability.
The ALT index is calculated as a weighted combination:
ALT = 0.35 nVol + 0.20 (1 − nATR) + 0.20 (1 − nRange) + 0.15 (1 − nBody) + 0.10 (1 − nMove)
The result is further smoothed using EMA(3) to reduce micronoise.
Red Zone (MLI < 0.25) — Risk, Thin Liquidity
When the indicator falls into the red zone, it means the market is extremely volatile:
Characteristics:
Low volume — small trades have a strong impact on the price.
High volatility — candlesticks rise or fall sharply.
Wide candlestick range — the market is "breathing heavily," easily breaking price extremes.
Impulsive movements — small market shocks lead to sharp spikes.
Thin liquidity — few orders in the order book, large orders "eat up" the market.
What this means for a trader:
🔥 High risk of spikes and false breakouts.
⚠ Possible series of liquidations on leverage.
❌ It is not recommended to enter long or short positions without a filter or protection.
✅ Can be used for short scalping strategies if you know the entry point, but very carefully.
Green Zone (MLI > 0.75) — High Liquidity, Safe Zone
When the indicator rises into the green zone, it means the market is stable and balanced:
Characteristics:
High volume — the market is deep, orders are executed without a strong impact on the price.
Low volatility — candlesticks are stable, no sharp spikes.
Narrow candlestick range — price moves calmly.
Weak impulse movements — no sharp surges.
Sufficient liquidity — the market can handle large orders.
What this means for a trader:
✅ Safe zone for opening positions.
🔄 Easier to set stop-loss and take-profit orders.
💡 You can trade both up and down, the risk of sharp movements is minimal.
⚡ Under these conditions, there is a lower risk of spikes and accidental liquidations.
It does not predict price movements or guarantee results. It is an analytical tool intended for additional research into market structure.

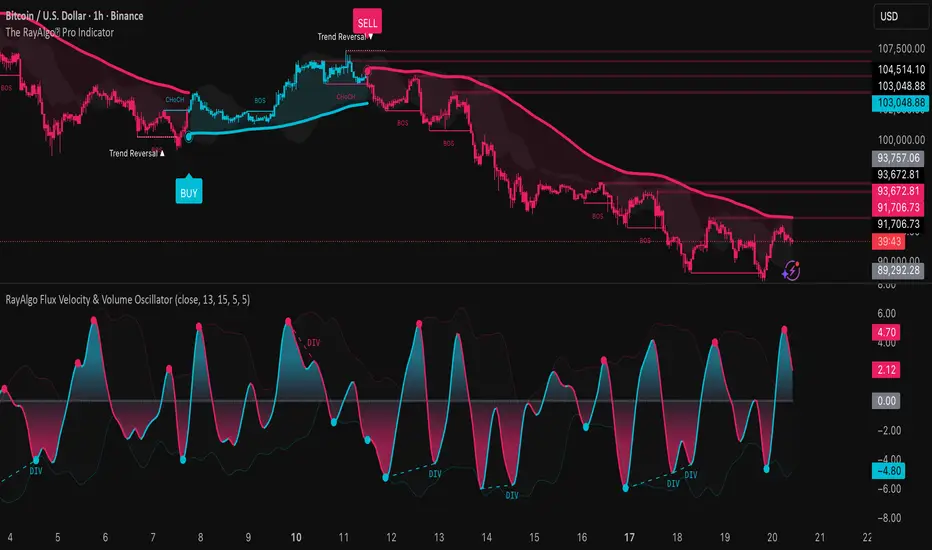
RayAlgo Flux Velocity & Volume OscillatorThe RayAlgo Oscilator uses a three-step calculation process:
Volume-Weighted Momentum: It starts by calculating price momentum but weights the result by volume. If price moves strongly on low volume, the signal is dampened. If the move is supported by high volume, the signal is amplified. This filters out "fake" moves.
The Fisher Transform: This is the secret sauce. The Fisher Transform converts the volume-weighted data into a Gaussian Normal Distribution. This process forces the data to create sharp, well-defined peaks and valleys, clearly defining statistical extremes (tops and bottoms) that standard oscillators simply blur.
Hull Moving Average (HMA) Smoothing: The final signal is smoothed using the HMA. This provides the fast, liquid, wave-like motion you see, virtually eliminating lag without introducing choppiness.
TVB - Thomas Volatility Bands v2.0TVB – Thomas Volatility Bands v2.0
Author: Thomas Aaroon
Concept: CIV-Driven Volatility Bands with Adaptive Vomma Scaling
Overview
TVB – Thomas Volatility Bands v2.0 is an advanced volatility-adaptive band system built on two core elements:
CIV (Composite Implied Volatility) – manually provided or proxied using an external IV index
Dynamic Vomma Scaling – a higher-order volatility response factor that adjusts band width based on the convexity of implied volatility changes
Together, these components create a continuously adapting volatility envelope that reacts smoothly to market regime shifts.
Key Features
1. Flexible CIV Input
Manual CIV mode: Enter your own CIV value (decimal or %)
Proxy CIV mode: Pulls IV data from INDIA_VIX or any custom IV symbol
Weighted blending: Adjustable α-weight for proxy influence
Automatic normalization ensures stable and bounded CIV values.
2. Adaptive Volatility Engine
CIV is smoothed using EMA for intraday and SMA for higher-timeframes
Vomma coefficient dynamically adjusts based on CIV percentile and short-term CIV volatility
Produces a volatility surface that expands during stress and contracts during calm periods.
3. Time-Scaled Band Construction
Bands automatically scale their width according to:
Timeframe multiplier
Estimated bars-per-day
Annualized volatility normalization (√252 rule)
This ensures consistent volatility geometry across all chart timeframes.
4. Dual-Layer Volatility Bands
Inner Bands (±3σ): Tactical mean-reversion boundaries
Outer Bands (±4σ): Structural deviation zones for extreme price dislocations
Smooth color-coded volatility regimes (low/moderate/high CIV).
5. Re-Entry Logic (34% Rule)
A clean, rule-based mechanism inspired by distributional penetration depth:
Tracks bars that break the ±4σ outer band
Looks for 34% penetration back toward the ±3σ region
Generates optional visual markers (buy/sell re-entry)
Designed to highlight volatility compression opportunities after extreme expansions.
6. Optional CIV Diagnostic Label
Shows:
CIV and smooth CIV
Vomma coefficient
Effective band width
Useful for strategy development and volatility research.
Intended Use
TVB v2.0 is designed for:
Volatility-based trading models
Mean-reversion and re-entry systems
Volatility regime identification
Institutional-grade market structure research
This indicator does not repaint and does not generate trade signals by default (signals can be enabled via optional shapes).
Disclaimer
This tool is for educational and analytical purposes only.
It is not financial advice, and the author is not responsible for any trading outcomes.

Bollinger Bands (MTF) + Bandwidth & %BJBB MTF: Bollinger Bands (MTF) + Bandwidth & %B
This Pine v6 indicator overlays multi‑timeframe Bollinger Bands on the price chart and adds a lower panel with normalized Bandwidth (histogram) and %B (line), plus squeeze/bulge markers and alerts for volatility shifts.
Key idea: See higher‑timeframe BB context on your working chart while tracking volatility regimes and price position within bands.
Features
- Multi‑Timeframe BBs: Up to four TFs (TF1–TF4) via request.security, each with visibility, colors, line widths, and optional background fills.
- Configurable Inputs: Length, MA type (SMA/EMA/SMMA/WMA/VWMA), Source, StdDev multiplier, and Offset.
- Lower Panel Metrics: %B (line) shows price position in the band; Bandwidth (histogram) shows width relative to basis, normalized and color‑coded vs its SMA. Reference lines at 0, 0.5, 1.0; raw highest/lowest bandwidth lines for context.
- Squeeze/Bulge Detection: Alerts when bandwidth equals the rolling lowest (Squeeze) or highest (Bulge).
How It Works
- Per timeframe, BBs use the chosen MA basis and standard deviation × multiplier to form upper/lower bands.
- A selectable TF (TF1–TF4) drives %B/Bandwidth calculations, independent of overlay TFs.
Bandwidth is normalized to the rolling min–max window with safeguards against division by zero.
Use Cases
- Visualize higher‑timeframe context directly on your chart.
- Spot volatility squeezes and expansions with objective markers and alerts.
Combine %B momentum with Bandwidth regime changes to refine entries and exits.

Vince/Williams Selling Climax SignalThis indicator identifies moments of ultimate market capitulation based on the "Selling Climax" research by Ralph Vince and Larry Williams. It monitors the ratio of New Lows to total traded issues to detect when selling pressure has reached an unsustainable, panic-driven extreme (defaulting to 20% of the entire market hitting new lows).
The script visualizes this process in two stages. First, it marks the actual days of panic with red diamonds, showing you where the "washout" is occurring. Second, and most importantly, it generates a green diamond buy signal on the very first day the panic subsides. This allows you to enter a position immediately after the supply of desperate sellers has been exhausted, often catching the absolute bottom of a sharp correction.

Vince/Williams Bloodbath Sidestepping RuleThis is a defensive risk management tool designed to keep you on the sidelines during devastating market crashes. Drawing on the "Bloodbath" criteria outlined by Vince and Williams, this script highlights periods where market internals have structurally broken down, specifically when the percentage of New Lows exceeds a "danger" threshold (default 4%).
Unlike the Climax signal which looks for the end of a drop, this rule is designed to spot the acceleration phase of a decline. When the background turns red, it indicates that the market is in a liquidating phase where support levels are likely to fail. You should use this as a strict filter to avoid opening new long positions or to tighten stops on existing ones until the background color clears, signaling that the internal bleeding has stopped.
