ATR Based Stoploss LineThis indicator dynamically plots a horizontal stop-loss level using an RMA-based Average True Range (ATR). The stop value is calculated from the current closing price minus ATR (with optional multiplier) to provide a systematic risk reference during active price movement. A fixed line extends across recent bars for clear visualization, with the stop-loss price displayed at the midpoint of that line for intuitive charting. This tool should be strictly used for breakout environments, aligned with your risk management protocol, and always confirmed with volume analysis before execution. The intent is to drive disciplined entries, strengthen downside protection, and support robust trade management in volatile market conditions.
ความผันผวน

Hierarchical Hidden Markov ModelHierarchical Hidden Markov Models (HHMMs) are an advanced version of standard Hidden Markov Models (HMMs). While HMMs model systems with a single layer of hidden states, each transitioning to other states based on fixed probabilities, HHMMs introduce multiple layers of hidden states. This hierarchical structure allows for more complex and nuanced modeling of systems, making HHMMs particularly useful in representing systems with nested states or regimes. In HHMMs, the hidden states are organized into levels, where each state at a higher level is defined by a set of states at a lower level. This nesting of states enables the model to capture longer-term dependencies in the time series, as each state at a higher level can represent a broader regime, and the states within it can represent finer sub-regimes. For example, in financial markets, a high-level state might represent a general market condition like high volatility, while the nested lower-level states could represent more specific conditions such as trending or oscillating within the high volatility regime.
The hierarchical nature of HHMMs is facilitated through the concept of termination probabilities. A termination probability is the probability that a given state will stop emitting observations and transition control back to its parent state. This mechanism allows the model to dynamically switch between different levels of the hierarchy, thereby modeling the nested structure effectively. Beside the transition, emission and initial probabilities that generally define a HMM, termination probabilities distinguish HHMMs from HMMs because they define when the process in a sub-state concludes, allowing the model to transition back to the higher-level state and potentially move to a different branch of the hierarchy.
In financial markets, HHMMs can be applied similiarly to HMMs to model latent market regimes such as high volatility, low volatility, or neutral, along with their respective sub-regimes. By identifying the most likely market regime and sub-regime, traders and analysts can make informed decisions based on a more granular probabilistic assessment of market conditions. For instance, during a high volatility regime, the model might detect sub-regimes that indicate different types of price movements, helping traders to adapt their strategies accordingly.
MODEL FIT:
By default, the indicator displays the posterior probabilities, which represent the likelihood that the market is in a specific hidden state at any given time, based on the observed data and the model fit. These posterior probabilities strictly represent the model fit, reflecting how well the model explains the historical data it was trained on. This model fit is inherently different from out-of-sample predictions, which are generated using data that was not included in the training process. The posterior probabilities from the model fit provide a probabilistic assessment of the state the market was in at a particular time based on the data that came before and after it in the training sequence. Out-of-sample predictions, on the other hand, offer a forward-looking evaluation to test the model's predictive capability.
MODEL TESTING:
When the "Test Out of Sample" option is enabled, the indicator plots the selected display settings based on models' out-of-sample predictions. The display settings for out-of-sample testing include several options:
State Probability option displays the probability of each state at a given time for segments of data points not included in the training process. This is particularly useful for real-time identification of market regimes, ensuring that the model's predictive capability is tested on unseen data. These probabilities are calculated using the forward algorithm, which efficiently computes the likelihood of the observed sequence given the model parameters. Higher probabilities for a particular state suggest that the market is currently in that state. Traders can use this information to adjust their strategies according to the identified market regime and their statistical features.
Confidence Interval Bands option plots the upper, lower, and median confidence interval bands for predicted values. These bands provide a range within which future values are expected to lie with a certain confidence level. The width of the interval is determined by the current probability of different states in the model and the distribution of data within these states. The confidence level can be specified in the Confidence Interval setting.
Omega Ratio option displays a risk-adjusted performance measure that offers a more comprehensive view of potential returns compared to traditional metrics like the Sharpe ratio. It takes into account all moments of the returns distribution, providing a nuanced perspective on the risk-return tradeoff in the context of the HHMM's identified market regimes. The minimum acceptable return (MAR) used for the calculation of the omega can be specified in the settings of the indicator. The plot displays both the current Omega ratio and a forecasted "N day Omega" ratio. A higher Omega ratio suggests better risk-adjusted performance, essentially comparing the probability of gains versus the probability of losses relative to the minimum acceptable return. The Omega ratio plot is color-coded, green indicates that the long-term forecasted Omega is higher than the current Omega (suggesting improving risk-adjusted returns over time), while red indicates the opposite. Traders can use omega ratio to assess the risk-adjusted forecast of the model, under current market conditions with a specific target return requirement (MAR). By leveraging the HHMM's ability to identify different market states, the Omega ratio provides a forward-looking risk assessment tool, helping traders make more informed decisions about position sizing, risk management, and strategy selection.
Model Complexity option shows the complexity of the model, as well as complexity of individual states if the “complexity components” option is enabled. Model complexity is measured in terms of the entropy expressed through transition probabilities. The used complexity metric can be related to the models entropy rate and is calculated as the sum of the p*log(p) for every transition probability of a given state. Complexity in this context informs us on how complex the models transitions are. A model that might transition between states more often would be characterised by higher complexity, while a model that tends to transition less often would have lower complexity. High complexity can also suggest the model captures noise rather than the underlying market structure also known as overfitting, whereas lower complexity might indicate underfitting, where the model is too simplistic to capture important market dynamics. It is useful to assess the stability of the model complexity as well as understand where changes come from when a shift happens. A model with irregular complexity values can be strong sign of overfitting, as it suggests that the process that the model is capturing changes siginficantly over time.
Akaike/Bayesian Information Criterion option plots the AIC or BIC values for the model on both the training and out-of-sample data. These criteria are used for model selection, helping to balance model fit and complexity, as they take into account both the goodness of fit (likelihood) and the number of parameters in the model. The metric therefore provides a value we can use to compare different models with different number of parameters. Lower values generally indicate a better model. AIC is considered more liberal while BIC is considered a more conservative criterion which penalizes the likelihood more. Beside comparing different models, we can also assess how much the AIC and BIC differ between the training sets and test sets. A test set metric, which is consistently significantly higher than the training set metric can point to a drift in the models parameters, a strong drift of model parameters might again indicate overfitting or underfitting the sampled data.
Indicator settings:
- Source : Data source which is used to fit the model
- Training Period : Adjust based on the amount of historical data available. Longer periods can capture more trends but might be computationally intensive.
- EM Iterations : Balance between computational efficiency and model fit. More iterations can improve the model but at the cost of speed.
- Test Out of Sample : turn on predict the test data out of sample, based on the model that is retrained every N bars
- Out of Sample Display: A selection of metrics to evaluate out of sample. Pick among State probability, confidence interval, model complexity and AIC/BIC.
- Test Model on N Bars : set the number of bars we perform out of sample testing on.
- Retrain Model on N Bars: Set based on how often you want to retrain the model when testing out of sample segments
- Confidence Interval : When confidence interval is selected in the out of sample display you can adjust the percentage to reflect the desired confidence level for predictions.
- Omega forecast: Specifies the number of days ahead the omega ratio will be forecasted to get a long run measure.
- Minimum Acceptable Return : Specifies the target minimum acceptable return for the omega ratio calculation
- Complexity Components : When model complexity is selected in the out of sample display, this option will display the complexity of each individual state.
-Bayesian Information Criterion : When AIC/BIC is selected, turning this on this will ensure BIC is calculated instead of AIC.

Hidden Markov ModelHidden Markov Models (HMMs) are a class of statistical models used to represent systems that follow a Markov process with hidden states. In such models, the system being modeled transitions between a finite number of states, with the probability of each transition dependent only on the current state. The hidden states are not directly observable; instead, we observe a sequence of emissions or outputs generated by these states. HMMs are widely used in various fields, including speech recognition, bioinformatics, and financial market analysis. In the context of financial markets, HMMs can be utilized to model the latent market regimes (e.g., bullish, bearish, or neutral) that influence the observed market data such as asset prices or returns. By estimating the posterior probabilities of these hidden states, traders and analysts can identify the most likely market regime and make informed decisions based on the probabilistic assessment of market conditions.
The Hidden Markov Model (HMM) comprises several states that work together to model the hidden market dynamics. The states represent the unobservable market regimes such as bullish, bearish or neutral. The states are 'hidden' in nature because we need to infer them from the data and cannot directly observe them.
Model components:
Initial Probabilities: These denote the likelihood of starting in each hidden state. They can be related to long-run probabilities, reflecting the overall likelihood of each state across extended periods. In equilibrium, these initial probabilities may converge to the stationary distribution of the Markov chain.
Transition Probabilities: These capture the likelihood of moving between states, including the probability of remaining in the current state. They model how market regimes evolve over time, allowing the HMM to adapt to changing conditions.
Emission Probabilities: Also known as observation likelihoods, these represent the probability of observing specific market data (like returns) given each hidden state. Emission probabilities can be often represented by continuous probability distributions. In our case we are using a laplace distribution with its location parameter reflecting the central tendency of returns in each state and the scale reflecting the dispersion or the magnitude of the returns.
The power of HMMs in financial modeling lies in their ability to capture complex market dynamics probabilistically. By analyzing patterns in market, the model can estimate the likelihood of being in each state at any given time. This can reveal insights into market behavior and dynamics that might not be apparent from data alone.
MODEL FIT:
By default, the indicator displays the posterior probabilities, which represent the likelihood that the market is in a specific hidden state at any given time, based on the observed data and the model fit. It is crucial to understand that these posterior probabilities strictly represent the model fit, reflecting how well the model explains the historical data it was trained on. This model fit is inherently different from out-of-sample predictions, which are generated using data that was not included in the training process. The posterior probabilities from the model fit provide a probabilistic assessment of the state the market was in at a particular time based on the data that came before and after it in the training sequeence. Out-of-sample predictions on the other hand offer a forward-looking evaluation to test the model's predictive capability.
MODEL TEST:
When the "Test Out of Sample” option is enabled, the indicator plots the selected display settings based on models out-of-sample predictions. The display settings for out-of-sample testing include several options:
State Probability option displays the probability of each state at a given time for segments of datapoints that were not included in the traning process. This is particularly useful for real-time identification of market regimes, ensuring that the model's predictive capability is rigorously tested on unseen data. These probabilities are calculated using the forward algorithm, which efficiently computes the likelihood of the observed sequence given the model parameters. Higher probability for a particular state indicate a higher likelihood that the market is currently in that state. Traders can use this information to adjust their strategies according to the identified market regime and their statistical features.
Confidence Interval Bands option plots the upper, lower, and median confidence interval bands for predicted values. These bands provide a range within which future values are expected to lie with a certain confidence level. The width of the interval is determined by the current probability of different states in the model and the distribution of data within these states. The confidence level can be specified in the Confidence Interval setting.
Omega Ratio option displays a risk-adjusted performance measure that offers a more comprehensive view of potential returns compared to traditional metrics like the Sharpe ratio. It takes into account all moments of the returns distribution, providing a nuanced perspective on the risk-return tradeoff in the context of the HHMM's identified market regimes. The minimum acceptable return (MAR) used for the calculation of the omega can be specified in the settings of the indicator. The plot displays both the current Omega ratio and a forecasted "N day Omega" ratio. A higher Omega ratio suggests better risk-adjusted performance, essentially comparing the probability of gains versus the probability of losses relative to the minimum acceptable return. The Omega ratio plot is color-coded, green indicates that the long-term forecasted Omega is higher than the current Omega (suggesting improving risk-adjusted returns over time), while red indicates the opposite. Traders can use omega ratio to assess the risk-adjusted forecast of the model, under current market conditions with a specific target return requirement (MAR). By leveraging the HHMM's ability to identify different market states, the Omega ratio provides a forward-looking risk assessment tool, helping traders make more informed decisions about position sizing, risk management, and strategy selection.
Model Complexity option shows the complexity of the model, as well as complexity of individual states if the “complexity components” option is enabled. Model complexity is measured in terms of the entropy expressed through transition probabilities. The used complexity metric can be related to the models entropy rate and is calculated as the sum of the p*log(p) for every transition probability of a given state. Complexity in this context informs us on how complex the models transitions are. A model that might transition between states more often would be characterised by higher complexity, while a model that tends to transition less often would have lower complexity. High complexity can also suggest the model captures noise rather than the underlying market structure also known as overfitting, whereas too low complexity might indicate underfitting, where the model is too simplistic to capture important market dynamics. It is also useful to assess the stability of the model complexity. A model with irregular complexity values can be sign of overfitting, as it suggests that the process that the model is capturing changes significantly over time.
Akaike/Bayesian Information Criterion option plots the AIC or BIC values for the model on both the training and out-of-sample data. These criteria are used for model selection, helping to balance model fit and complexity, as they take into account both the goodness of fit (likelihood) and the number of parameters in the model. The metric therefore provides a value we can use to compare different models with different number of parameters. Lower values generally indicate a better model. AIC is considered more liberal while BIC is considered a more conservative criterion which penalizes the likelihood more. Beside comparing different models, we can also assess how much the AIC and BIC differ between the training sets and test sets. A test set metric, which is consistently significantly higher than the training set metric can point to a drift in the models parameters, a strong drift of model parameters might again indicate overfitting or underfitting the sampled data.
Indicator settings:
- Source : Data source which is used to fit the model
- Training Period : Adjust based on the amount of historical data available. Longer periods can capture more trends but might be computationally intensive.
- EM Iterations : Balance between computational efficiency and model fit. More iterations can improve the model but at the cost of speed.
- Test Out of Sample : turn on predict the test data out of sample, based on the model that is retrained every N bars
- Out of Sample Display: A selection of metrics to evaluate out of sample. Pick among State probability, confidence interval, model complexity and AIC/BIC.
- Test Model on N Bars : set the number of bars we perform out of sample testing on.
- Retrain Model on N Bars: Set based on how often you want to retrain the model when testing out of sample segments
- Confidence Interval : When confidence interval is selected in the out of sample display you can adjust the percentage to reflect the desired confidence level for predictions.
- Omega forecast: Specifies the number of days ahead the omega ratio will be forecasted to get a long run measure.
- Minimum Acceptable Return : Specifies the target minimum acceptable return for the omega ratio calculation
- Complexity Components : When model complexity is selected in the out of sample display, this option will display the complexity of each individual state.
-Bayesian Information Criterion : When AIC/BIC is selected, turning this on this will ensure BIC is calculated instead of AIC.

Scalping 4D+ Engine (Advanced Entry Modes {SMC})Scalping 4D+ Engine (Advanced Entry Modes {SMC}) is a next-generation quantitative trading model engineered for traders who want fewer but higher-probability signals.
This system combines Smart Money Concepts (SMC), quantitative volume analysis, volatility regime modeling, and momentum confirmation into a unified scoring engine that filters out noise and highlights only the strongest directional opportunities.
Unlike conventional indicators that rely on a single trigger (EMA crosses, RSI oversold, MACD flips), the SMC 4D+ engine evaluates multiple market dimensions simultaneously, allowing it to track the true underlying state of the market before issuing a BUY or SELL signal.

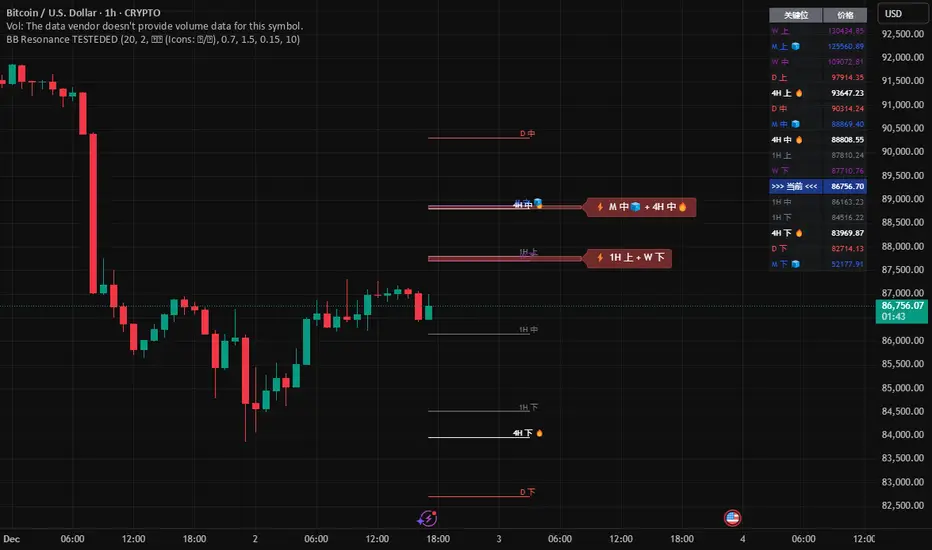
Global BB Resonance [by TESTEDED]📈 Global BB Resonance Hunter
1. Design Philosophy: Dimensional Reduction
In modern trading, "Information Overload" is the enemy. Traders often clutter their charts with 15+ Bollinger Band lines across 1H, 4H, Daily, and Weekly timeframes, resulting in a "spaghetti chart" that is impossible to read quickly.
The core logic of this indicator is "Dimensional Reduction." Instead of drawing every single line, this script runs a background algorithm to detect "Confluence" (Resonance).
The Thesis: A single Bollinger line (e.g., 1H Upper) is easily broken. However, when multiple dimensions overlap (e.g., 1H Upper + Daily Mid + Weekly Low) at the exact same price level, a "Market Consensus" is formed. These are the critical "Walls" of the market.
The Solution: We sort all data by Price, not Time. If lines cluster together within a specific threshold (e.g., 0.15%), the script draws a single Resonance Box instead of multiple confusing lines.
2. Key Features
🛡️ Multi-Timeframe Monitoring: Simultaneously monitors 1H, 4H, Daily, Weekly, and Monthly Bollinger Bands in the background, regardless of your chart's current timeframe.
⚡ Smart Resonance Detection: Automatically groups overlapping levels into "Resonance Boxes."
⚡ (2-Line Confluence): Watch closely.
⚡⚡ (3-Line Confluence): Strong Support/Resistance.
⚡⚡⚡ (4+ Lines): "Iron Wall" Resonance.
📊 Volatility State Perception: Detects if the bands are Squeezing (accumulating energy) or Expanding (trending).
Style Options: Choose between Icons (🧊/🔥) or Geek Symbols (>.< / <^>).
🧘 Focus Mode (Sniper View): A unique feature that hides all individual lines, leaving only the Resonance Boxes and the Dashboard. This keeps your chart clean and distraction-free.
🔔 Smart Alerts: Get notified immediately when Price touches a Resonance Box or when a Squeeze occurs.
3. Visual Guide
A. The Symbols (State Indicators)
You can switch styles in the settings.
B. The Resonance Boxes
Red Box: Resistance Zone (Above Price).
Green Box: Support Zone (Below Price).
Label: E.g., ⚡⚡ 1H Up + D Mid. This tells you exactly which levels are overlapping.
4. Usage Strategy
The "Reversal" Setup: Look for a Green Resonance Box below price with High Confluence (⚡⚡). Ensure the state is NOT Expanding (<^> or 🔥).
The "Breakout" Setup: Look for the Squeeze Symbol (>.< or 🧊) on the dashboard. If price approaches a Resonance Box while Squeezing, expect a breakout.
The "Sniper" Method: Turn on Focus Mode. Set Alerts. Only look at the chart when price hits a "Wall."
How to use: youtu.be
📈 布林带多维共振捕猎者
1. 设计哲学:降维打击
在现代交易中,“信息过载”是最大的敌人。交易者经常在图表上叠加 1H、4H、日线、周线等 15 条以上的布林带线条,导致图表像“盘丝洞”一样难以阅读。
本指标的核心逻辑是“降维打击”与“数据可视化”。 我们不再画出每一条线,而是在后台运行算法来捕捉**“共振”(Confluence)**。
核心理念:单一周期的布林线(如 1H 上轨)很容易被刺破。但是,当多个维度的力量(如 1H 上轨 + 日线中轨 + 周线下轨)在同一个价格水平重叠时,就形成了**“市场合力”**。这些位置才是市场真正的“铜墙铁壁”。
解决方案:系统按价格而非时间对数据进行排序。如果多条线在特定阈值(如 0.15%)内聚集,脚本会画出一个**“共振框”**,而不是无数条混乱的线。
2. 核心功能
🛡️ 全维幽灵监控:无论当前图表周期如何,脚本都会在后台实时监控 1H, 4H, 日线, 周线, 月线 的数据。
⚡ 智能共振雷达:自动检测并合并重叠的关键位。
⚡ (2线共振):值得关注。
⚡⚡ (3线共振):强力支撑/阻力。
⚡⚡⚡ (4线以上):核弹级/铁壁共振。
📊 波动率状态感知:自动识别布林带是处于 挤压蓄势 还是 扩张爆发 阶段。
风格切换:支持 图标模式 (🧊/🔥) 或 极客符号模式 (>.< / <^>)。
🧘 专注模式 (Focus Mode):一键隐藏所有单线,只保留共振框和仪表盘。让您的图表瞬间清空,像狙击手一样只关注目标。
🔔 智能警报:当价格触及共振框,或出现极度压缩信号时,立即发送警报。
3. 视觉指南
A. 状态符号说明
您可以在设置中切换显示风格。
B. 共振框说明
红色方框:上方阻力区 (Resistance)。
绿色方框:下方支撑区 (Support)。
标签示例:⚡⚡ 1H Up + D Mid —— 明确告知您是哪几条线发生了共振。
4. 实战策略
“反转”交易:寻找价格下方的绿色共振框,且具有高星级 (⚡⚡)。前提是当前状态不是扩张状态 (<^> 或 🔥)。
“突破”交易:在仪表盘上看到 挤压符号 (>.< 或 🧊)。如果价格在挤压状态下逼近共振框,不要逆势阻挡,大概率会发生强力突破。
“狙击”模式:开启 专注模式。设置好警报。不要盯着 K 线波动,直到价格撞上“墙壁”触发警报时再介入。
使用说明: youtu.be
Macro Opportunity Drawdown Engine (MODE)Strategic Drawdown Classification for Macro-Cycle Accumulation. MODE identifies market drawdowns that historically align with discounted accumulation zones. Instead of treating pullbacks as risk events, it classifies them as structural opportunity phases based on distance from prior cycle highs.
The indicator continuously measures drawdown severity and labels current conditions as:
- Correction: –10% to –19%
- Bear Market: –20% to –29%
- Major Crash Opportunity: –30% or deeper
These levels are displayed directly on the chart, along with a live drawdown reading from the most recent peak.
MODE is built for long-term, macro-minded investors who view volatility as an advantage. It helps identify when the market has entered deep value phases often associated with stronger forward returns, liquidity resets, and cycle bottoms.
In short:
MODE turns market stress into clear signals of potential opportunity, providing a disciplined, data-driven framework for accumulation during corrections, bear markets, and crashes.

ATR Volatility HistogramATR Volatility Histogram showing result as coloured histogram where Rising > Greenand Fallig < Red. Input can be varied in settings.

複合ガチイカ🦑🦑🦑 日本語説明は英文の後ーーーーーーーーーーーーーーー
🦑 Composite Gachi Squid Indicator – A fun and intuitive trading overlay combining SuperTrend, ATR, and RSI.
Body color shows trend direction and strength.
Tentacles visualize volatility.
Eyes indicate overbought/oversold conditions.
🦑↑ / 🦑↓ marks provide clear entry signals.
Perfect for visual traders who want both style and actionable insights.
日本語説明-------------------------------------------------------------
🦑 複合ガチイカ・インジケーター – SuperTrend、ATR、RSI を組み合わせた遊び心と実用性を両立したチャートオーバーレイ。
イカの体の色でトレンドの方向と強さを表示
触手でボラティリティを可視化
目で買われすぎ・売られすぎを表示
🦑↑ / 🦑↓ が分かりやすいエントリーシグナル
見た目も楽しく、トレード判断にも使えるインジケーターです。

Brahmastra PremiumBrahmastra Trade System is a complete institutional trading engine designed for traders who want precision entries, clean trends, and automated risk management.
It combines multi-timeframe confirmation, ATR-based volatility logic, trend structure, and angle analytics—giving you a highly reliable and visually clean trading framework.
🔥 Key Features
✅ 1. Institutional Trend Engine (Triple Confirmation):
The trend is detected using:
Fast MA (5)
Slow SMA/EMA (51)
Custom ATR Trend (SuperTrend-like algorithm)
This three-layer confirmation ensures you only trade when the trend is solid, real, and clean.
✅ 2. Multi-Timeframe Breakout Confirmation (1-Minute)
Most retail breakouts are fake.
This indicator validates entries using lower timeframe 5-minute candle closes.
✔ Helps avoid traps
✔ Ensures genuine breakout momentum
✔ Great for intraday & swing traders
✅ 3. Smart Entry & Exit Signals
Clear on-chart signals:
Bullish Entry (Triangle Up)
Bearish Entry (Triangle Down)
Buy Exit
Sell Exit
Exit logic uses:
Fast MA breakdown
ATR trend reversal
This catches trend reversals early and protects profits.
✅ 4. Automatic SL + TP1/TP2/TP3 Projection (ATR-Based)
On every entry, Brahmastra automatically plots:
Stop Loss (SL),Target 1,Target 2,Target 3
Targets are based on volatility (ATR), not random lines. This gives:
✔ Stable stops
✔ Dynamic targets
✔ Accurate risk–reward mapping
✅ 5. Smart Trailing Stop Loss (TSL)
TSL activates only after TP1 hits.
Buy trades → TSL moves upward
Sell trades → TSL moves downward
The trailing SL never moves backward → flawless institutional money management.
✅ 6. Volume-Powered Candle Coloring
Candles change color based on:
Trend direction
Volume intensity
Makes momentum extremely easy to read:
High volume bull → Neon green
High volume bear → Neon red
✅ 7. Multi-Angle Trendline System (3 Layers)
Brahmastra auto-draws support/resistance trendlines for:
L1 (Scalp) – Short trend
L2 (Swing) – Medium trend
L3 (Macro) – Larger trend
Each trendline is analyzed for angle strength:
🚀 Parabolic (Dangerous / Vertical)
💪 Strong Trend (Ideal)
😴 Weak / Accumulation (Sideways)
This helps you see whether the market is:
About to explode
Losing strength
Moving sideways
⚠️ Disclaimer
This indicator is an advanced trading tool, NOT financial advice.
Always backtest, understand the logic, and trade responsibly.

Deviaton Tracker - QuantSyDeviation Tracker - QuantSy
An adaptive volatility band system that maps price behavior across statistical deviation zones. Provides visual context for market extremes and tracks duration patterns for probabilistic mean reversion analysis.
What it offers:
Dynamic bands that adjust to current volatility conditions, creating clear visual zones for price action. The system continuously monitors time spent in each zone and builds a statistical profile of typical duration patterns, helping identify when price may be overextended.
Best for:
Spotting potential reversal areas at volatility extremes
Understanding current price positioning relative to recent behavior
Timing entries and exits based on statistical probabilities
Risk management and position sizing decisions
Clean gradient visualization provides immediate context while the underlying statistical engine tracks behavioral patterns across all market conditions.
**⚠️ Disclaimer**
Educational tool only - does not constitute investment advice. The developer assumes no liability for any trading profits or losses incurred through the use/misuse of this indicator.
This indicator does not include any features related to interest, leverage, or gambling. Users are fully responsible for making sure their assets and trading practices align with Islamic guidelines.

Real Relative Strength Indicator### What is RRS (Real Relative Strength)?
RRS is a volatility-normalized relative strength indicator that shows you – in real time – whether your stock, crypto, or any asset is genuinely beating or lagging the broader market after adjusting for risk and volatility. Unlike the classic “price ÷ SPY” line that gets completely fooled by volatility regimes, RRS answers the only question that actually matters to professional traders:
“Is this ticker moving better (or worse) than the market on a risk-adjusted basis right now?”
It does this by measuring the excess momentum of your ticker versus a benchmark (SPY, QQQ, BTC, etc.) and then dividing that excess by the average volatility (ATR) of both instruments. The result is a clean, centered-around-zero oscillator that works the same way in calm markets, crash markets, or parabolic bull runs.
### How to Use the RRS Indicator (Aqua/Purple Area Version) in Practice
The indicator is deliberately simple to read once you know the rules:
Positive area (aqua) means genuine outperformance.
Negative area (purple) means genuine underperformance.
The farther from zero, the stronger the leadership or weakness.
#### Core Signals and How to Trade Them
- RRS crossing above zero → one of the highest-probability long signals in existence. The asset has just started outperforming the market on a risk-adjusted basis. Enter or add aggressively if price structure agrees.
- RRS crossing below zero → leadership is ending. Tighten stops, take partial or full profits, or flip short if you trade both sides.
- RRS above +2 (bright aqua area) → clear leadership. This is where the real money is made in bull markets. Trail stops, add on pullbacks, let winners run.
- RRS below –2 (bright purple area) → clear distribution or capitulation. Avoid new longs, consider short entries or protective puts.
- Extreme readings above +4 or below –4 (background tint appears) → rare, very high-conviction moves. Treat these like once-a-month opportunities.
- Divergence (not plotted here, but easy to spot visually): price making new highs while the aqua area is shrinking → distribution. Price making new lows while the purple area is shrinking → hidden buying and coming reversal.
#### Best Settings by Style and Asset Class
For stocks and ETFs: keep benchmark as SPY (or QQQ for tech-heavy names) and length 14–20 on daily/4H charts.
For crypto: change the benchmark to BTCUSD (or ETHUSD) immediately — otherwise the reading is meaningless. Length 10–14 works best on 1H–4H crypto charts because volatility is higher.
For day trading: drop length to 10–12 and use 15-minute or 5-minute charts. Signals are faster and still extremely clean.
#### Highest-Edge Setups (What Actually Prints Money)
- RRS crosses above zero while price is still below a major moving average (50 EMA, 200 SMA, etc.) → early leadership, often catches the exact bottom of a new leg up.
- RRS already deep aqua (+3 or higher) and price pulls back to support without RRS dropping below +1 → textbook add-on or re-entry zone.
- RRS deep purple and suddenly turns flat or starts curling up while price is still falling → hidden accumulation, usually the exact low tick.
That’s it. Master these few rules and the RRS becomes one of the most powerful edge tools you will ever use for rotation trading...

Volume based liquidity This indicator finds area where the price moves relatively mildly compared to the size of the volume, the target area. It also finds weak areas, that have low volume in a relatively large price movement. Larger and more recent target areas are much more useful in finding liquidity. the weak areas could be a tell for when price will reverse into a target area. Make sure a target area hasn't already had its liquidity swept.

Trend Flow & Volatility Guard Strategy [ROSTOK V5]Description:
This strategy is a comprehensive trend-following system designed to identify high-probability entries by aligning long-term market direction with short-term momentum, while strictly filtering out low-quality "choppy" market conditions.
How it Works:
The strategy operates on a multi-stage logic system:
Trend Identification: The core direction is determined by a customizable Main Trend Line (selectable between a long-period EMA or Supertrend). Trades are only taken in the direction of the dominant trend.
Signal Generation: Entries are triggered when a fast-moving Signal Line crosses the Main Trend Line, confirmed by specific candlestick price action (Close > Open).
Advanced Filtering (Confluence): To avoid false signals, the strategy employs a robust set of filters. A trade is only valid if:
Momentum: RSI is within safe operating zones (avoiding extreme overbought/oversold unless a strong trend override is active).
Cycle: CCI and MACD histograms align with the trade direction.
Volatility: The ADX is analyzed to ensure sufficient trend strength, while a Choppiness Index filter blocks trades during sideways/ranging markets.
Risk Management & Recovery: The strategy features built-in money management tools, including:
ADR (Average Daily Range) Filter: Prevents entering trades when the asset has already moved its expected daily distance.
Daily Limits: Hard stops for Max Daily Loss and Target Daily Profit to preserve capital.
Recovery Logic: An optional mechanism to manage drawdowns on difficult days using calculated recovery targets.
Settings & Customization: Users can toggle individual filters (Volume, Choppiness, ADX) and adjust the sensitivity of the trend lines to fit different assets and timeframes (e.g., EURAUD 15m).
Disclaimer: Past performance is not indicative of future results. This script is for educational purposes and backtesting analysis.

ATR Trade Plan ToolOverview
This indicator is a trade management tool designed to help traders visualize volatility-based targets and stop-losses instantly. By anchoring calculations to the Daily Opening Price and the Average True Range (ATR), it projects objective, mathematical support and resistance levels for the current session.
How It Works
The script detects the start of the trading day (or a manually defined period) and draws a vertical marker. From there, it projects horizontal lines representing key multiples of the ATR:
Green Line: Opening Price (The baseline).
Blue Lines (Targets): +0.5 ATR, +1.0 ATR, and +2.0 ATR. These serve as dynamic profit-taking zones based on current market volatility.
Orange Line (Stop Loss): -2.0 ATR. A standard volatility-based stop level.
Red Line (Emergency Exit): -3.0 ATR. A level indicating extreme adverse moves.
Key Features
Auto or Manual Mode: By default, the script automatically fetches the Daily Open and ATR-14. However, users can manually input a specific Opening Price or ATR value in settings to simulate trade plans or override automatic data.
Clean Visuals: Uses the Drawing API to plot lines only on the current/last bar, keeping historical price action clean and uncluttered.
Text Customization: Users can align text to the Right, Left, or Center, adjust the offset distance, and change text size to fit their chart layout.
Flexible Alerts: Includes a dedicated "Alert Configuration" menu. Users can toggle alerts on/off for individual lines (e.g., enable the Stop Loss alert but disable the +0.5 ATR alert). All enabled settings work via a single "Any alert() function call."
Settings
Values: Input custom Open/ATR prices (leave at 0 for automatic).
Text & Alignment: Adjust label position, offset, and size.
Alert Configuration: Checkboxes to enable/disable alerts for specific price levels.
Methodology The levels are calculated using the standard formula: Level = Opening Price + (Multiplier * ATR)

BT MA BandsThe BT MA Bands indicator is built around a central moving average (MA) with upper and lower bands derived from it, similar to Bollinger Bands but focused on exponential moving averages (EMAs) for smoother responsiveness.
The core idea is to visualize trend strength, volatility squeezes, and potential reversal points through dynamic bands that expand/contract based on price deviation. It includes trend-based color fills, entry/exit signals, an optional ATR (Average True Range) overlay for additional volatility bands, and flexible MA source options to adapt to different market conditions.
Inputs
MA Type and Length: Choose from EMA (default), SMA, WMA, or HMA. Default length is 20 periods, but adjustable (e.g., 10-50) for short-term scalping or longer swings.
Deviation Multiplier: Sets the band width as a multiple of the standard deviation from the MA (default: 2.0). Higher values create wider bands for trending markets; lower for ranging ones.
Source Data: Select price source for the MA calculation—close (default), open, high, low, (high+low)/2, or weighted (hlc3/hlcc4) to emphasize different aspects of price action.
ATR Toggle and Multiplier: Optional ATR-based outer bands (default off). When enabled, multiplier (default: 1.5) adds volatility sensitivity, helping filter noise in choppy conditions.
Signal Sensitivity: Threshold for generating buy/sell alerts (e.g., 0-100 scale; default 50) based on band crossovers or squeezes.
Style Options: Enable/disable fills, signals, and colors for personalization.
Visual Elements
Central MA Line: A solid line (e.g., blue by default) representing the chosen moving average, acting as the baseline.
Upper and Lower Bands: Dotted or dashed lines (green/red defaults) that flank the MA, widening during volatility and narrowing in consolidations.
Color-Changing Fills: The area between bands fills with color shifts—bullish (green) when price is above the MA and bands are expanding, bearish (red) when below and contracting, or neutral (gray) during flat trends.
Entry Signals: Arrow plots (up green for bullish, down red for bearish) appear on the chart when price crosses the bands or a squeeze resolves, with optional text labels like "Buy" or "Sell."
ATR Overlay (if enabled): Additional dashed outer bands in a lighter color (e.g., purple) to highlight extreme volatility zones.
How to Use It in Trading
Trend Identification: Use the central MA and band fills to gauge direction—price above the MA with green fills signals an uptrend (favor longs); below with red indicates downtrends (favor shorts). Narrow bands suggest a "squeeze" setup, often preceding big moves.
Entry Points:
Bullish Entries: Enter long when price breaks above the upper band on a bullish signal arrow, especially after a squeeze. Confirm with volume spike or RSI >50 on timeframes like 5m-1h for quick trades.
Bearish Entries: Enter short on a break below the lower band with a bearish arrow, post-squeeze. Ideal on 4h+ frames for swings, paired with MACD crossovers.
Exits and Risk Management: Exit longs when price hits the lower band or a bearish signal fires; vice versa for shorts. Set stops just beyond the opposite band (e.g., below lower for longs). Target 1.5-3x risk-reward, using ATR bands for trailing stops in volatile markets.
General Tips: Best in trending environments; avoid during news events causing false breakouts. Backtest parameters on historical data, and combine with other indicators like RSI or volume for confluence. It's great for spotting reversals but not infallible—always apply position sizing and monitor for band "walks" (price hugging one band) as continuation signals.

Eurovision - EURUSD Market SpecialistProfessional EURUSD trading signals with adaptive parameters
Performance Expectations
Win Rate || 60-70% || Adaptive parameters
Risk/Reward || 1:2.0 || Session optimization
Max Drawdown || <15% || News filter protection
Sharpe Ratio || >1.5 || Multi-timeframe confluence
Signals per Day || 3-8 || EURUSD-specific filtering
Tip: The indicator works best as an overlay on EURUSD M5 charts!

Dark Vector ScalpingThe Dark Vector Scalping indicator is a high-frequency trend-following system designed specifically to capture rapid momentum shifts in the market. It combines a staircase-style breakout logic with volatility-adjusted trailing stops to define market direction.
While the underlying math is robust enough for various asset classes, this specific configuration is optimized for scalping operations on 1-minute and 5-minute timeframes. It aims to filter out the "noise" common in lower timeframes while reacting quickly to genuine breakouts.
Core Components
1. The Apex Engine (Staircase Logic) Unlike traditional moving averages that curve with price, this engine uses a "hard" breakout logic. It looks back at a specific number of bars (Sensitivity) to find the highest highs and lowest lows.
Bullish Flip: Occurs when the price closes below the calculated low of the previous trend.
Bearish Flip: Occurs when the price closes above the calculated high of the previous trend.
Trailing Stop: Once a trend is established, a trailing stop line is drawn. This line only moves in the direction of the trend (up for bullish, down for bearish) and never retraces, acting as a ratchet to lock in paper profits.
2. Volatility Normalization To prevent getting stopped out by random market noise (scam wicks), the indicator calculates the Average True Range (ATR). It multiplies this volatility metric by a user-defined deviation factor to determine exactly how far the stop line should be from the current price action.
3. The Hull Moving Average (HMA) Filter The script includes an optional 50-period Hull Moving Average. The HMA is known for being extremely fast and smooth, reducing lag compared to standard moving averages.
Visual Reference: You can plot the line to see the overall macro trend.
Hard Filter: You can enable a "Safety Filter" in the settings. If enabled, the system will only generate Buy signals if the price is above the HMA, and Sell signals if the price is below the HMA.
4. The Dashboard A data panel is located on the chart (customizable position) to provide instant numerical data without needing to calculate levels manually. It displays the current trend state, the exact price of the trailing stop, and the status of the HMA filter.
Settings & Configuration
Sensitivity (Lookback)
Default: 5
This is the primary setting for the Apex Engine. A setting of 5 is the "sweet spot" for 1-minute and 5-minute charts. It allows the system to react very quickly to sudden volume spikes. Increasing this number (e.g., to 10) will make the signals slower and more conservative.
Stop Deviation
Default: 3.0
This controls the "breathing room" for the trade. A value of 3.0 allows for standard volatility on minute charts without triggering a premature exit. Lowering this to 2.0 will result in tighter stops but more false signals.
HMA Filter
Use HMA as Filter? (Default: OFF):
When OFF, the system signals purely on price action breakouts (fastest).
When ON, the system waits for the price to align with the 50-period HMA before signaling (safest, but may delay entry).
How to Interpret Visuals
Candle Colors
Teal/Green: The market is in a Bullish regime.
Red/Pink: The market is in a Bearish regime.
The Line
The solid stepped line represents the hard invalidation point. If price closes beyond this line, the trend is considered over.
Diamond Signals
Light Green Diamond (Below Bar): Confirmed Buy Signal. A new bullish trend has started.
Light Red/Pink Diamond (Above Bar): Confirmed Sell Signal. A new bearish trend has started.
Trading Strategy Guide
The Scalp Entry
Ensure you are on a 1-minute or 5-minute timeframe.
Wait for a signal Diamond to close. Do not enter while the bar is still forming, as the signal may repaint (disappear) if the price retraces before the close.
Long Entry: Enter when a Green Diamond appears and the candle turns Teal.
Short Entry: Enter when a Red Diamond appears and the candle turns Red.
Risk Management
Stop Loss: Your invalidation level is the "Apex Stop" line. You can place your hard stop loss slightly beyond this line.
Take Profit: Because this is a trend-following system, it is often best to hold until the candle color changes, or to take profit at fixed Risk:Reward ratios (e.g., 1:1.5 or 1:2).
The HMA Nuance If you find the market is "choppy" (moving sideways), enable the "Use HMA as Filter" option in the settings. This will force the system to ignore signals that are counter-trend to the longer-term momentum.
Disclaimer
The information provided by the "Dark Vector Scalping" indicator and this accompanying guide is for educational and informational purposes only. It does not constitute financial, investment, or trading advice. Trading cryptocurrencies, stocks, and forex involves a high level of risk and may not be suitable for all investors. You could lose some or all of your initial investment.

SigmaFrame-NQSigmaFrame is a volatility-weighted standard deviation engine designed to generate dynamic intraday pivot levels which expand during volatility spikes and tighten during compression, giving traders a consistent structural map across trending and rotational environments.

SigmaFrame-ESSigmaFrame is a volatility-weighted standard deviation engine designed to generate dynamic intraday pivot levels which expand during volatility spikes and tighten during compression, giving traders a consistent structural map across trending and rotational environments.

Dark VectorThe Dark Vector is a professional-grade trend-following system designed to solve the two most common causes of trading losses: over-trading during chop and exiting trends too early.
Unlike standard indicators that continuously recalculate based on every price tick, this system operates on a strict "State Machine" logic. This means it tracks the current market phase and refuses to issue conflicting signals. If the system is Long, it mathematically cannot issue another Long signal until the previous trend has concluded.
The system relies on three core engines:
1. The Trend Architecture (Modified SuperTrend) The backbone of the system is an ATR-based trailing stop mechanism. It creates a dynamic trend line that adjusts to volatility. When volatility expands, the line widens to prevent premature stop-outs during market noise. When volatility contracts, the line tightens to protect profits.
2. The Noise Gate (Choppiness Index) This is the system's safety filter. It measures the fractal efficiency of the market—essentially determining if price is moving in a clear direction or moving sideways. When the market enters a consolidation phase (sideways chop), the Noise Gate activates, turning the candles gray and physically blocking all new entry signals. This prevents the user from entering trades in low-probability environments.
3. The Singularity State Machine This internal logic enforces trading discipline. It treats the trend as a binary state (Bullish or Bearish). It forces an alternating signal pattern, ensuring that you are only alerted to the specific moment a major trend reversal occurs, rather than being bombarded with repetitive signals during a long run.
Best Way to Use This System
To maximize profitability and minimize false positives, it is recommended to use the "Regime & Alignment" methodology outlined below.
1. The Traffic Light Rule
Before placing any trade, observe the color of the candlesticks on the chart:
Green Candles: The market is in a confirmed Bullish Impulse. You should only look for Long entries or hold existing positions. Shorting is statistically dangerous here.
Red Candles: The market is in a confirmed Bearish Impulse. You should only look for Short entries or hold cash. Buying the dip here is high-risk.
Gray Candles: The market is in a Chop/Squeeze regime. The Noise Gate is active. Do not open new positions. This indicates indecision, and the market is likely to destroy option premiums or stop out tight leverage. Wait for the candles to return to Green or Red before acting.
2. The Entry Trigger
Enter a trade only when a text label (LONG or SHORT) appears.
Long Signal: Occurs when price closes above the Trend Line AND the market is not in a Chop zone.
Short Signal: Occurs when price closes below the Trend Line AND the market is not in a Chop zone.
3. The Exit Strategy
There are two ways to manage the trade once active:
The Trend Follower (Conservative): Hold the position until the Trend Line flips color. This captures the maximum duration of the move but may give back some profit at the very end.
The Stop Loss (Active): The Trend Line (the white value in your dashboard) acts as your Trailing Stop. If a candle closes beyond this line, the trend is technically invalidated. You should exit immediately.
4. Multi-Timeframe Alignment (The Golden Rule)
The highest win rates are achieved when your trading timeframe aligns with the higher-order trend.
Step 1: Check the 4-Hour chart. Is the Trend Line Green?
Step 2: Switch to the 15-Minute chart.
Step 3: Only take the LONG signals on the 15-Minute chart. Ignore all Short signals.
Reasoning: Counter-trend trades often fail. By trading only in the direction of the higher timeframe, you are swimming with the current, not against it.
Recommended Settings by Style
Swing Trading (Daily/4H): Keep the Trend Factor at 4.0. This ignores daily noise and keeps you in the trade for weeks or months.
Day Trading (1H/15m): Lower the Trend Factor to 3.0. This makes the system more reactive to intraday reversals.
Scalping (5m): Lower the Trend Factor to 2.0 and the ATR Length to 7. This is aggressive and requires strict adherence to the Stop Loss.
Disclaimer
This indicator is for educational and informational purposes only. It does not constitute financial advice, investment advice, or a recommendation to buy or sell any asset. Trading cryptocurrencies, stocks, and futures involves a high degree of risk and the potential for significant financial loss. The user assumes all responsibility for their trading decisions. Past performance of any system or indicator is not indicative of future results. Always practice risk management and never trade with money you cannot afford to lose.

JINN: A Multi-Paradigm Quantitative Trading and Execution EngineI. Core Philosophy: A Substitute for Static Analysis
JINN (Joint Investment Neural and Network) represents a paradigm shift from static indicators to a living, adaptive analytical ecosystem. Traditional tools provide a fixed snapshot of the market. JINN operates on a fundamentally different premise: it treats the market as a dynamic, regime-driven system. It processes market data through a hierarchical suite of advanced, interacting models, arbitrates their outputs through a rules-based engine, and adapts its own logic in real-time.
It is designed as a complete framework for traders who think in terms of statistical edge, market regimes, probabilistic outcomes, and adaptive risk management.
II. The JINN Branded Architecture: Your Command and Control Centre
JINN’s power emerges from the synergy of its proprietary, branded architectural components. You do not simply "use" JINN; you command its engines.
1. JINN Signal Arbitration (JSA) Engine
The heart of JINN. The JSA is your configurable arbitration desk for weighing evidence from all internal models. As the Head Strategist, you define the entire arbitration philosophy:
• Priority and Weighting : Define a "chain of command". Specify which model's opinion must be considered first and assign custom weights to their outputs, directly controlling the hierarchy of your analytical flow.
• Arbitration Modes :
First Wins: For high-conviction, rapid signal deployment based on your most trusted leading model.
Highest Score: A "best evidence" approach that runs a full analysis and selects the signal with the highest weighted probabilistic backing.
Consensus: An ultra-conservative, "all-clear" mode that requires a unanimous pass from all active models, ensuring maximum confluence.
2. JINN Threshold Fusion (JTF) Engine
Static entry thresholds can be limiting in a dynamic market. The JTF engine replaces them with a robust, adaptive "breathing" channel.
• Kalman Filter Core : A noise-reducing, parametric filter that provides a smooth, responsive centre for the entry bands.
• Exponentially Weighted Quantile (EWQ) : A non-parametric, robust measure of the signal's recent distribution, resistant to outliers.
• Dynamic Fusion : The JTF engine intelligently fuses these two methodologies. In stable conditions, it can blend them; in volatile conditions, it can be configured to use the "Minimum Width" of the two, ensuring your entry criteria are always the most statistically relevant.
3. JINN Pattern Veto (JPV) with Dynamic Time Warping
The definitive filter for behavioural edge and pattern recognition. The JPV moves beyond value-based analysis to analyse the shape of market dynamics.
• Dynamic Time Warping (DTW) : A powerful algorithm from computer science that compares the similarity of time series.
• Pattern Veto : Define a "toxic" price action template—a pattern that has historically preceded failed signals. If the JPV detects this pattern, it will veto an otherwise valid trade, providing a sophisticated layer of qualitative, shape-based filtering.
4. JINN Flow VWAP
This is not a standard VWAP. The JINN Flow VWAP is an institutionally-aware variant that analyses volume dynamics to create a "liquidity pressure" band. It helps visualise and gate trades based on the probable activity of larger market participants, offering a nuanced view of where significant flow is occurring.
III. The Advanced Model Suite: Your Pre-Built Quantitative Toolkit
JINN provides you with a turnkey suite of institutional-grade models, saving you thousands of hours of research and development.
1. Auto-Tuning Hyperparameters Engine (Online Meta-Learning)
Markets evolve. A static strategy is an incomplete strategy. JINN’s Auto-Tuning engine is a meta-learning layer inspired by the Hedge (EWA) algorithm, designed to combat alpha decay.
• Portfolio of Experts : It treats a curated set of internal strategic presets as a portfolio of "experts".
• Adaptive Weighting : It runs an online learning algorithm that continuously measures the risk-adjusted performance of each expert (using a sophisticated reward function blending Expected Value and Brier Score).
• Dynamic Adaptation : The engine dynamically allocates more influence to the expert strategy that is performing best in the current market regime, allowing JINN’s core logic to adapt without manual intervention.
2. Lorentzian Classification and PCA-Lite EigenTrend
• Lorentzian Engine : A powerful probabilistic classifier that generates a continuous probability (0-1) of market state. Its adaptive, volatility-scaled distribution is specifically designed to handle the "fat tails" and non-Gaussian nature of financial returns.
• PCA-Lite EigenTrend : A Principal Component Analysis engine. It reduces the complex, multi-dimensional data from the Technical and Order-Flow ensembles into a single, maximally descriptive "EigenTrend". This factor represents the dominant, underlying character of the market, providing a pure, decorrelated input for the Lorentzian engine and other modules.
3. Adaptive Markov Chain Model
A forward-looking, state-based model that calculates the probability of the market transitioning between Uptrend, Downtrend, and Sideways states. Our implementation is academically robust, using an EMA-based adaptive transition matrix and Laplace Smoothing to ensure stability and prevent model failure in sparse data environments.
IV. The Execution Layer: JINN Execution Latch Options
A good signal is worthless without intelligent execution. The JINN Execution Latch is a suite of micro-rules and safety mechanisms that govern the "last mile" of a trade, ensuring signals are executed only under optimal, low-risk conditions. This is your final pre-flight check.
• Execution Latch and Dynamic Cool-Down : A core safety feature that enforces a dynamic cool-down period after each trade to prevent over-trading in choppy, whipsaw markets. The latch duration intelligently adapts, using shorter periods in low-volatility and longer periods in high-volatility environments.
• Volatility-Scaled Real-Time Threshold : A sophisticated gate for real-time entries. It dynamically raises the entry threshold during sudden spikes in volatility, effectively filtering out noise and preventing entries based on erratic, unsustainable price jerks.
• Noise Debounce : In market conditions identified as "noisy" by the Shannon Entropy module, this feature requires a real-time signal to persist for an extra tick before it is considered valid. This is a simple but powerful heuristic to filter out fleeting, insignificant price flickers.
• Liquidity Pressure Confirmation : An institutional-grade check. This gate requires a minimum threshold of "Liquidity Pressure" (a measure of volume-driven momentum) to be present before validating a real-time signal, ensuring you are entering with market participation on your side.
• Time-of-Day (ToD) Weighting : A practical filter that recognises not all hours of the trading day are equal. It can be configured to automatically raise entry thresholds during historically low-volume, low-liquidity sessions (e.g., lunch hours), reducing the risk of entering trades on "fake" moves.
• Adaptive Expectancy Gate : A self-regulating feedback mechanism. This gate monitors the strategy's recent, realised performance (its Expected Value). If the rolling expectancy drops below a user-defined threshold, the system automatically tightens its entry criteria, becoming more selective until performance recovers.
• Bar-Close Quantile Confirmation : A final layer of confirmation for bar-close signals. It requires the signal's final score to be in the top percentile (e.g., 85th percentile) of all signal scores over a lookback period, ensuring only the highest conviction signals are taken.
V. The Contextual and Ensemble Frameworks
1. Multi-Factor Ensembles and Bayesian Fusion
JINN is built on the principle of diversification. Its signals are derived from two comprehensive, fully customizable ensembles:
• Technical Ensemble : A weighted combination of over a dozen technical features, from cyclical analysis (MAMA, Hilbert Transforms) and momentum (Fisher Transform) to trend efficiency (KAMA, Fractal Efficiency Ratio).
• Order-Flow Ensemble : A deep dive into market microstructure, incorporating Volume Delta, Absorption, Imbalance, and Delta Divergence to decode institutional footprints.
• Bayesian Fusion : Move beyond simple AND/OR logic. JINN’s Bayesian engine allows you to probabilistically combine evidence from trend and order-flow filters, weighing each according to its perceived reliability to derive a final posterior probability.
2. Context-Aware Framework and Entropy Engine
JINN understands that a successful strategy requires not just a good entry, but an intelligent exit and a dynamic approach to risk.
• Shannon Entropy Filter : A direct application of information theory. JINN quantifies market randomness and allows you to set a precise entropy ceiling to automatically halt trading in unpredictable, high-entropy conditions.
• Adaptive Exits and Regime Awareness : The script uses its entropy-derived regime awareness to dynamically scale your Take Profit and Trailing Stop parameters . It can be configured to automatically take smaller profits in choppy markets and let winners run in strong trends, hard-coding adaptive risk management into your system.
VI. The Dashboard: Your Mission Control
JINN features a dynamic, dual-mode dashboard that provides a comprehensive, real-time overview of the entire system's state.
Mode 1: Signal Gate Metrics Dashboard
This dashboard is your pre-flight checklist. It displays the real-time Pass/Fail/Off status of every single gating and filtering component within JINN, including:
• Core Ensembles : Technical and Order-Flow Ensemble status.
• Trend Filters : VWAP, VWMA, ADX, ATR Slope, and Linear Regression Angle gates.
• Advanced Models : Dual-Lorentzian Consensus, Markov Probability, and JPV Veto status.
• Regime and Safety : Shannon Entropy, Execution Latch, and Expectancy Gate status.
• Final Confirmation : A master "All Hard Filters" status, giving you an at-a-glance confirmation of system readiness.
Mode 2: Quantitative Metrics Dashboard
This dashboard provides a high-level, institutional-style data readout of the current market state, as seen through JINN's analytical lens. It includes over 60 key metrics for both Signal Gate and Quantitative Metrics, such as:
• Ensemble and Confidence Scores : The raw numerical output of the Technical, Order-Flow, and Lorentzian models.
• Volatility and Volume Analysis : Realised Volatility (%), Relative Volume, Volume Sigma Score, and ATR Z-Score.
• Momentum and Market Position : ADX, RSI Z-Score, VWAP Distance (%), and Distance from 252-Bar High/Low.
• Regime Metrics : The numerical value of the Shannon Entropy score and the Model Confidence score.
VII. The User as the Head Strategist
With over 178 meticulously designed user inputs, JINN is the ultimate "glass box" engine. The internal code is proprietary, but the control surface is transparent and grants you architectural-level command.
• Prototype Sophisticated Strategies : Test complex, multi-model theses at your own pace that would otherwise take weeks of coding. Want to test a strategy that uses a Lorentzian classifier driven by the EigenTrend, arbitrated by JSA in "highest score" mode, and filtered by a strict Markov trend gate? These can be configured and unified.
• Tune the Engine to Any Market : The inputs provide the control surface to optimise JINN's behaviour for specific assets and timeframes, from crypto scalping to swing trading indices.
• Build Trust Through Configuration : The granular controls allow you to align the script's behaviour precisely with your own market view, building trust in your own deployment of the tool.
JINN is a commitment. It is a tool for the serious analyst who seeks to move from discretionary trading to a systematic, quantitative, and adaptive approach. If this aligns with your philosophy, we invite you to apply for access.
Disclaimer
This script is for informational and educational purposes only. It does not constitute financial, investment, or trading advice, nor is it a recommendation to buy or sell any asset.
All trading and investment decisions are the sole responsibility of the user. It is strongly recommended to thoroughly test any strategy on a paper trading account for at least one week before risking real capital.
Trading financial markets involves a high risk of loss, and you may lose more than your initial investment. Past performance is not indicative of future results. The developer is not responsible for any losses incurred from the use of this script.

Rate Of Change With HistogramCustomized standard ROC indicator to represent as Histogram instead of standard line