Catana Stochastic 4 in 1Catana Stochastic 4 in 1
Description
Catana Stochastic 4 in 1 is an excellent indicator to identify when the price trend of an asset, be it bullish or bearish, begins to run out. If an operator can identify that moment, he will be in optimal conditions to issue the corresponding market orders and to be able to take full advantage of the next price movement.
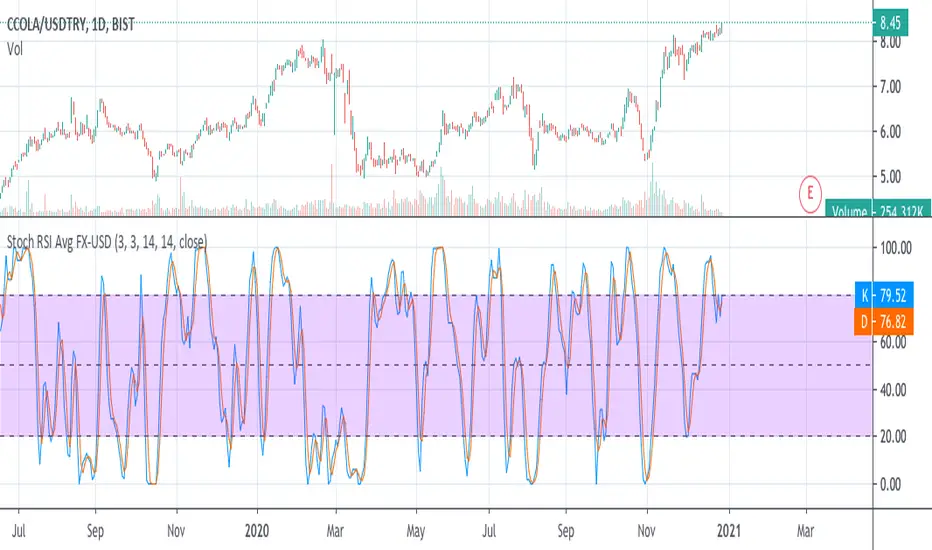
This indicator is represented by lines ranging between 80 and 20. These lines are called K and D.
Strategy
Overbought. When the blue and red lines are overbought, that is, at 80% of the indicator, it is a sell signal. The confirmation to enter into operation is given when the blue line crosses the red line.
Oversold. When the blue and red lines are oversold, that is, at 20% of the indicator, it is a buy signal. The confirmation to enter into operation is given when the blue line crosses the red line.
อินดิเคเตอร์ Pine Script®