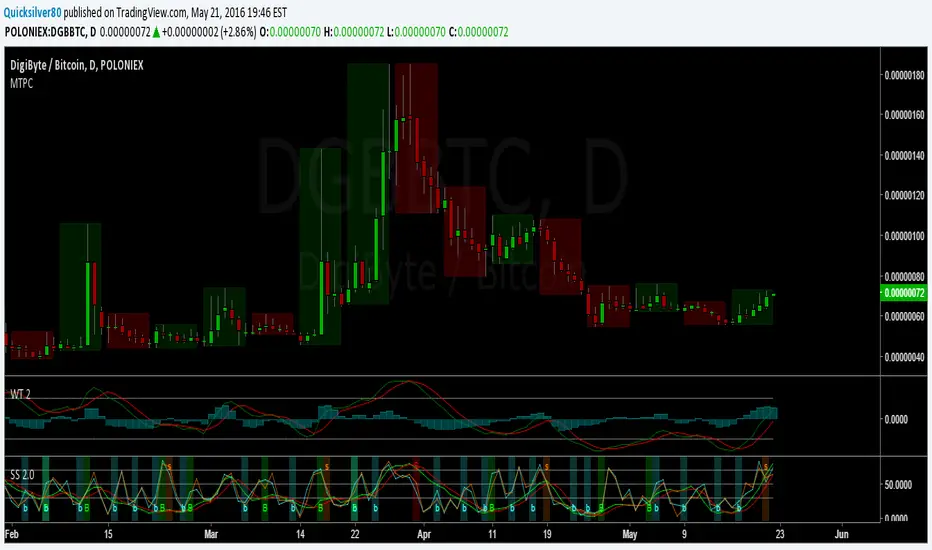
Super StochAdded signal functionality to StochRSI 2
Set Default Resolution of StochRSI 1 to "D" and StochRSI 2 to "240"
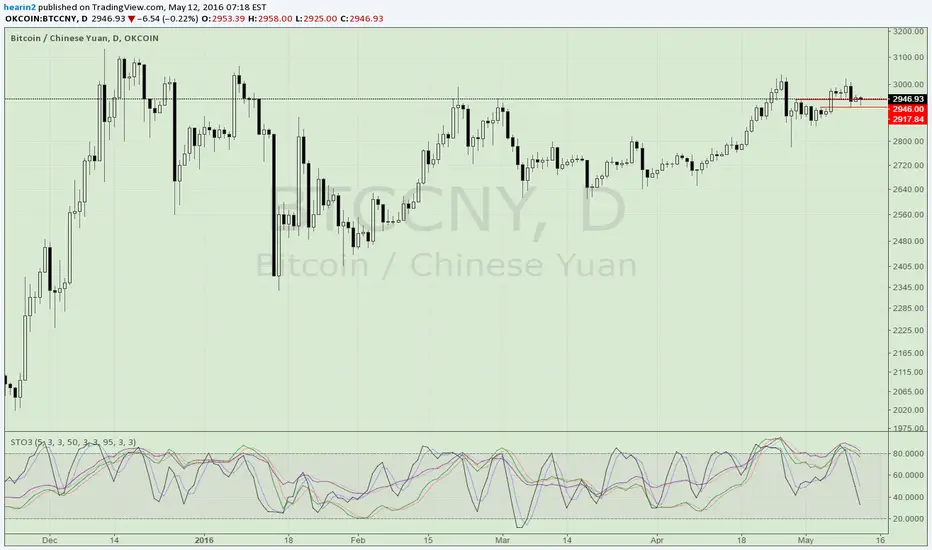
Stochastic Oscillator
Stochastic HistogramLast Edited: 5/19/16
Description:
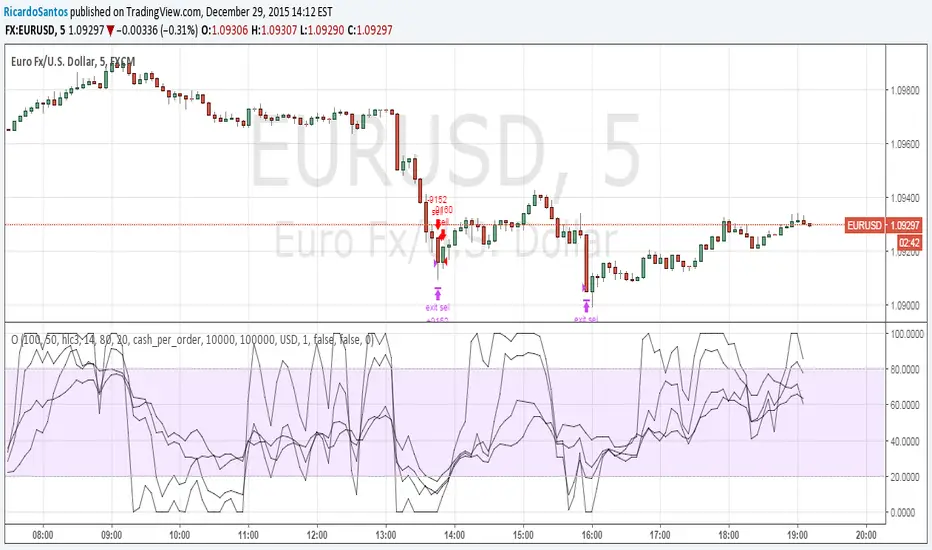
This is a basic Stochastic histogram that essentially shows when the indicator
is either above or below the 50 level. Colors can be customized to your liking.
Length and smoothing factor can be adjusted as well. Defaults are 14 (Length)
and 3 (Smoothing Factor).
NOTE: The above chart contains the built-in stochastic indicator for comparison.

Stochastic Weighted Average for use on H1A weighted average of Hourly, Daily, Weekly and Monthly Stochastic.

SMI BarsUses SMI (Stochastic Momentum Index) to set bar colors:
When SMI above overbought, bar color is red.
When SMI is between 0 and overbought, bar color is maroon
When SMI is between oversold and 0, bar color is green
When SMI is below oversold, bar color is lime.
When SMI crosses above or below 0, bar color is orange.

MACD + Stochastic, Double Strategy (by ChartArt)This strategy combines the classic stochastic strategy to buy when the stochastic is oversold with a classic MACD strategy to buy when the MACD histogram value goes above the zero line. Only difference to the classic stochastic is a default setting of 71 for overbought (classic setting 80) and 29 for oversold (classic setting 20).
Therefore this strategy goes long if the MACD histogram goes above zero and the stochastic indicator detects a oversold condition (value below 29). If the inverse logic is true, the strategy goes short (stochastic overbought condition with a value above 71 and the MACD histogram falling below the zero line value).
Please be aware that this pure double strategy using simply two classic indicators does not have any stop loss or take profit money management logic.
All trading involves high risk; past performance is not necessarily indicative of future results. Hypothetical or simulated performance results have certain inherent limitations. Unlike an actual performance record, simulated results do not represent actual trading. Also, since the trades have not actually been executed, the results may have under- or over-compensated for the impact, if any, of certain market factors, such as lack of liquidity. Simulated trading programs in general are also subject to the fact that they are designed with the benefit of hindsight. No representation is being made that any account will or is likely to achieve profits or losses similar to those shown.

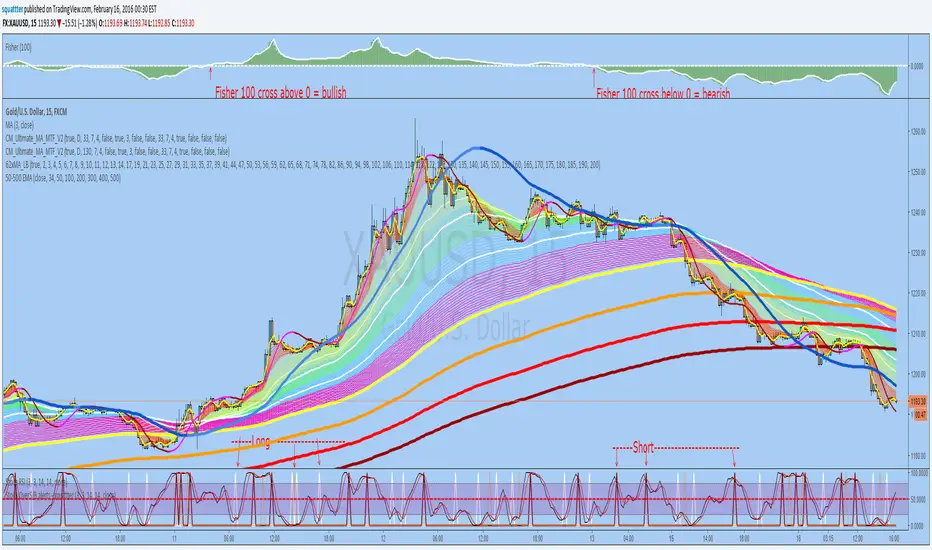
StochRSI overSold/Bought alerts - by squattterDepending on the new trend - Fisher 100 crossing 0;
Set an alert on each Long/Short "crossing down", 0.8 (or anything below 0.99), "on condition"


[STRATEGY][RS]MarxBabu 4 Oscillators V0EXPERIMENTAL:
fixed some mixed signals :p
request for MarxBabu.
[RS]Khizon (DWTI) Strategy V0Request for Khizon01:
corrected a issue with the default stoch rsi settings (14 smoothing when it should be 3), can always change back since the 14 settings were better performing at the current chart.
added option to just open buy trades or sell trades separately and close were previously swing trade occur.
added plot titles.

Stochastic In BandsWhat about to display Stochastic Oscilator in EMA-ATR Bands? If you like the idea I would code advanced version

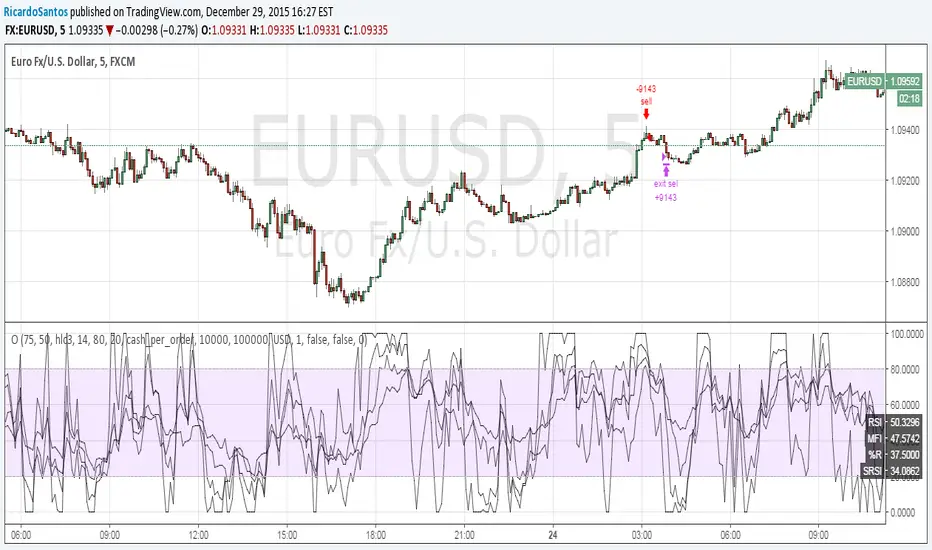
Stochastic + RSI, Double Strategy (by ChartArt)This strategy combines the classic RSI strategy to sell when the RSI increases over 70 (or to buy when it falls below 30), with the classic Stochastic Slow strategy to sell when the Stochastic oscillator exceeds the value of 80 (and to buy when this value is below 20).
This simple strategy only triggers when both the RSI and the Stochastic are together in a overbought or oversold condition. The one hour chart of the S&P 500 worked quite well recently with this double strategy.
By the way this strategy should not be confused with the 'Stochastic RSI', which measures the RSI only.
All trading involves high risk; past performance is not necessarily indicative of future results.


Jinqian168_V2RSI, EMA of RSI, EMA of RSI's EMA, and Stochastic.
V2 added Price Bar Coloring. Buy when Orange or Green, Sell when Yellow or Red.

Sniper Stochastics Sniper Stochastics is a triple stochastic system.
Basically, watch the 20 and 80 crossovers. However, the settings of the three stochastics correspond to Fibonacci numbers 55, 89, and 144.
Since we have a fast, medium and slow speed stochastics; we can also watch the crossovers.
I have found that When the Red (144) is on top, it usually signals a turn upwards; conversely, a blue (89) on top of the others means that the market is going to go down.
So red on top = bullish and blue on top= bearish.
You can also think of them in terms of efficiency. If they all display the same and are overlapping in a single line; crossing an 80 or 20 line, this is a strong signal - bullish or bearish.
If on the other hand, you see them splayed out and moving away from eachother but the same direction; it signals a more inefficient process and thus a weaker signal.
I really enjoy using these and I hope you will too.
On the settings, I have turned off the %D so that they display only %K's. The Default is 55, 89 ,144.

RSI Stochastic Extreme Combo alertThis script will give you red or green columns as an indication for oversold/overbought based upon the rsi and stochastic both being at extreme levels (you set). The default oversold is at 35. If Stochastic and RSI fall below 35, you will get a green column (Both indicators at the extreme). Play with your levels to see how your stock reacts. RSI and Stochastic can both be changed along with each of the levels you would like the color change. I have set mine at RSI low: 37, RSI high: 63, Stoch low: 10, and Stoch high: 90. These levels have been working well for me on AAPL. Enjoy and don't forget to leave a comment if it helps your trading or you have other ideas about what is working for you.

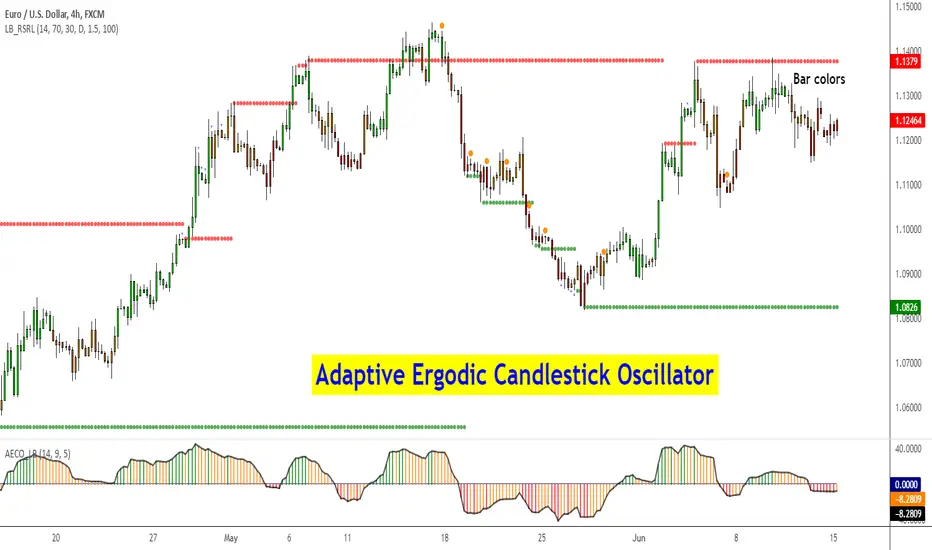
Adaptive Ergodic Candlestick Oscillator [LazyBear]This updates Blau's excellent Candlestick oscillator to be adaptive by using the length of a scaled stochastic indicator and an exponent (for calculating the smoothing coefficient) to obtain the moving average.
Check out the options page for configurable variables.
More info on Ergodic Oscillator:
Book: "Momentum, Direction and Divergence" by William Blau
List of my public indicators: bit.ly
List of my app-store indicators: blog.tradingview.com
Candlestick Patterns With EMA and Stochastic6/11/15, Corrected barcolor errors.
Candlestick patterns identified and color coded according to position above or below 8EMA(TLine).
Special thanks to repo32, DavidR, and Chris Moody for coding ideas.
Bullish candlestick buy signals have a greater probability of success when Stochastics are oversold. Bearish ones have a
greater probability of success when overbought. Stack as many factors in your favor as possible. A candlestick signal by itself is of little value unless you apply additional information with it. An 8 EMA is coded also to help with buy/sell signals. Some of the videos by Steven Bigalow are on the Web to see how he uses it.
www.youtube.com
Regardless of systems and strategies used, make your second trade first: Know when you're going to exit. Risk management rules. Good luck and good trading.

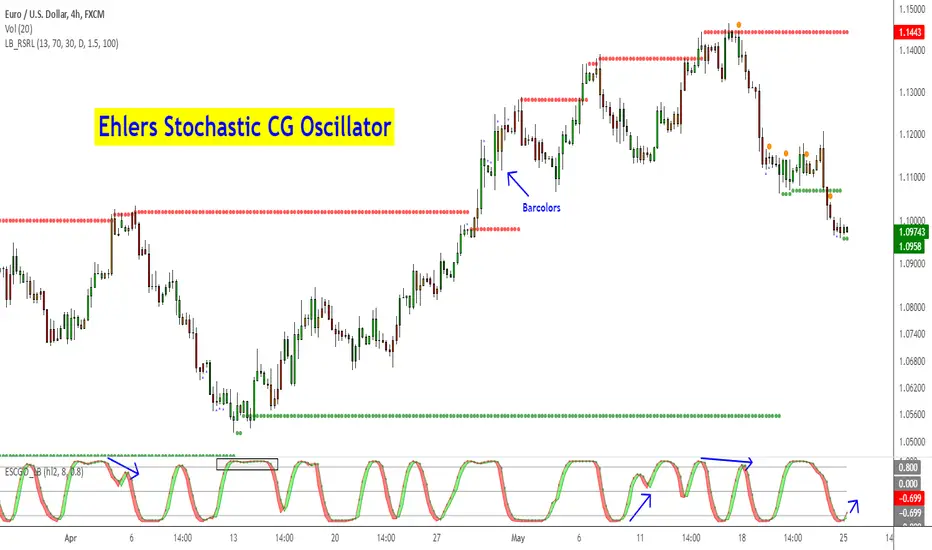
Ehlers Stochastic CG Oscillator [LazyBear]Another one from Ehlers.
Ehlers likes the idea behind StochRSI so much, he dedicated a full chapter in his book (linked below) on how stoch works with his "superlative" (his words, not mine) indicators. This is stoch of his CG oscillator.
Standard stochastic oscillator uses fixed period for calculations and does not adjust to the constantly changing market cycle length. Stochastic CG Oscillator does not have such a drawback.
Use this like normal stochRSI osc (Uncheck "Fill Osc/Trigger" option, sample chart below)
More info:
- CG oscillator:
- Cybernetic Analysis for Stocks and Futures (Ehlers)
List of my public indicators: bit.ly
List of my app-store indicators: blog.tradingview.com
Stoch_VX3Stoch_VX3
Upgrade from Stoch_VX2
*Cross over markers
*Directional bgcolor indication
To run in line with the VX family / or stand alone :-
Baseline_VX1
MACD_VX1
Stoch_VX3 (this one)
/Strategy, line up all three, place your bets - Black or Green :)

DiNapoli MACD & Stoch [LazyBear] --- Updated: May 19 2015 ----
Applicable only If you are setting up alerts:
I noticed I have switched the plot names. Histo shd be the MACD and DMACD shd be the Signal.
Replace lines 16 & 17 with these to get the correct names. NOTE that no functionality is affected, just the names.
plot(r, style=columns, color=r>0?green:red, transp=80, title="Dinapoli MACD")
plot(s, color=teal, linewidth=2, title="Trigger")
--- Original Description ---
These two indicators are from one of my favorite books - DiNapoli's Levels. These are custom MACD and Stoch used by him. There are more indicators - Detrended Osc, DisplacedMA - that he uses, will publish them all later.
The settings of normal MACD/Stoch can be tuned to obtain these DiNapoli indicators, or if you are lazy (like me!) just use these :)
DiNapoli Preferred Stoch source: pastebin.com
More info:
www.amazon.com
List of my public indicators: bit.ly
List of my app-store indicators: blog.tradingview.com
