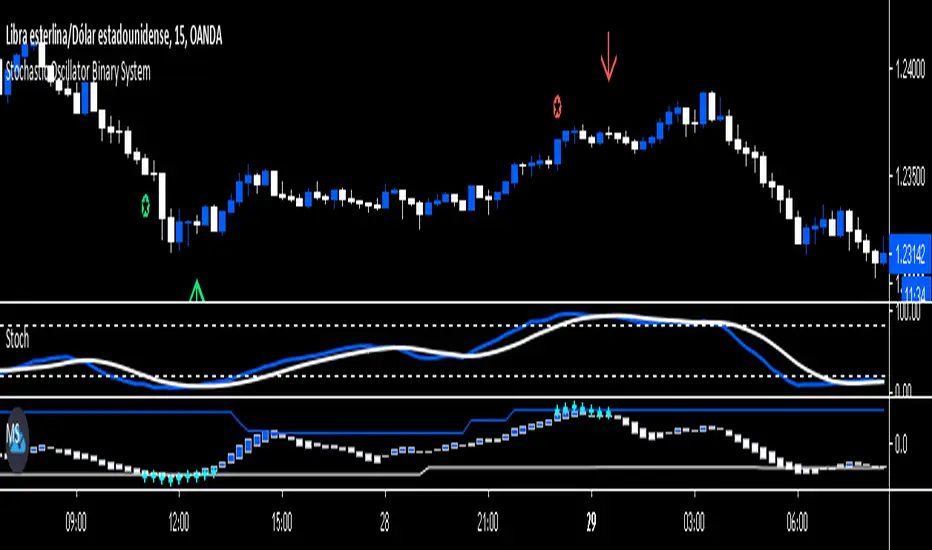
Stochastic Oscillator Binary System by Hashtag_binaryRules
- Time Frame 1 min.
- Expires Time 3 min or 15 min (the best option).
- Markets: Forex (only volatile currency pair), Futures.
- Sessions: London and New York.
Call
- Heiken Ashi Dodger blue;
-Stochastic Oscillator cross upward from oversold Zone (conservative trade, aggressive trade: Stochastic Oscillator cross upward ).
-Matrix three square dodger blue.
Put
- Heiken Ashi white;
- Stochastic Oscillator cross downward from overbougth Zone (conservative trade, aggressive trade: Stochastic Oscillator cross downward ).
- Matrix three square withe.
This Binary System is also good for trade scalping. The same rule for entry with conservative trade:
Exit position options
- For Buy close position when the stochastic line touches 80 levels,
- For Sell close positions when stochastic line touches 20 levels.
- Initial Stop loss on the previous swing.
Stochastic Oscillator
Stoch+RSI With Color Combination. Hello Everyone This Indicater Base on (RSI and Stoch) COMBINATION With Color Combination.
You Can also use for
1-Divergence.
2-Overbought.
3-Oversold.
4-Breakout.
5-Support & Resistance Zones.

Jackrabbit.modulus.StochasticThis is the Stochastic for the Jackrabbit suite and modulus framework.
This indicator supports differential timeframe analysis and confirmational bias. Dynamic timeframes are supported.
This is an updated view of Stochastic and supports traditional overbought/sold boundaries and cross over regions.
The main indicatior and the confirmational indicator can both be individually tuned for the %K, and %D moving averages with different and independent lengths and 30 different moving average types:
SMA, Double SMA, Triple SMA,
EMA, Double EMA, Triple EMA,
RMA, Double RMA, Triple RMA
WMA, Double WMA, Triple WMA,
VWMA, Double VWMA, Triple VWMA,
Hull, Double Hull, Triple Hull,
ZLEMA, Double ZLEMA, Triple ZLEMA,
SWMA, Double SWMA, Triple SWMA,
SSMA, Double SSMA, Triple SSMA,
SMMA,Double SMMA, Triple SMMA
The Jackrabbit modulus framework is a plug in play paradigm built to operate through TradingView's indicator on indicatior (IoI) functionality. As such, this script receives a signal line from the previous script in the IoI chain, and evaluates the buy/sell signals appropriate to the current analysis. The results are either combined with the signal line, or used as confirmation to the signal line. A new signal line is generated for the next script in the link.
This script is not designed or meant to function outside my framework and contains no alert capabilities.
By default, the signal line is visible and the charts are turned off. Signal line visibility is controlled by the Style tab, and the charts display is controlled by the indicator settings tab.
This script is by invitation only. To learn more about accessing this script, please see my signature or send me a PM. Thank you.

Superb RSI Signal by Lukas, Version 1.0.0Buy and Sell Signal base on many momentum indicator.
Only works on Forex Major Pairs :)
I test on 1H timeframe and its looks good.
Use DEMA 20 for entry point, always entry near DEMA 20 for maximum profit, use your trailing stop and stop loss 1 ATR from entry.
Circle on top : trend 1st resolution
Circle on bottom : trend 2nd resolution
Set second resolution with higher timeframe for safer trade or lower timeframe for aggressive trade.
You can play around with other settings, it's about sensitivity.
Hope it useful,
Cheers.

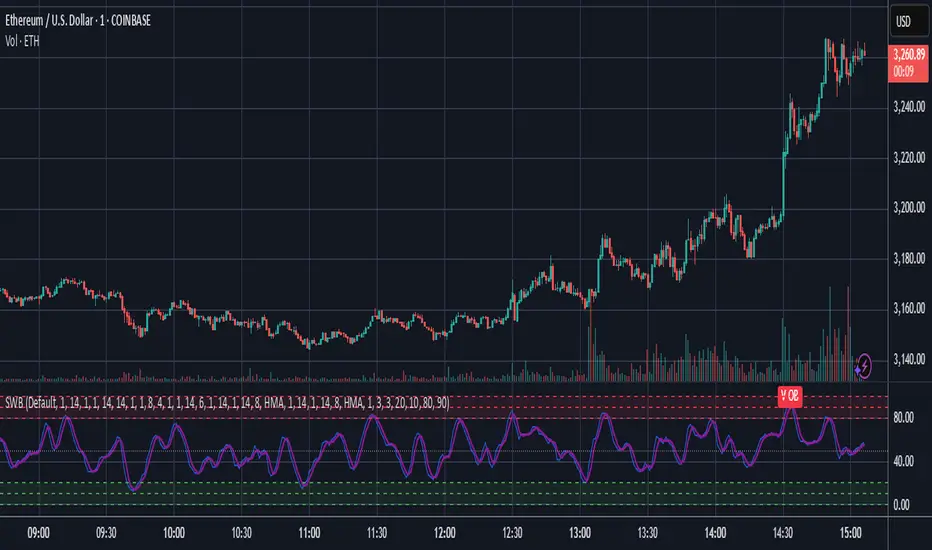
Stochastic Weights - Basic [BigBitsIO]This script is a compilation of several different stochastic indicators (and RSI) where the K value of each indicator is equally weighted. The purpose of the indicator is to combine many indicators together in a fashion that weights them easier. By default, the Stochastic and Stochastic RSI are both enabled - the idea is to speed up the relatively slower Stochastic and to slow down the relatively fast Stochastic RSI. Other Stochastics are also available, including some of my own custom calculations that can also be added to the weighted calculation. Only the K value is weighted, as the D value is just a moving average of the weighted K.
Explained:
- Calculates enabled indicators
- Calculates the weighted value of K for enabled indicators
- Calculates a D value from the weighted K
FAQ:
- Why is this script useful?
- To weight multiple indicators together so that you can attempt to find optimal values shared amongst the indicators. Ex: If Stochastic RSI is 100 and Stochastic is 50, K would be 75 and not particularly high. If you add in a 50 RSI, the K would be 67 in this example. If we weight indicators together that all have a high value they could potentially help find elements that align together to produce a stronger signal.
DISCLAIMER: For educational and entertainment purposes only. Nothing in this content should be interpreted as financial advice or a recommendation to buy or sell any sort of security or investment including all types of crypto. DYOR, TYOB.
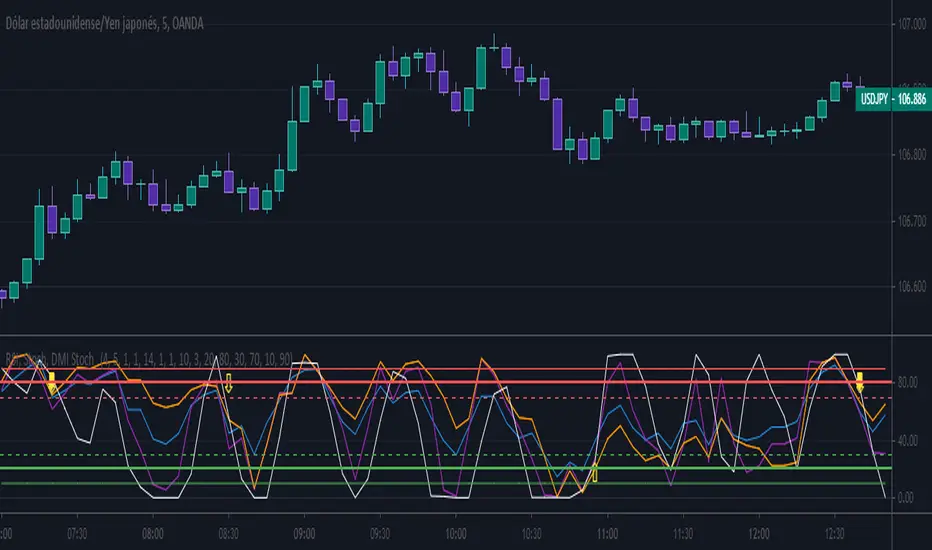
RSI, Stoch, DMI Stoch / By Mochero
With this indicator, we seek to find convergence of RSI, Stoch and DMI for purchases or sales.
Search Buy when,
-Rsi over sold
-Stoch over sold
-DMI Over sold
Search Sell when,
-Rsi oon purchased
-Stoch on purchased
-DMI on purchased
Suggested values
Rsi: 4
Stoch: 5.1.1
DMI: 10.3
Suggested time, 5M 15M
CCU MFI + RSI + STOCH RSIThis demonstrates the accuracy of entry signal of the MFI + RSI + STOCH RSI strategy

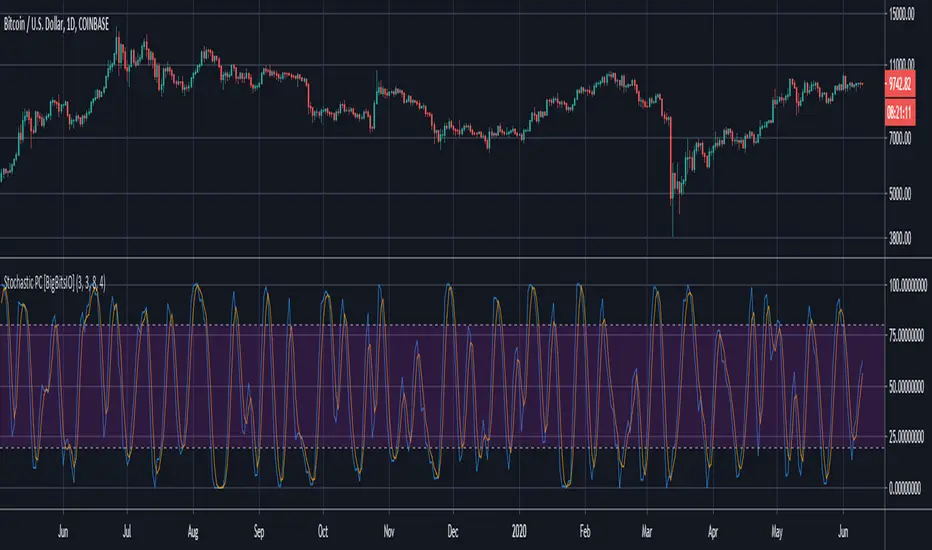
Stochastic PC [BigBitsIO]This script is a very simple stochastic calculation similar to Stochastic RSI that calculates a stochastic value of a moving average of the percentage price change. The purpose of the indicator is to find positive and negative volatility momentum peaks which might be able to help identify changes in trends. Like other stochastic indicators, it may be best used in combination with other indicators.
Explained:
- First gets the % change for the candle from open to close. Green candles produce positive values, red candles produce negative values.
- Then it creates a moving average of that number to try and reduce impacts of very large moves, although this can be changed with the super-fast smoothed length setting. Set it to 1 to remove all smoothing.
- After that, it creates a K value using a stochastic calculation based on the range of the price change moving average we created in the previous step. Set the smoothK to one to use a fast stochastic calculation, it is a slow stochastic calculation by default (3-period SMA of stochastic)
- Finally, to create the D value it calculates a 3-period SMA of the K value.
FAQ:
- Why is this script useful?
- This script can help identify the peaks and valleys of volatility momentum
DISCLAIMER: For educational and entertainment purposes only. Nothing in this content should be interpreted as financial advice or a recommendation to buy or sell any sort of security or investment including all types of crypto. DYOR, TYOB.
2. AutoBots Trading - BACKTEST: StochasticBACKTEST: Stochastic
1. Description: a momentum indicator comparing a particular closing price of a security to a range of its prices over a certain period of time. The sensitivity of the oscillator to market movements is reducible by adjusting that time period or by taking a moving average of the result. It is used to generate overbought and oversold trading signals, utilizing a 0-100 bounded range of values.
2. Strategy rules: defined based on the component, signal count, entry prices, open order count, position check, position averages, conditional closes and close signals.
3. Risk management: system was defined based on the choice of only long, only short or both sides. Defining the choice of take profit, stop loss and trailing stos (no repaint).
4. Symbol: BTCUSD (only)
5. Suggested Timeframe: D
6. Parameter for optimization: 7, 11, 1, false, 20, 80, side: both, tp: 5%, sl: 2.5%, ts: 2%/2%
7. Walk forward simulation
7.1. In sample period: jan/2018-jan/2020
7.2. Out of sample period: jan/2020 - ago/2020
** For purpose educate only

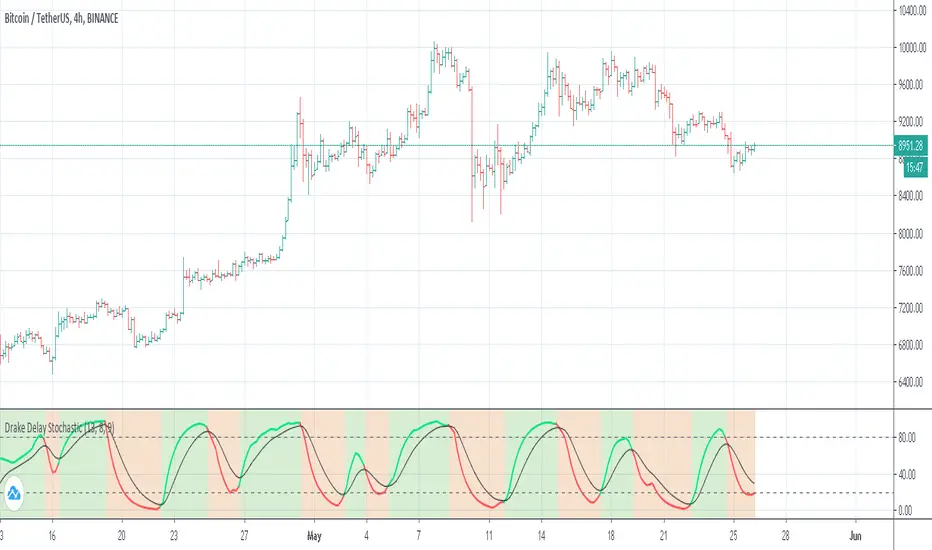
LIZ W STCH & TRENDStochastic for timely entry when the short-term reverse of the trend direction is over.
You can view two types of short-term configurations and medium-term configurations.
The color of the background changes from the order in which the three short-term moving average lines are displayed on the main chart.
(See Description of Another Indicator jp.tradingview.com
Wait for the long position to be held when the background is warm.
When the background is cold, wait for the timing to hold the short position.
When you have a long position, you will enter the price when you go up after touching the 20th line or when you go down below the 20th line and the price goes up after you go up above the 20th line.
If you have a short position, use the 80 line as a guideline to reverse the above.
When the background is gray, the volatility of the price movement may be reduced.
Since the direction of price fluctuations is often unclear and the price range is not clear, we should refrain from trading.
If you are interested in the invitation-only indicator, please contact us on private chat.
トレンド方向に対する短期的な逆行が終わった時、タイミングよくエントリーするためのストキャスティクスです。
短期間設定のものと、中期間設定のもの、2種類を表示できます。
メインチャートに表示されている短期移動平均線3本の並び順から背景の色が変化します。(こちらのインジケーターを参照 jp.tradingview.com
背景が暖色の時はロングポジションを持つタイミングを待ちます。
背景が寒色の時はショートポジションを持つタイミングを待ちます。
ロングポジションを持つ時は価格が“20ラインにタッチした後上昇した時“、“ラインを下回った後価格が上昇し20ラインを上回った時“にエントリーします。
ショートポジションを持つ時は80ラインを目安に、上記の反対を行います。
背景がグレーになっている時は値動きのボラティリティーが低下している可能性があります。
価格変動の方向性がはっきりせず値幅が出ない事が多いため、トレードを控えるべき期間です。
招待専用インジに興味ある方はプライベートチャットに連絡をください。

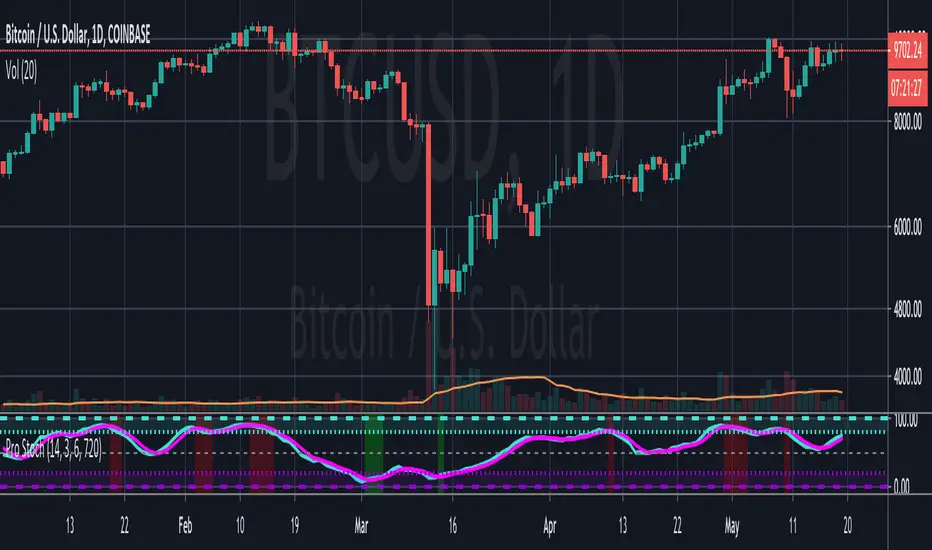
Lobowass 2 StochasticsThis script uses a DMI, Stochastic, and two stochastic RSI, when they are all overbought or oversold (also applying price action and looking for bounce points) we can obtain a greater probability that the price will go in the direction we expect
This script is compact, which can be very useful for many traders
Default values
DMI:
Lenght=10
Stolenght=3
Stochastic:
K=14
D=3
Smooth=3
RSI Stochastic:
K=3
D=3
Lenght=6
Lenght Stoch=6
RSI Stochastic 2:
K=3
D=3
Lenght=14
Lenght Stoch=14
The indicators configured in this way can bring greater efficiency, do not confront only them, also use price action or other confirmat
They are arranged in a graph, such that the DMI has the oversold at 10 and the overbought at 90, the stochastic oversold at 120 and overbought at 180, first stochastic RSI at oversold at 220 and overbought at 280, and last stochastic RSI at oversold at 320 and overbought at 380, you can configure them your way taking into account that the DMI range is from 0-100, stochastic 100-200, stochastic RSI 200-300 and stochastic RSI 2 from 300-400

TFi Double Stochastic StudyThe Study script uses Stochastic indicators for entry and exit a position.
The entry and exit points are visualized in the chart via green arrows and crosses; the position follows the exact behavior of the strategy script.
The study also creates alerts, which follow the exact position of the entry/exit markers.
How to use
The Study works with most timeframes and instruments.
I'm also providing a "strategy" version of this Study, which can be used to backtest the strategy.
List of parameters
"Stochastic Length" ... Number of bars for Stochastic indicators
"Stochastic Overbought" ... Stochastic overbought level
"Stochastic Overbought Down Trend" ... Stochastic overbought level for down trends
"Stochastic Oversold Up Trend" ... Stochastic oversold level for up trends
"Stochastic Oversold" ... Stochastic oversold level
"Stochastic Smooth K" ... Stochastic K smoothing
"Stochastic Smooth D" ... Stochastic D smoothing
"Stochastic Confirmed" ... Enable to confirm the indicator value within the current bar
"MA Filter Enabled" ... Enable an additional filter for entering a position; the entries only follow the overall trend
"MA Fast Period" ... Fast filter period
"MA Slow Period" ... Slow filter period
List of alerts
Entry Long' ... Enter long position
'Entry Short' ... Enter short position
'Exit Long/Short' ... Exit long/short position
How to access
This Study is a "Invite Only" script. Please use the link below or send me a message via Tradingview to obtain access to the strategy and study script.
For enabling the script in your Tradingview chart window, click on "Indicators" and select "Invite-Only Scripts".
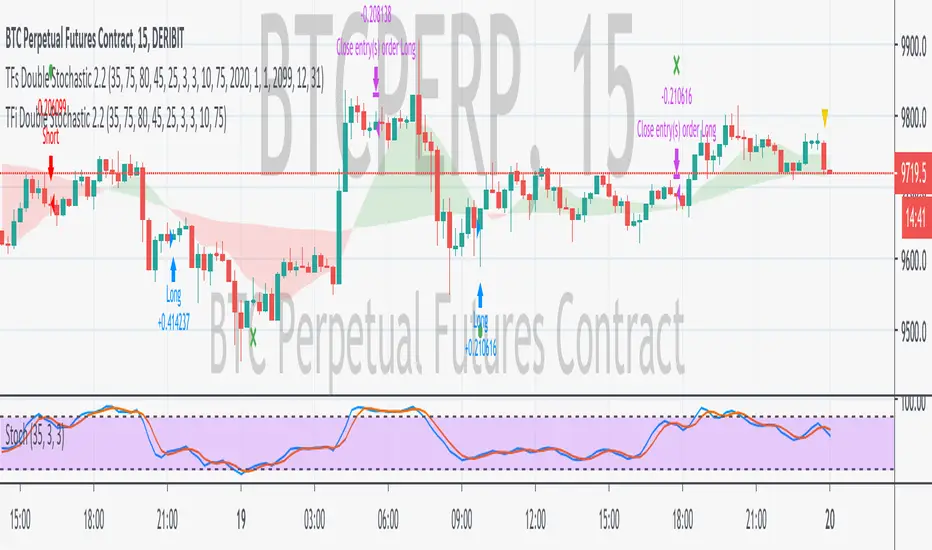
TFs Double Stochastic StrategyThe Strategy script uses Stochastic indicators for entering and exiting a position.
How to use
The strategy works with most timeframes and instruments.
I'm also providing a "study" version of this script, which can be used for automation of the strategy via alerts.
The script is using a default commission of 0.075% which reflects Bitmex' Taker-Fees. This is just a default and can be modified in the strategy settings for each instrument individually.
List of parameters
"Stochastic Length" ... Number of bars for Stochastic indicators
"Stochastic Overbought" ... Stochastic overbought level
"Stochastic Overbought Down Trend" ... Stochastic overbought level for down trends
"Stochastic Oversold Up Trend" ... Stochastic oversold level for up trends
"Stochastic Oversold" ... Stochastic oversold level
"Stochastic Smooth K" ... Stochastic K smoothing
"Stochastic Smooth D" ... Stochastic D smoothing
"MA Filter Enabled" ... Enable an additional filter for entering a position; the entries only follow the overall trend
"Fast Period" ... Fast filter period
"Slow Period" ... Slow filter period
"Backtest ..." ... Backtest timeframe; area outside this timeframe will be grayed out
How to access
This strategy is a "Invite Only" script. Please use the link below or send me a message via Tradingview to obtain access to the strategy and study script.
For enabling the script in your Tradingview chart window, click on "Indicators" and select "Invite-Only Scripts".

Pro StochasticsMy take on coding a Stochastic Indicator for professional use.
Contains many options and settings for you to tweak, and can be used on different timeframes.
I've also decided to make the code Open to all to use.
But it would be great if you credit me when you use my code. :)
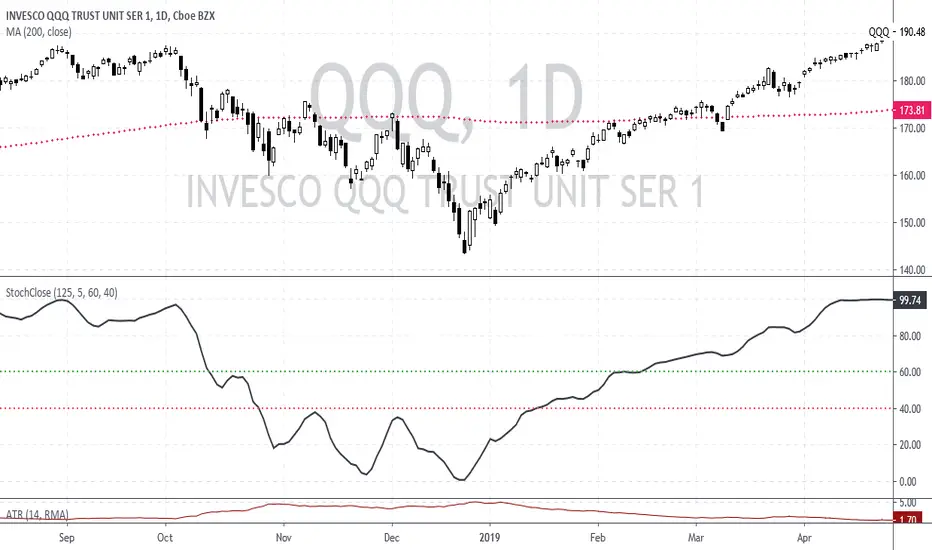
Stochastic based on Closing Prices - Identify and Rank TrendsStochClose is a trend indicator that can be used on its own to measure trend strength, in a scan to rank a group of securities according to trend strength or as part of a trend following strategy. Moreover, it acts as a volatility-adjusted trend indicator that puts securities on an equal footing.
StochClose measures the location of the current close relative to the close-only high-low range over a given period of time. In contrast to the traditional Stochastic Oscillator, this indicator only uses closing prices. Traditional Stochastic uses intraday highs and lows to calculate the range. The focus on closing prices reduces signal noise caused by intraday highs and lows, and filters out errant or irrationally exuberant price spikes.
Here are some examples when the high or low was out of proportion and suspect. Perhaps most famously, there were errant spike lows in dozens of ETFs in August 2015 (XLK, IJR, ITB). There were other spikes in VMBS (October 2014), IJR (October 2008) and KRE (May 2011). Elsewhere, there were suspicious spikes in IEI (April 2020), CHD (March 2020), CCRN (March 2020) and FNB (March 2020)
The preferred setting to identify medium and long-term uptrends is 125 days with 5 days smoothing. 125 days covers around six months. Thus, StochClose(125,5) is a 5-day SMA of the 125-day Stochastic based on closing prices. Smoothing with the 5-day SMA introduces a little lag, but reduces whipsaws and signal noise.
StochClose fluctuates between 0 and 100 with 50 as the midpoint. Values above 80 indicate that the current price is near the high end of the 125-day range, while values below 20 indicate that price is near the low end of the range. For signals, a move above 60 puts the indicator firmly in the top half of the range and points to an uptrend. A move below 40 puts the indicator firmly in the bottom half of the range and points to a downtrend.
StochClose values can also be ranked to separate the leaders from the laggards. In contrast to Rate-of-Change and Percentage Above/Below a Moving Average, StochClose acts as a volatility-adjusted indicator that can identify trend strength or weakness. The Consumer Staples SPDR is unlikely to win in a Rate-of-Change contest with the Technology SPDR. However, it is just as easy for the Consumer Staples SPDR to get in the top of its range as it is for the Technology SPDR. StochClose puts securities on an equal footing.
StochClose measures trend direction and trend strength with one number. The indicator value tells us immediately if the security is trending higher or lower. Furthermore, we can compare this value against the values for other securities. Securities with higher StochClose values are stronger than those with lower values.
Simple strategy IndicatorHello, this is my Indicator, based on my MACD+RSI+Stoch trading strategy
You can use it by your own and try to apply it on any market
Please, adjust any parameters and don't forget to leave a feedback and comments

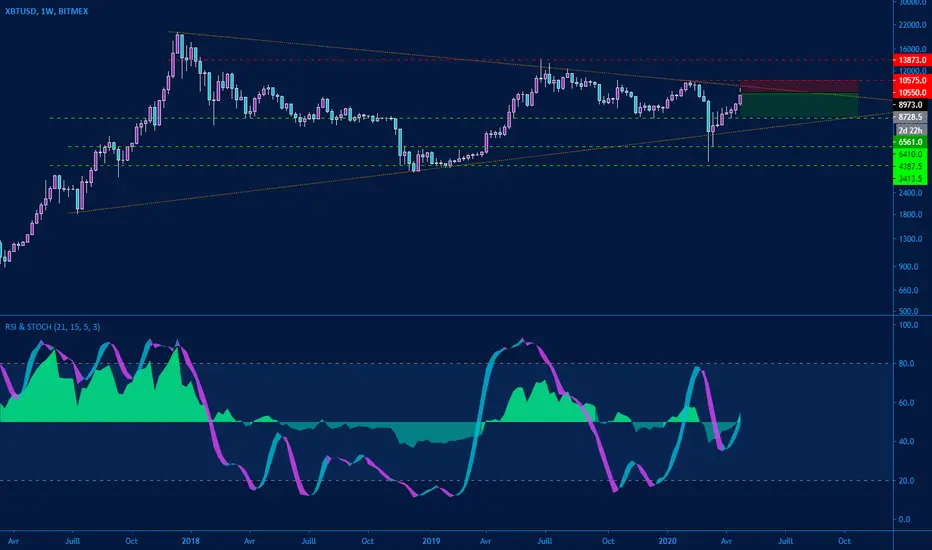
RSI & StochasticHello everyone,
I would like to share with you my new little toy...
It's an oscillator wich combine RSI based on his neutral value (50) and Stochastic on the same spot.
Defaults values are ( 21 ) for RSI and ( 15,5,3 ) for stochastic.
All parameters are editable...
I hope you will enjoy
Cheers,
Keep it Simple
Stochastic - UltimateI have to admit that the Stochastic Indicator is one of my favorite tools, but the default version is lacking some functionalities which I always wished they were there...
Therefore I decided to create an enhanced version of the Stochastic which now exactly fulfills my needs. I wanted to share it with the community in case someone else finds it useful.
So what is included?
- Full Stochastic (by default the settings are Length = 14 / K-Smooth = 6 / D-Smooth = 3, but you can change them to your liking)
- Oversold/Overbought limits can be customized - by default they are set to 20/80
- Red/Green line at the bottom indicates if K above D (green) or K below D (red) --> Indicates the general trend
- Background coloring for Stochastic crosses that happen in Oversold/Overbought area (buy/sell can be considered here)
- Stochastic RSI can be shown (= Stochastic indicator used on RSI value)
- Divergences on Stochastic can be displayed (Regular Bullish/Bearish & Hidden Bullish/Bearish)
- Optional: Show Highest/Lowest RSI since last Stochastic Cross
- Optional: Show label which indicates Target Price and Price distance to next K/D cross
Constructive Feedback is always welcome.
Enjoy.

Stochastic CandlesA series of up to 28 stochastics oscillators used to form an average stochastic value, which is then used to colour the candles based on the momentum.
Each candle can be coloured one of ten colours and each one represents a position on the stochastic oscillator.
The indicator helps traders to visualise the momentum and helps trend following.
Inputs:
MA: multiple smoothing methods
Theme: multiple colours
Increment: stochastic length start and increments
End: stochastic length end
Smooth: smooth stochastic
Stochastic Heat MapA series of 28 stochastic oscillators plotted horizontally and stacked vertically from bottom to top as the oscillator background.
Each oscillator has been interpreted and the value has been used to colour the lines in.
Lower lines are shorter term stochastics and higher lines are longer term stochastics.
The average of the 28 stochastics has been taken and then used to plot the fast oscillator line, which also has a slow oscillator line to follow.
The oscillator line can be used to colour in the candles.
Inputs:
MA: multiple smoothing methods
Theme: multiple colours
Increment: stochastic length start and increments
Smooth Fast: smooth fast length
Smooth Slow: smooth slow length
Paint Bars: colour candles
Waves: toggle method to weight/increment stochastics
Heat map shows momentum extremes:

Stochastic RibbonA series of highs and lows of different lengths to create a ribbon-like indicator to emulate the stochastic oscillator's top (100), middle (50) and bottom (0). Traders can determine the strength of the support and resistance by the number of converging lines, choose price points and visualise momentum waves.
Inputs:
Theme: multiple colours/themes (theme 2)
Length: high/low length (14)
Start: plot number to start ribbon on (1)
PlotNumber: number of plots to show; maximum 10 per top, middle, bottom (10)
Example:
Length: 14
Start: 5
PlotNumber: 10

Trend Checker by Hally - IndicatorIt is an indicator that overlaps MACD and Stochastics.
It has both characteristics.
The trend changes when two lines intersect.
I think the reaction is bad in the range market.
Also, when there are Stochastics and MACD lines above the indicator, it is possible to think whether it is overbought while riding the trend, and it may be helpful for making decisions such as "maybe it will reverse soon". Hmm.
Also, I think it is better to use it in combination with other indicators.
This is my first pine script, and I couldn't find it even if I searched for the script with overlapping indicators of different scales, so I tried making it by trial and error.
I hope it helps somebody trying to do the same.
MACDとStochasticsを重ね合わせたインジケーターです。
それぞれの特徴を併せ持っています。
2本のラインが交差する時トレンドが変化します。
レンジ相場では反応が悪いと思います。
また、インジケーターの上の位置にStochasticsとMACDラインがあるときはトレンドに乗りながらも買われすぎかどうか考えられることが出来ますし、「そろそろ反転するかも」などの判断の助けになるかもしれません。
また、他の指標との併用して使うほうが良いと思います。
pineスクリプトは初めてで、異なるスケールのインジケーターを重ね合わせていスクリプトは探しても見つからなかったので試行錯誤で作ってみました。
同じようなことをやろうとしてる誰かの参考になれば幸いです。
