Pivot Points Standard M, W, D (Monthly, Weekly & Daily)This script is based on Pivot Point Standard and is intended for educational purposes only.
"Pivot points are a technical indicator that is used to determine the levels at which price may face support or resistance.
Pivot Points indicator consists of a Pivot (P) level, several support (S) and several resistance (R)."
You can view the Daily timeframe - support/resistance.
You can view the Weekly timeframe - support/resistance.
You can view the Monthly timeframe - support/resistance.
Options to choose "Traditional" or "Fibonacci" or "Woodie" or "Classic" or "DM" or "Camarilla"
Options to choose historical pivots (Number of Pivots Back)
This tool can be handy in any trading process from short-long term trades or timeframes, multiple timeframe analysis, trend trades, swing trades, position trades, and momentum trades.
Credits
Credits to TradingView for original built-in source code
ค้นหาในสคริปต์สำหรับ "pivot"
Pivot S/R with Volatility Filter## *📌 Indicator Purpose*
This indicator identifies *key support/resistance levels* using pivot points while also:
✅ Detecting *high-volume liquidity traps* (stop hunts)
✅ Filtering insignificant pivots via *ATR (Average True Range) volatility*
✅ Tracking *test counts and breakouts* to measure level strength
---
## *⚙ SETTINGS – Detailed Breakdown*
### *1️⃣ ◆ General Settings*
#### *🔹 Pivot Length*
- *Purpose:* Determines how many bars to analyze when identifying pivots.
- *Usage:*
- *Low values (5-20):* More pivots, better for scalping.
- *High values (50-200):* Fewer but stronger levels for swing trading.
- *Example:*
- Pivot Length = 50 → Only the most significant highs/lows over 50 bars are marked.
#### *🔹 Test Threshold (Max Test Count)*
- *Purpose:* Sets how many times a level can be tested before being invalidated.
- *Example:*
- Test Threshold = 3 → After 3 tests, the level is ignored (likely to break).
#### *🔹 Zone Range*
- *Purpose:* Creates a price buffer around pivots (±0.001 by default).
- *Why?* Markets often respect "zones" rather than exact prices.
---
### *2️⃣ ◆ Volatility Filter (ATR)*
#### *🔹 ATR Period*
- *Purpose:* Smoothing period for Average True Range calculation.
- *Default:* 14 (standard for volatility measurement).
#### *🔹 ATR Multiplier (Min Move)*
- *Purpose:* Requires pivots to show *meaningful price movement*.
- *Formula:* Min Move = ATR × Multiplier
- *Example:*
- ATR = 10 pips, Multiplier = 1.5 → Only pivots with *15+ pip swings* are valid.
#### *🔹 Show ATR Filter Info*
- Displays current ATR and minimum move requirements on the chart.
---
### *3️⃣ ◆ Volume Analysis*
#### *🔹 Volume Change Threshold (%)*
- *Purpose:* Filters for *unusual volume spikes* (institutional activity).
- *Example:*
- Threshold = 1.2 → Requires *120% of average volume* to confirm signals.
#### *🔹 Volume MA Period*
- *Purpose:* Lookback period for "normal" volume calculation.
---
### *4️⃣ ◆ Wick Analysis*
#### *🔹 Wick Length Threshold (Ratio)*
- *Purpose:* Ensures rejection candles have *long wicks* (strong reversals).
- *Formula:* Wick Ratio = (Upper Wick + Lower Wick) / Candle Range
- *Example:*
- Threshold = 0.6 → 60% of the candle must be wicks.
#### *🔹 Min Wick Size (ATR %)*
- *Purpose:* Filters out small wicks in volatile markets.
- *Example:*
- ATR = 20 pips, MinWickSize = 1% → Wicks under *0.2 pips* are ignored.
---
### *5️⃣ ◆ Display Settings*
- *Show Zones:* Toggles support/resistance shaded areas.
- *Show Traps:* Highlights liquidity traps (▲/▼ symbols).
- *Show Tests:* Displays how many times levels were tested.
- *Zone Transparency:* Adjusts opacity of zones.
---
## *🎯 Practical Use Cases*
### *1️⃣ Liquidity Trap Detection*
- *Scenario:* Price spikes *above resistance* then reverses sharply.
- *Requirements:*
- Long wick (Wick Ratio > 0.6)
- High volume (Volume > Threshold)
- *Outcome:* *Short Trap* signal (▼) appears.
### *2️⃣ Strong Support Level*
- *Scenario:* Price bounces *3 times* from the same level.
- *Indicator Action:*
- Labels the level with test count (3/5 = 3 tests out of max 5).
- Turns *red* if broken (Break Count > 0).
Deep Dive: How This Indicator Works*
This indicator combines *four professional trading concepts* into one powerful tool:
1. *Classic Pivot Point Theory*
- Identifies swing highs/lows where price previously reversed
- Unlike basic pivot indicators, ours uses *confirmed pivots only* (filtered by ATR)
2. *Volume-Weighted Validation*
- Requires unusual trading volume to confirm levels
- Filters out "phantom" levels with low participation
3. *ATR Volatility Filtering*
- Eliminates insignificant price swings in choppy markets
- Ensures only meaningful levels are plotted
4. *Liquidity Trap Detection*
- Spots institutional stop hunts where markets fake out traders
- Uses wick analysis + volume spikes for high-probability signals
---
## *📊 Parameter Encyclopedia (Expanded)*
### *1️⃣ Pivot Engine Settings*
#### *Pivot Length (50)*
- *What It Does:*
Determines how many bars to analyze when searching for swing highs/lows.
- *Professional Adjustment Guide:*
| Trading Style | Recommended Value | Why? |
|--------------|------------------|------|
| Scalping | 10-20 | Captures short-term levels |
| Day Trading | 30-50 | Balanced approach |
| Swing Trading| 50-200 | Focuses on major levels |
- *Real Market Example:*
On NASDAQ 5-minute chart:
- Length=20: Identifies levels holding for ~2 hours
- Length=50: Finds levels respected for entire trading day
#### *Test Threshold (5)*
- *Advanced Insight:*
Institutions often test levels 3-5 times before breaking them. This setting mimics the "probe and push" strategy used by smart money.
- *Psychology Behind It:*
Retail traders typically give up after 2-3 tests, while institutions keep testing until stops are run.
---
### *2️⃣ Volatility Filter System*
#### *ATR Multiplier (1.0)*
- *Professional Formula:*
Minimum Valid Swing = ATR(14) × Multiplier
- *Market-Specific Recommendations:*
| Market Type | Optimal Multiplier |
|------------------|--------------------|
| Forex Majors | 0.8-1.2 |
| Crypto (BTC/ETH) | 1.5-2.5 |
| SP500 Stocks | 1.0-1.5 |
- *Why It Matters:*
In EUR/USD (ATR=10 pips):
- Multiplier=1.0 → Requires 10 pip swings
- Multiplier=1.5 → Requires 15 pip swings (fewer but higher quality levels)
---
### *3️⃣ Volume Confirmation System*
#### *Volume Threshold (1.2)*
- *Institutional Benchmark:*
- 1.2x = Moderate institutional interest
- 1.5x+ = Strong smart money activity
- *Volume Spike Case Study:*
*Before Apple Earnings:*
- Normal volume: 2M shares
- Spike threshold (1.2): 2.4M shares
- Actual volume: 3.1M shares → STRONG confirmation
---
### *4️⃣ Liquidity Trap Detection*
#### *Wick Analysis System*
- *Two-Filter Verification:*
1. *Wick Ratio (0.6):*
- Ensures majority of candle shows rejection
- Formula: (UpperWick + LowerWick) / Total Range > 0.6
2. *Min Wick Size (1% ATR):*
- Prevents false signals in flat markets
- Example: ATR=20 pips → Min wick=0.2 pips
- *Trap Identification Flowchart:*
Price Enters Zone →
Spikes Beyond Level →
Shows Long Wick →
Volume > Threshold →
TRAP CONFIRMED
---
## *💡 Master-Level Usage Techniques*
### *Institutional Order Flow Analysis*
1. *Step 1:* Identify pivot levels with ≥3 tests
2. *Step 2:* Watch for volume contraction near levels
3. *Step 3:* Enter when trap signal appears with:
- Wick > 2×ATR
- Volume > 1.5× average
### *Multi-Timeframe Confirmation*
1. *Higher TF:* Find weekly/monthly pivots
2. *Lower TF:* Use this indicator for precise entries
3. *Example:*
- Weekly pivot at $180
- 4H shows liquidity trap → High-probability reversal
---
## *⚠ Critical Mistakes to Avoid*
1. *Using Default Settings Everywhere*
- Crude oil needs higher ATR multiplier than bonds
2. *Ignoring Trap Context*
- Traps work best at:
- All-time highs/lows
- Major psychological numbers (00/50 levels)
3. *Overlooking Cumulative Volume*
- Check if volume is building over multiple tests

Pivot Points [MisterMoTA]The Pivot Points indicator by MisterMoTA allow users to get pivots points calculated from last candle high, low and close on any timeframe from 1 minute to weekly.
This will help users that are trading ins small timeframes to see the pivots that are near their timeframes and not only daily timeframe.
Here is an example on the chart from nex image the timeframe is set to 1 minute and pivot points displayed are at 15 minutes :
The users have control on pivots colors, pivot labels colors, text color from labels, decimal numbers displayed in the labels and style of the pivots lines.
Please follow me for other script like this one.
Kind regards,
MisterMoTA

Pivot and Wick Boxes with Break Signals v2█ OVERVIEW
The "Pivot and Wick Boxes with Break Signals v2" is an advanced Pine Script® technical analysis tool that identifies pivot points (highs and lows) on the chart and draws customizable boxes based on the wicks of pivot candles. It is ideal for traders using price action strategies, helping to identify key support and resistance levels and potential breakout trading opportunities. With flexible settings, a volume filter, and label grouping, the indicator ensures clarity and precision on the chart.
█ CONCEPTS
The indicator modifies how zones are drawn, displaying boxes on the latest candle rather than extending from the zones based on pivot candle wicks. This approach prevents visual clutter on the chart, allowing simultaneous use of other indicators without sacrificing clarity.
Why are wicks important?Wicks of pivot candles indicate significant market reactions in key areas. Depending on the context, they may signal rejection, testing, or absorption of support or resistance levels. Long wicks often appear where large players are active, and the marked zones are frequently retested. The indicator enables quick identification and observation of their impact on future price movements.
█ FEATURES
Pivot Detection: Identifies pivot points (highs and lows) based on a user-defined lookback period (Pivot Length), with options to display boxes for high and low pivot candle wicks separately.
Customizable Boxes: Draws boxes based on pivot candle wicks with adjustable border colors, background gradients, border styles (solid, dashed, dotted), and border widths.
Breakout Signals: Generates buy (green upward triangle) and sell (red downward triangle) signals when the price breaks through a pivot and the candle closes on the opposite side, indicating potential trend continuation. If the price approaches a pivot zone but fails to break it, this may suggest a potential trend reversal or the end of a correction.
Volume Filter: Optional volume-based signal filter that requires breakouts to have a volume exceeding a user-defined multiplier of the average volume over a specified period. Note: the volume filter will not work on markets where volume data is unavailable.
Label Grouping: Automatically groups overlapping pivot labels to avoid chart clutter, displaying only key price levels.
█ HOW TO USE
Add to Chart: Apply the indicator to your TradingView chart via the Pine Editor or Indicators menu.
Configure Settings:
Pivot Settings: Adjust Pivot Length to change the sensitivity of pivot detection—the value represents the number of candles, which equals the delay in displaying the pivot. Larger values generate fewer pivots, but they are generally more significant. Set Max High Pivot Boxes and Max Low Pivot Boxes to control the number of displayed boxes.
Signal Settings: Enable Use Volume Filter for Signals to require higher volume for breakouts, and adjust Average Volume Multiplier and Average Volume Period. A volume multiplier of 1 means the filter allows pivots with a volume equal to or greater than the average volume over the specified period.
Box Styling: Configure border colors, background gradients, line thickness, and border styles for high and low pivot boxes.
Interpreting Signals:
Buy Signal: A green triangle below the bar indicates a breakout above a high pivot box, suggesting potential continuation of an uptrend.
Sell Signal: A red triangle above the bar indicates a breakout below a low pivot box, suggesting potential continuation of a downtrend.
Non-Breakout Zones: If the price approaches a pivot zone but fails to break it, it may indicate a potential trend reversal or the end of a correction (e.g., price rejection at a resistance level in a downtrend or a support level in an uptrend).
Overlapping Zones: If pivot zones overlap, it indicates the level has been tested multiple times, suggesting its significance in the market.
Use signals in conjunction with other technical analysis tools for confirmation.
Monitoring Levels: Use labeled pivot levels as potential support and resistance zones for trade planning.
█ APPLICATIONS
Price Action Trading: Use pivot levels as support and resistance zones. For example, in an uptrend, you can look for buying opportunities near low pivot zones (support), where price often bounces after testing the wick of a pivot candle. Combining with other indicators, such as Fibonacci levels, enhances the significance of pivot zones—if they align with Fibonacci levels and are accompanied by high volume, the zone is considered stronger.
Breakout Strategies: Trade based on breakout signals from key pivot zones. A buy signal after a breakout from a high pivot with confirmed volume may indicate continued upward movement. Using the indicator with other tools, such as moving averages or RSI, can help confirm the strength of the breakout.
Practical Approach:
The more frequently a zone is tested in a short period, the higher the risk of a breakout, as supply or demand may be exhausted.
The longer a zone holds without breaking, the more significant it becomes for the market, both psychologically and technically.
As the saying goes: “A zone is strong until it breaks—when it does, a strong move often follows.”
How to observe?
Strong bounces from a zone indicate that demand or supply remains active.
Weaker bounces or price lingering near the level may suggest the market is preparing for a breakout.
█ NOTES
Test the indicator across different timeframes and markets (stocks, forex, crypto) to optimize settings for your trading style.
The volume filter will not work on markets where volume data is unavailable. In such cases, disable the volume filter in the settings.
For best results, use on high-liquidity markets when the volume filter is enabled.

Pivot Swings w Table Pivot Swings w Table — Intraday Structure & Range Analyzer
This indicator identifies key pivot highs and lows on the chart and highlights market structure shifts using a real-time table display. It helps traders visually confirm potential trade setups by tracking unbroken swing points and measuring the range between the most recent pivots.
🔍 Features:
🔹 Automatic Pivot Detection using configurable left/right bar logic.
🔹 Unbroken Pivot Filtering — only pivots that haven't been invalidated by price are displayed.
🔹 Dynamic Range Table with:
Latest valid Pivot High and Pivot Low
Total Range Width
Upper & Lower 25% range thresholds (useful for value/imbalance analysis)
🔹 Trend-Based Color Coding — the table background changes based on which pivot (high or low) occurred more recently:
🟥 Red: Downward bias (last pivot was a lower high)
🟩 Green: Upward bias (last pivot was a higher low)
🔹 Optional extension of pivot levels to the right of the chart for support/resistance confluence.
⚙️ How to Use:
Adjust the Left Bars and Right Bars inputs to fine-tune how swings are defined.
Look for price reacting near the Upper or Lower 25% zones to anticipate mean reversion or breakout setups.
Use the trend color of the table to confirm directional bias, especially useful during consolidation or retracement periods.
💡 Best For:
Intraday or short-term swing traders
Traders who use market structure, support/resistance, or trend-based strategies
Those looking to avoid low-quality trades in tight ranges
✅ Built for overlay use on price charts
📈 Works on all symbols and timeframes
🧠 No repainting — pivots are confirmed with completed bars

Pivot Channel Breaks [BigBeluga]Pivot Channel Break
The Pivot Channel Break indicator identifies key pivot points and creates a dynamic channel based on these pivots. It detects breakouts from this channel, providing potential entry and exit signals for traders.
🔵 How to Use
Channel Identification:
- Upper and lower channel lines drawn based on pivot highs and lows
- Channel width dynamically adjusted using ATR-like calculation
Breakout Signals:
- Upward breakout: Price closes above upper channel line
- Downward breakout: Price closes below lower channel line
- Signals shown as X marks on the chart
Pivot Points:
- High pivots marked with "H" triangles
- Low pivots marked with "L" triangles
Support & Resistance:
- Optional signals when price touches but doesn't break channel lines
Trend Visualization:
- Optional bar coloring based on the most recent breakout direction
🔵 Customization
• Pivot Right: Lookback period for pivot detection (default: 10)
• Pivot Left: Forward period for pivot confirmation (default: 40)
• Channel Width: Multiplier for channel width calculation (default: 1.0)
• Support & Resistance Signals: Toggle additional touch signals
• Bar Color: Enable/disable trend-based bar coloring
Calculation:
Detect pivot highs and lows using specified lookback periods
Calculate channel basis using 10-period SMA of close prices
Determine channel width using ATR-like calculation: RMA(high - low, 10) * width multiplier
Set channel lines based on pivot points and calculated deviations
Identify breakouts when price crosses beyond channel lines
The Pivot Channel Break indicator offers a dynamic approach to identifying potential trend changes and breakout opportunities. It combines pivot point analysis with a flexible channel calculation, providing traders with a visual tool for market structure analysis. Use this indicator in conjunction with other technical analysis methods to confirm signals and manage risk effectively.

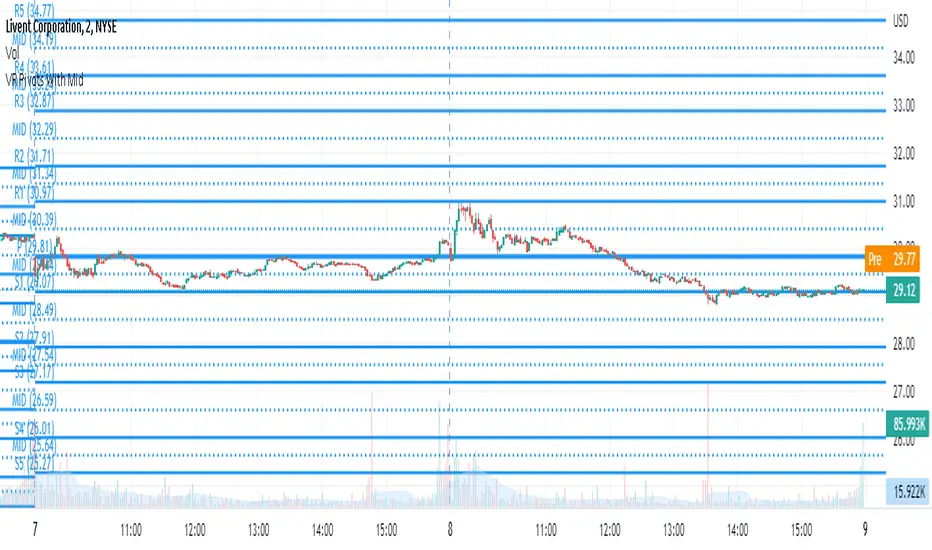
TL - VR Pivot PointsPivot Points with mid levels used in the VR Piv Strat.
Pivots are calculated using the following formula:
R3: R1 + (High-Low)
R2: Pivot + (High-Low)
R1: 2 * Pivot - Low
Pivot: (High + Low + Close)/3
S1: 2 * Pivot - High
S2: Pivot - (High - Low)
S3: S1 - (High - Low)
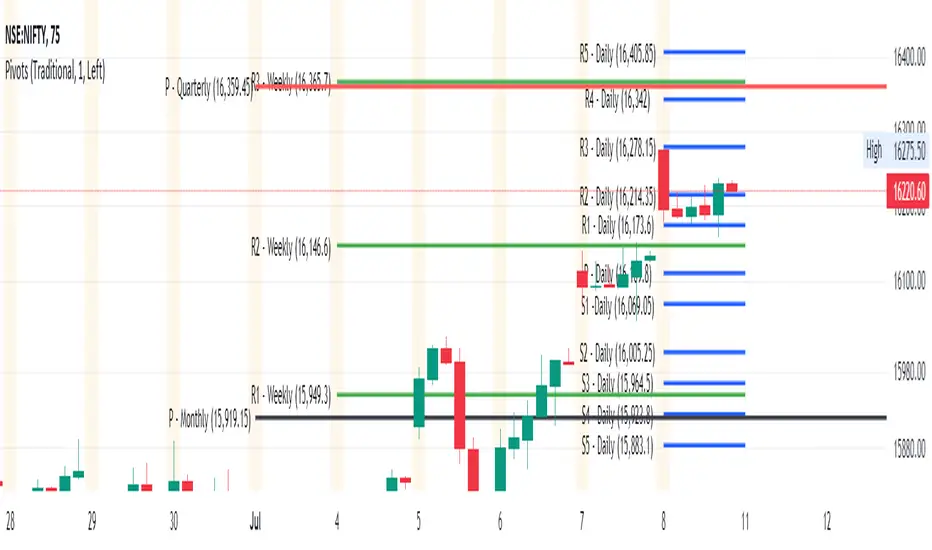
Pivot Points Daily and WeeklyThis will let trader see Daily and Weekly Pivot points with R/S5.
Daily Pivot point line --> Orange Color
Daily R1-5 ---> Black circles
Daily S1-5 ---> Black circles
Weekly Pivot lines ---> Purple Color
Weekly R1-5 ---> Red Circles
Weekly S1-5 ---> Red Circles

Pivot Point Reversal + RSI AlertsThese are alerts for previously published strategy:
This strategy joins the Pivot Reversal strategy with the RSI indicator.
We check RSI level at the pivot point level and only if RSI condition is satisfied we update levels for stop orders.

Pivot-Based Trend Labels [BETA]Automatically labels Higher Highs, Lower Highs, Higher Lows and Lower Lows using pivots, with optional zigzag lines and resistance proximity alerts. BETA version for testing and feedback.
## Overview
**Pivot-Based Trend Labels v2.0 ** is a structure-focused tool that automatically detects pivot highs and lows, then labels them as:
- **HH** – Higher High
- **LH** – Lower High
- **LL** – Lower Low
- **HL** – Higher Low
It’s designed to make trend structure (higher highs / higher lows vs lower highs / lower lows) easy to read at a glance. You can optionally draw connecting “zigzag” lines between pivots and enable a resistance proximity alert.
---
## Key Features
- **Pivot-based structure labels**
- Detects pivot highs/lows using a configurable lookback period
- Labels each new pivot as HH / LH / LL / HL
- Optional filter for minimum price change to ignore noise
- **Clean visual controls**
- Show/hide all labels with a single toggle
- Choose between HH/LH/LL/HL text or actual **price values**
- Individual toggles & customizable colors for each structure label
- Label size & background transparency controls
- **Optional ZigZag lines**
- Connects successive pivots to visualize swing structure
- Customizable color, transparency, width, and style
- **Resistance proximity alert** (optional)
- Dynamic resistance using highest high of last `length * 2` bars
- Or choose a **Manual Resistance** price
- Visual ⚠ label on the chart when price gets within threshold
- Cooldown to avoid duplicate alerts
- **Date range filter** (optional)
- Show labels/lines only within selected time window
- Optional end date or live continuation
---
## Inputs (Quick Guide)
**Pivot Settings**
- Pivot Lookback Period — Pivot confirmation threshold
- Min Bars Between Labels — Prevents label overcrowding
- Min Price Change (Absolute) — Filters noise
**Visuals: Labels**
- Global “Show Labels”
- Toggle/Color HH / LH / LL / HL
- Price or Structure text display
- Adjustable size & transparency
**Visuals: Lines**
- Toggle pivot-connecting lines
- Width, color, transparency, style options
**Resistance Alerts**
- Enable/disable resistance proximity detection
- Manual or dynamic resistance logic
- Percent threshold + visual label options
- Cooldown in bars
**Date Range Filter**
- Restrict script drawings to a specific window
---
## How to Use
1. Start with default settings to view baseline structure.
2. Increase **Pivot Lookback Period** for smoother swings on higher TFs.
3. Adjust **Min Price Change** to filter small movements in volatile markets.
4. Enable **zigzag lines** for clearer visual swing structure.
5. Turn on **resistance alerts** if you want proactive warnings.
6. Use the **date filter** for clearer backtesting or focused study.
---
## Alerts
Alerts trigger automatically when:
- A **new HH, LH, LL, or HL** is confirmed
- Price **approaches your resistance level**
Configure alerts using TradingView’s “Create Alert” on this script.
---
## Notes & Limitations
- **BETA version**: features & settings may change in future updates.
- Labels appear **after confirmation** — pivots require lookback bars.
- Performance & appropriateness depend on market/timeframe — experiment!
---
## Disclaimer
This script is for **educational and informational purposes only** and does not constitute financial advice. Past performance does not guarantee future results. You are responsible for all investment decisions made while using this tool.
---
## License / Terms of Use
© 2025 YourName. All rights reserved.
Personal-use only. Redistribution, resale, or inclusion in paid products/services is prohibited without explicit written permission from the author.

Pivot Clouds [SS]Hey everyone,
Whopper indicator here that I have been working on for some time, excited to finally release it! So let's get into it!
☁️☁️ What are Pivot Clouds?! ☁️☁️
The concept for pivot clouds came from trailing and erroring different iterations of support and resistance (which ultimately led to the creation of the BIN Based Support and Resistance indicator).
In the design and creation of my BIN support and resistance indicator, I initially tried to do something similar with pivot points. However, I found pivots to be relatively ineffective as support and resistance, especially in very trendy markets, and the BIN approach reigned supreme. However, not wanting to abandon the utility of pivots, I tried something different, creating a pivot based SMA.
This proved most useful and very helpful for determining directions, rejections and trends! From there, came this indicator, the Pivot Clouds. This is currently iteration 32 haha, which will be the final iteration for the time being and most functional.
The pivot cloud indicator works by smoothing pivot highs and pivot lows over the course of your inputted length. My general suggestion is to keep it between 150 to 250. Going to low will make it incredibly choppy. Using 200 seems to be the sweet spot for most tickers.
Over the course of the pivot lookback, it collects all pivot highs and pivot lows, then averages them out to create 2 separate SMAs, those being an SMA for the pivot high and an SMA for the pivot low. Together, these create the cloud you see in the main chart.
In addition to creating this cloud, the indicator marks and tracks pivot maxes to both the upside and downside and will draw cloud support on a fall below the main cloud and cloud resistance on a rise above the main cloud, as exampled here:
Above:
And Below:
These clouds represent the average of the pivot high/pivot low and extend to the max or min (high or low depending on position on the main cloud).
💡 Alternative Abilities 💡
Resulting from the sometimes inadequacy of pivots to determine targets and resistance/support, the indicator is capable of pulling in ATR target prices. This allows the user to either use both, pivot max/min clouds AND ATR targets, or simply one or the other.
The ATR targets can be customized in the indicator settings, with a default of daily timeframe targets on a 14 ATR lookback.
Here are some examples of how the ATR targets look:
And to the upside:
📈 Standalone Strategy 📈
This indicator can be used as a standalone strategy, or to complement other strategies. I will go over both briefly, starting with standalone strategy:
Select your target preference (ATR, Pivot Maxes and Mins or both)
Long on a break and hold over the main cloud to the targets; or
Shrot on a break below the main cloud to the targets.
That simple!
🎯Supplemental to existing Strategy 🎯
This indicator for me is gold for my strategy, which involves longing or shorting to calculated target prices.
You essentially follow the above, only your targets are determined by your strategy. So for me, I look for a rejection or hold of the cloud, to long or short to my targets:
💰Customizing the Indicator 💰
Let's quickly go over these options:
Smooth length: Creates a smooth cloud. Suggested limits are 150 - 250
Lookback Length: This determines the length of lookback for the indicator to store historical pivot information and create the clouds.
Pivot Lookforward/backward: Allows the user to select custom pivot timeframes. The traditional rule is 10, but 5 sometimes is preferred on larger timeframes.
Show Pivot Max and Min: These enables the pivot max and min cloud for a crossover or crossunder of the main cloud.
ATR timeframe: determines the ATR target price levels to look for. You can toggle weekly, daily, hourly, whichever you prefer.
ATR Length: Allows you to customize the lookback for determining the ATR targets.
USE ATR targets: This will turn on / off the ATR targets, if you wish to use/not use these reference points with the indicator, same as with the pivot max and min cloud toggle.
And that's the indicator, folks!
Hope you like it,
Take care and safe trades!🚀

Pivots and SwingsThis indicator displays simple pivots of varying degrees and connects them into swings whilst displaying the information of each swing.
First order pivot highs are confirmed when the N number of bars each side of the bar in question have a lower high whilst a first order pivot low is confirmed when the N number of bars on each side of the bar in question have a higher low. In this script N is set to 2 as a default, so when the middle bar of a set of 5 bars has the highest high, then it is considered a first order pivot high and vice versa for lows.
Second order pivot highs are confirmed when a first order pivot is higher than the first order pivot points on either side of the pivot point in question. Second order pivot lows are confirmed when a first order pivot low is lower than the first order pivot lows either side of the pivot in question.
Third order pivots follow the same logic but consider the highest and lowest second order pivots
A quick note on how the bars are coloured basis trends. If price breaks through the last first order pivot high, the bars will be coloured in a (default) green sequence and will stay green until price moves back below the most recent first order pivot low, at which time it will revert to a (default) red sequence.
The information about the duration and magnitude of the swings are displayed in an effort to identify when a swing leg of an overall trend may be shortening which signifies a weakening trend, or lengthening to signify a trend that is gaining in strength.
I hope you find this indicator useful!

Pivot Support & ResistanceHere signals are based on the pivot high and pivot lows. Factors taken into account in understanding the breakout or breakdown are:
volume
candle bar is not opening candle
must be near pivot high or low
Recommendation:
Use once candle closes else you might get trapped in certain cases so be careful

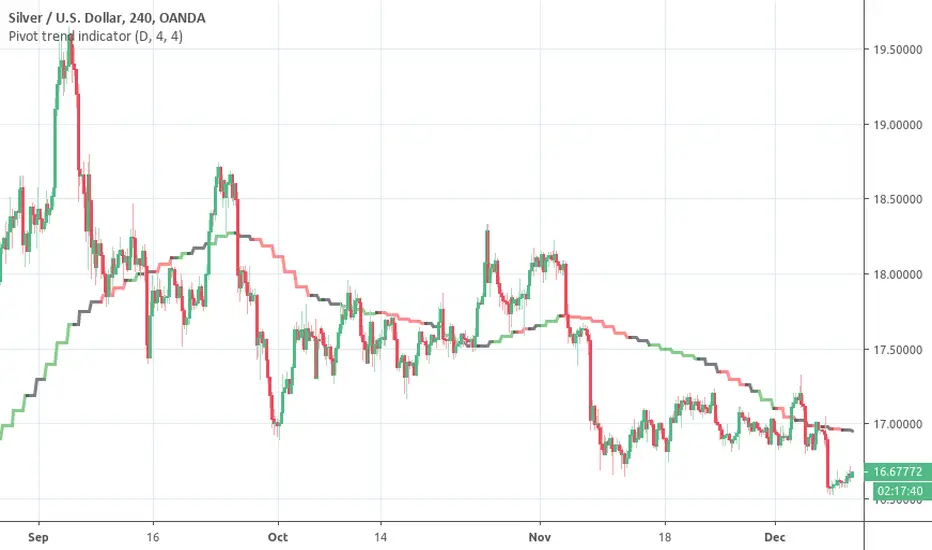
Pivot trend indicatorThis is a LAGGING indicator which can provide a good indication of trend. It require a certain (configurable) number of candles to have closed before it can determine whether a pivot has formed.
It provides a 20 period SMA for the timeframe of your choice which is color coded to show the trend according to confirmed pivots.
Anticipated usage:
Long / Short bias is determined by pivot trend
Trader seeks entries according to their strategy
Black consolidation areas may trigger a re-evaluation of the trade and can serve as good profit taking areas
The SMA colors:
Green -> Higher highs & Higher lows
Red -> Lower highs & Lowers lows
Black -> No clear trend from the pivots
Why the 20 SMA?
Feel free to adjust it for your purposes. I personally find that using a higher time frame 20 SMA is a better indication of trend than longer period MAs on shorter time frames. This can be seen from comparing the 20 daily SMA and 200 hourly SMA.
Pivot adjustment
The pivots use the selected time frame (not) the MA trend time frame. You can specify the left and right candles required to confirm a pivot
Pivot Points HIgh LowRemake of the integrated Pivot Points indicator
With higher resolution you should lower the indicator values to get a good result

Pivot mtf semaphore support&resistance [LM]Hello Traders,
I would like to introduce you pivot semaphore mtf support&resistance levels. The idea is the same as my other S/R scripts to have a look at the important levels. The Semaphore is used to spot future multi-level Supports and Resistance zones. It is also useful to spot HL or LL or HH or LH zones. The script is based on amazing work of @LucF so really big thanks for your work on mtf line offsetting.
It has three settings:
First two settings are for higher timeframes
Third setting is setting for pivots on current timeframe
!!!! Very important is there is limitation in pinescript how many candles you can look back(4999) if you choose timeframes that are very distant from each other there is a chance that those lines won't show up
Hopefully you will enjoy
Cheers, Lukas

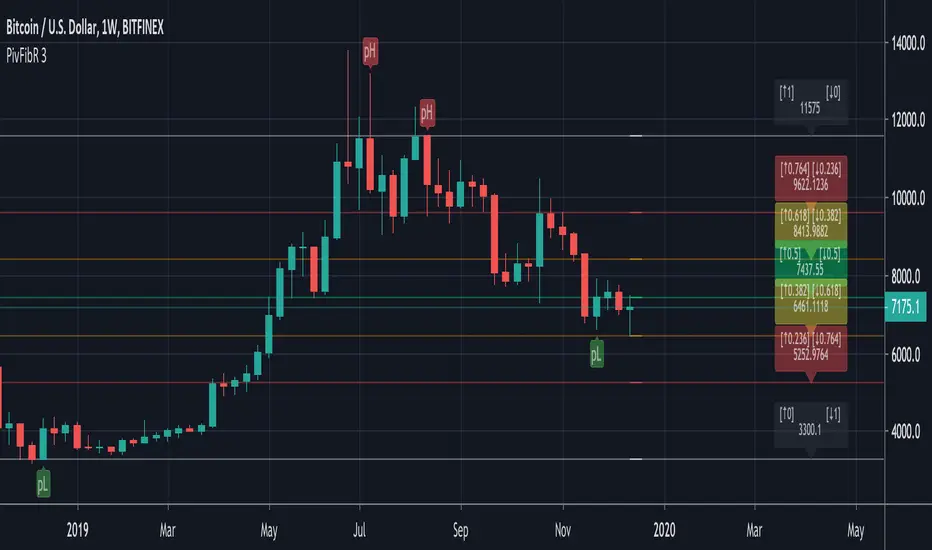
Pivots Fibonacci RetracementThis is a Fibonacci Retracement indicator based on Pivots.
The Fibonacci lines are always drawn between the LAST High Pivot (Red Triangle Down) and the LAST Low Pivot (Green Triangle Up)
Every time a new High or Low Pivot is found, the Fibonacci lines changes.
"RightBars" & "LeftBars" from Pivots are kept the same > "Bars"
In this example (BTCUSDT) the "Bars" are set as 10 (= period "Left" & "Right" where "Highs" & "Lows" are found):
This is the bigger picture:
If the settings are changed, for example "Bars" > 30, the Fibonacci lines are placed on different points:
If we need to take the previous "Low" Pivot ("Bars" > 45):
You see you need to change the "Bars" a bit to get what you want.
The extended Fibonacci levels (1.618 & 2) and (-0.618 & -1) are also included,
these can be used for future "Target-lines":
IF there is a NEW Pivot ("High" or "Low") which is visible because the Fibonacci lines HAVEN'T passed the "Red Triangle Down" or "Green Triangle Up" YET,
please WAIT until the close of that period, otherwise the "Triangle" possibly could still disappear again.
The dashed coloured lines and coloured Fibonacci numbers at the right are for easier readings and interpretation.
Pivot TraderFirst version of a pivot point indicator. I created this so that it would be possible to add alerts to touches on pivots and to add intraday pivots.
The script also plots the previous period's candle body color (up or down), within the previous period's open and close.
This first version only includes Camarilla type pivots.

Pivots High Low Live DetectionPivots High Low Live Detection
Identifies and visualizes swing highs and lows on the chart in real time.
Helps to observe evolving market structure by connecting confirmed or developing pivot points with lines and labels.
Using a configurable lookback, minimum deviation, and confirmation bar system, the indicator highlights new Higher Highs (HH), Higher Lows (HL), Lower Highs (LH), and Lower Lows (LL) as they form.
When “Live (repainting)” mode is enabled, the current swing leg updates dynamically with each candle, giving immediate feedback as price develops.
When disabled, only confirmed pivots are plotted, ideal for historical validation and backtesting.
+ Key Features
Detects and labels major swing points (HH, HL, LH, LL).
Works in live or confirmed (non-repainting) mode.
Adjustable parameters for lookback, deviation (in ticks), and confirmation bars.
Lightweight and compatible with any timeframe or symbol.
Includes runtime alerts for new structural pivots and direction shifts.
+ How to Use
Adjust the inputs under the “Pivots” group to control sensitivity.
Enable “Live (repainting)” to see developing swing legs, or disable it for confirmed structure only.
Use alerts to track structural changes or potential trend reversals.

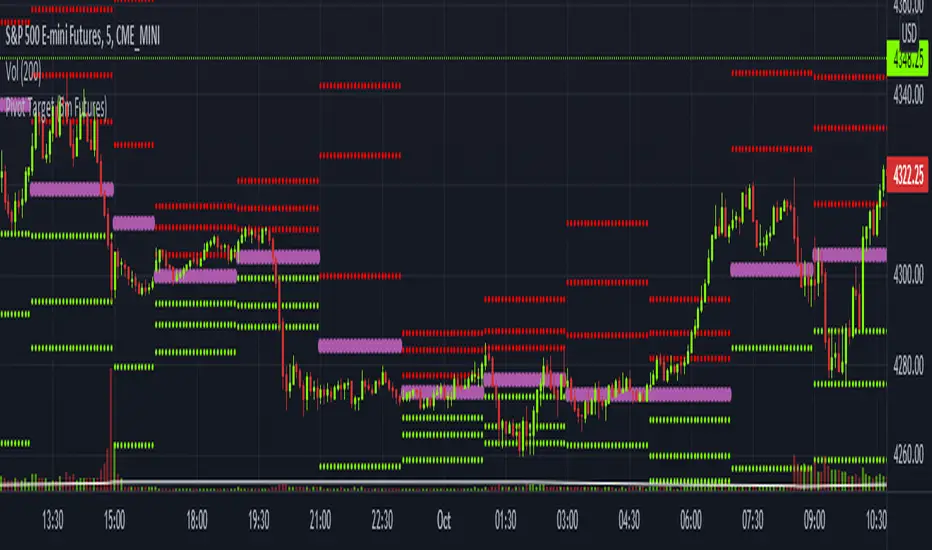
Pivot Target (5m Futures)I am new to both Futures Trading and Pivots. Looking for shorter-term profitable opportunities, I have investigated the use of pivots from a higher timeframe. All the work of this script is performed using two lines. It calculates the pivot from the previous 2-hour bar and draws this pivot line on the 5-minute timeframe. Many many times, the price will reach back to this pivot point - sometimes fairly quickly within the same horizontal pivot line and sometimes farther out (4-hours to 6-hours, or within the next few days). Price tends to reach the level around ninety percent of the time, making for plenty of short-term trading opportunities.
I get the best results when I see the price rise or fall from the pivot, along with a second indicator indicating a possible reversal (my favorite is Divergence for Many Indicators v4 by LonesomeTheBlue . Who knew divergence (both regular and hidden) was so common and useful for finding probable reversals? If I find the price above or below the pivot line with a second signal, I'll place a buy or sell within that same 2-hour window the price tends to return back to the higher timeframe pivot for a nice profit very quickly. Other times it does take a little longer to return with only a small percentage of time not returning within a reasonable amount of time, or very unusually, not at all. The image above shows a number of profitable trading opportunities using a combination of the Pivot Target and LonesomeTheBlue's Divergence for Many Indicators v4. You can further limit risk by only taking trades that are in the same direction of the overall trend, possibly confirmed on a higher timeframe.
This script will only be visible on the 5-minute timeframe the way it is written right now. I wouldn't suggest shorter or longer timeframes unless some editing is done by you. It doesn't seem to work as well with stocks, but is best on Futures due to the wave-like natures of the futures market. Trade safe, trade with the trend, use stops and limits appropriately and stay safe.
Pivot & GapPIVOT and GAP – Indicator
PIVOT and GAP is an advanced structural price-action tool designed to detect hidden imbalances in the market by analyzing gap and pivot formations between candles.
It identifies areas where institutional activity may have left a price void, signaling potential Demand or Supply Zones. When these imbalances align with lower-timeframe zones, the probability of a powerful price reaction increases.
This indicator is built for traders who want to combine gap analysis, price-action structure, with multi-timeframe confluence to make smarter trading decisions.
How Does It Work?
The indicator automatically scans candles for two types of imbalances:
1. Demand-Side Imbalances
PIVOT (Demand Pivot Creation)
A Demand Pivot forms when:
a bearish candle is followed by a bullish candle, and
There is a gap/price difference between the bearish candle’s close and the
bullish candle’s open. A blue color box is created
This signals buyers stepping in aggressively after sellers weaken.
GAP (Demand Gap Creation)
A Demand Gap forms when:
two consecutive bullish candles appear, and there is a positive difference between
the first candle’s close and the next candle’s open.
A blue color box is created
This implies strong upward momentum with institutional buying pressure.
2. Supply-Side Imbalances
PIVOT (Supply Pivot Creation)
A Supply Pivot forms when:
A bullish candle is followed by a bearish candle, and
There is a gap/price difference between the bullish candle’s close and the
bearish candle’s open. A red color box is created
This signals sellers stepping in aggressively after buyers exhaust.
GAP (Supply Gap Creation)
A Supply Gap forms when:
Two consecutive bearish candles appear, and There is a negative difference between
the first candle’s close and the next candle’s open.
A red color box is created
This reflects strong downward momentum with institutional selling pressure.
Higher Timeframe Confirmation:
The indicator performs gap and pivot analysis on higher timeframes, and
If combine with Demand Zone or Supply Zone on the lower timeframe which forms on the same candle.
That zone becomes a High-Probability Zone.
Such zones are considered more powerful because they combine:
• Higher timeframe institutional imbalance
• Strong confluence for reversal or continuation
• Demand and Supply zone creation at Lower Time Frame
How Traders Benefit from It?
High-Probability Zones combining HTF imbalance + LTF zone gives traders clearer areas with higher success probability.
Early Detection of Institutional Moves
Gaps and pivots typically occur where big players enter or exit positions.
Reduces Chart Noise
Instead of guessing where a zone matters, the indicator highlights only those backed by real price imbalances.
What Makes This Indicator Unique?
1. Candle-by-Candle Imbalance Detection
Instead of simple gap detection, this indicator reads the difference in open-close levels with high precision.
2. HTF–LTF Confluence Logic
When the same candle shows imbalance on HTF and a Demand & Supply zone on LTF, the zone is tagged as powerful — a unique decision layer not commonly seen in other scripts.
3. Designed From Your Custom Rules
This structure is built from your personal interpretation of how pivots and gaps create pressure zones — not copied from other scripts.
How This Indicator Is Original ?
The entire logic is created from my own rules of identifying pivots and
gaps, not from any open-source or public code.
The unique combination of:
Gap detection
Pivot shift logic
Direction-specific candle sequence
Multi-timeframe zone alignment
No repurposed or copied logic from existing demand-supply indicators.
The design reflects our personal trading experience, analysis style, and
custom definitions of imbalance.
Disclaimer:
This indicator is created for educational purposes.
It does not provide buy or sell signals, and it should not be considered financial advice.
Trading involves risk, and users should perform their own analysis before taking any positions.

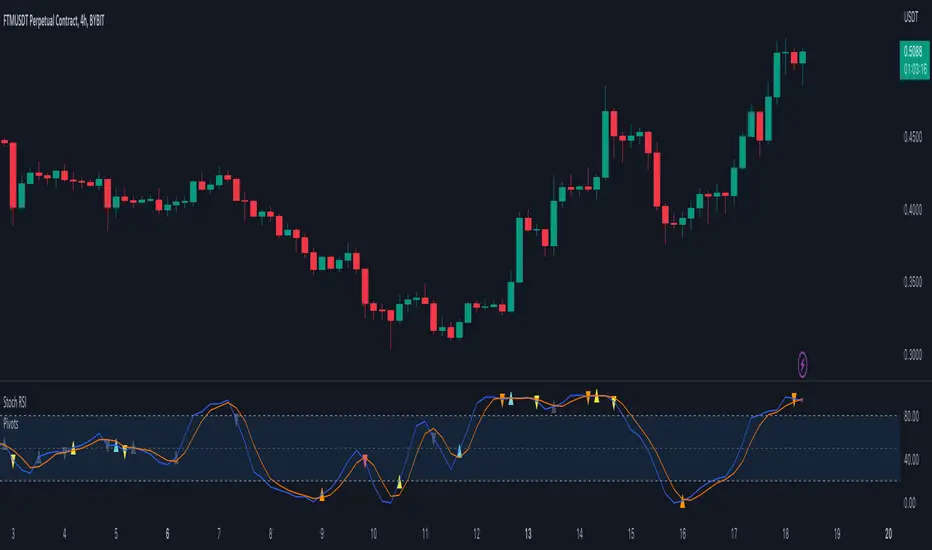
Pivots For IndicatorsThis is an overlay indicator that finds and identifies pivots. It is very sensitive so works best on smoother oscillators such as Stoch RSI. Make sure you set the source to your indicator after you overlay it. You will need to adjust the rev high and low inputs in the settings. For example Stoch RSI would have a revhigh = 80 and revlow = 20. This script is not designed to work on the chart.
Yellow = First Higher low or First Lower High
Orange = Reversal (Indicator low and high levels can be adjusted in settings.
Teal = Higher Low
Red = Lower High
Gray = Higher high or Lower Low
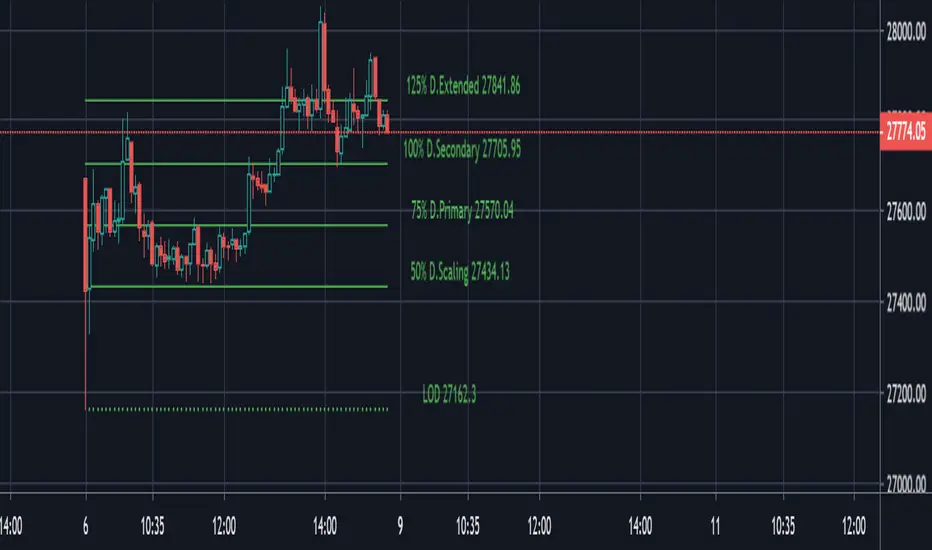
PivotBoss ADR Price TargetsThis script forcasts daily, weekly, Monthly targets well in advance so that you can position yourself accordingly. Script has four target levels such as 50% target level, 75% target level, 100% target level and 125% target level. You can scale out your position across these levels. Price has 80% potential to reach 1st target level, 70% potential to reach 2nd second target level and 50% potential to reach 3rd and 4th target level.
The script takes 10 period average daily range and high of the period to project the downside targets, 10 period ADR and low of the peiod to project upsdie target levels.
When the price is trades in the narrow range in the prior period then the potehtial to reach 125% target level increase by 90%.
This script is purely price based use it with other pivotBoss pivots and volume profile for confirmation of your bias