ICT Killzones + Pivots [TFO]Designed with the help of TTrades and with inspiration from the ICT Everything indicator by coldbrewrosh, the purpose of this script is to identify ICT Killzones while also storing their highs and lows for future reference, until traded through.
There are 5 Killzones / sessions whose times and labels can all be changed to one's liking. Some prefer slight alterations to traditional ICT Killzones, or use different time windows altogether. Either way, the sessions are fully customizable. The sessions will auto fit to keep track of the highs and lows made during their respective times, and these pivots will be extended until they are invalidated.
There are also 4 optional Open Price lines and 4 vertical Timestamps, where the user can change the time and style of each one as well.
To help maintain a clean chart, we can implement a Cutoff Time where all drawings will stop extending past a certain point. The indicator will apply this logic by default, as it can get messy with multiple drawings starting and stopping throughout the day at different times.
Given the amount of interest I've received about this indicator, I intend to leave it open to suggestions for further improvements. Let me know what you think & what you want to see added!
ค้นหาในสคริปต์สำหรับ "pivot"

Saty Pivot RibbonA 3 EMA Ribbon + Conviction EMAs system that simplifies measuring and using EMAs for trend and support/resistance . If you are familiar with using a faster EMA (8 or 9) with a pivot EMA (21) you should feel right at home.
Features include:
- 3 EMA Trend Ribbon (8, 21, 34 default)
- 2 color system for showing bullish trend (green + blue)
- 2 color system for showing bearish trend (red + orange )
- Ribbon folding visual indicates EMA crossover
- Conviction Arrows based on 13/48 EMA crossover
- 13/48 Conviction EMAs
- Time Warp: Warp the Ribbon into a different timeframe than the chart.
Inspired by Ripster EMA Clouds.

Fsystem Pivot 1453 ScreenerHello,
This script provides scanning for our pivot 1453 script and should be used together.
I will try to explain the content with pictures.
Merhaba,
bu scriptimiz ,pivot 1453 scriptimiz için tarama yapılmasını sağlar ve beraber kullanılmalıdır.
sizlere içeriği resimler ile anlatmaya çalışacam.
Status column :
this column indicates that you are
from the Bear or Bull area at the last bar,
bear-positive bear appeared in the field,
bull -negative indicates that the bull is out of the field.
----------------
Durum Kolonu :
Bu kolon son barda Ayı veya Boğa alanda oldugunu ifade eder,
bear-positive ayı alandan çıktıgını,
bull -negative boğa alandan çıktığını ifade eder.
how bar ago column :
Indicates how many bars ago
the bull or bear crossed the area.
---------------------------------------
how bar ago kolonu :
boğa veya ayı alana kaç bar önce geçtiğini belirtir.
Level 1 distance column:
your last price
It is the percentage distance from the first pivot line that occurs when the Bull or Bear enters the field.
It gives information about how much the price has gained according to the 1st pivot and adds the color expression according to the current area.
-------------------------------------------
Level 1 distance kolonu :
son fiyatın
Boğa veya Ayı alana girdiğinde olusan ilk pivot çizgisine yüzdelik olarak uzaklığıdır.
1.pivota göre fiyat nekadar değer kazanmış bilgisini verir ve şu andaki alana göre renk ifadesinide katar.
which level column :
It gives information about the level of the price and colors it according to the relevant level.
----------------------------------------
which level kolonu :
fiyatın hangi seviyede oldugunun bilgisini verir ve ilgili seviyesine göre renklendirir.
Bottom distance column:
It gives the percentage distance
of the last price from the Support line.
-------------------------------------------------
Bottom distance kolonu :
Son fiyatın Destek çizgisine
yüzdelik uzaklığı bilgisini verir.
top distance column:
It gives the distance of the last price
from the peak, that is, to the resistance
point, as a percentage.
-------------------------------
top distance kolonu :
son fiyatın tepe yani direnç noktasına
uzaklığını yüzdelik olarak verir.
level up jump column :
If the price has closed on the line upwards
at the last bar and has passed to the
other level region, it gives information
about this.
-------------------------------------------
Level up jump kolonu :
eğer fiyat son barda yukarı doğru ,
çizgi üzerinde kapanış yapmış ve
diğer seviye bolgesine geçmiş ise
bunun bilgisini verir.
ema 60 and ema 360 column:
Returns the value of ema.
If the price is lower than the
relevant ema, it is turned
to a green ground if it is above red.
-----------------------------------
ema 60 ve ema 360 kolonu :
ema nın değerini verir.
eğer fiyat ilgili ema dan aşağı
ise kırmızı üstü ise yeşil zemine çevirilir.
Level Supp--Resis column:
gives the value of the top
resistance and the value of
the bottom support.
---------------------------
Level Supp--Resis kolonu :
tepe direncin değerini ve
dip desteğin değerini verir.
From the settings option of the script, you can narrow the result area by converting currency,
choosing a period, selecting a share, scanning another stock set and filtering integrated into the columns.
---------------------------------------------------------------------------------------------------------------------------------
scriptin ayarlar seçeneğinden ,para birimi çevirme ,periyot seçme,hisse seçme ,başka hisse seti tarama ve kolonlara entegreli filtreleme yaparak sonuç alanını daraltabilirsiniz.

Eazi Money Pro+ Pivot [ 4Reel ]This Indicator is designed to catch the daily low / high pivot point!
If you're looking to maximize your pip count, then this is the tool you need to catch that ULTIMATE ENTRY.
[GarufiCommunity] Multi Indicator: VWAPs, MA, Pivot PointsThis script provides a collection of indicators to help traders look at multiple trends while maintaining a consistent configuration, even when jumping around different timeframes and symbols.
Additionally, this collection is particularly useful when trading decisions involve looking at dozens of indicators and analyzing, in aggregate, their confluence.
With this collection of indicators you can configure anchored VWAPs, MA, and Pivot Points:
- Anchored VWAPs: For each you define a fixed time and date to anchor it in the graph, and it stays consistent even when you change the symbol. An example use case can be setting one of the VWAPs to always start on the first candle on January 1st 2021, and a second VWAP a decade prior, so you don’t need to keep manually adjusting/adding VWAPs to the graph. At the moment you can define up to 4 anchored VWAPs.
- MA and Pivot Points: For each you can set independent timeframes, periods, and types, while using a single configuration panel. This helps reduce the amount of clicking needed when trying different configurations, such as testing different MA and Pivot periods and comparing how each behave in the graph (this personally helps me build trust in indicators). Permits use of up to 3 MAs and 2 Pivot Points.
Lastly, this script leverages and reuses modified code from the sources below:
- Médias e Tempos-v.2.1 by VeraLucia (with permission);
- Multiple Anchored VWAP v1.0 by GuilhermeNogueira (with permission);
- Pivot Point by TradingView.

Trends & Pivots [SignalCave]Trends & Pivots Indicator helps you to identify primary and secondary trends and potential support/resistance zones.
Trend detection have three modes which are “Aggressive, Moderate and Conservative” . You can customize the mode on settings screen.
Alerts are available for various conditions such as "Uptrend Shift, Downtrend Shift, Primary Uptrend Begin, Primary Downtrend Begin, Secondary Uptrend Begin, Secondary Downtrend Begin"
Type asset name on symbol search area.
Adjust your timeframe that you wish to track.
Click "Create Alert"
Select one of the condition that you wish to get inform from create alert panel.
Select "Once Per Bar Close" option.
Click "Create" .

VCP pivot buyIt will buy the breakout of the pivot in a bullish trend which is defined by the Mark Minervini stage 2 template
Set the stop loss% and Target% in your favor ( recommend the stoploss% as the low percentile atrp )
It helps indicate the contraction point so that we can have a low-risk entry of a buy point.
It followed the strategy of Mark Minervini.
changing the lookback period input to change the percentile
changing the Pivot Length to decide how many bars you would consider as a pivot
changing the Close range to decide in how much percentage does the close range you would consider as a pivot
The percentile rank is represented in the colour of the background, you can alter how low you want to set to indicate lowering volatility.
The blue line shows the percentage range in ( pivot length) days/bars
The coloured background shows the signal of pivot point forming


[JRL] Pivot Regression OscillatorIntroducing the Pivot Regression Oscillator. This oscillator uses a similar formula to the Stochastic Oscillator. However, instead of comparing the closing price to the lowest price of a period, it compares the distance between current price and the current pivot point. By basing our oscillator on pivot levels, we incorporate a much more relevant and consequential price point around which to base our comparisons.
The indicator can give reliable overbought and oversold signals, and it plots two exponential moving averages as output, which provides crossover signals that can be used to help time trades.
The Pivot Regression Oscillator can be effective for timing re-entries into a trend and seems to be able to avoid some of the false signals of other indicators.
Let me know if you find this useful. Cheers!

BuyHighSellLow - Pivot pointsAnother version of buy-high sell-low strategy. This time using pivot points.
Strategy is simple:
Buy when price closes above R1 of pivot point level
Sell when price closes below S2 of pivot point level.
Use Resolution parameter to define pivot points. Higher the resolution, longer the trade time will be. If resolution is set to same as symbol, strategy will consider Higher Timeframe Multiplier to derive pivot point resolution.
Uncheck HideBands to see bands created from pivot points.
Another Buy-High Sell-Low strategy published is using donchian channel (Link below)


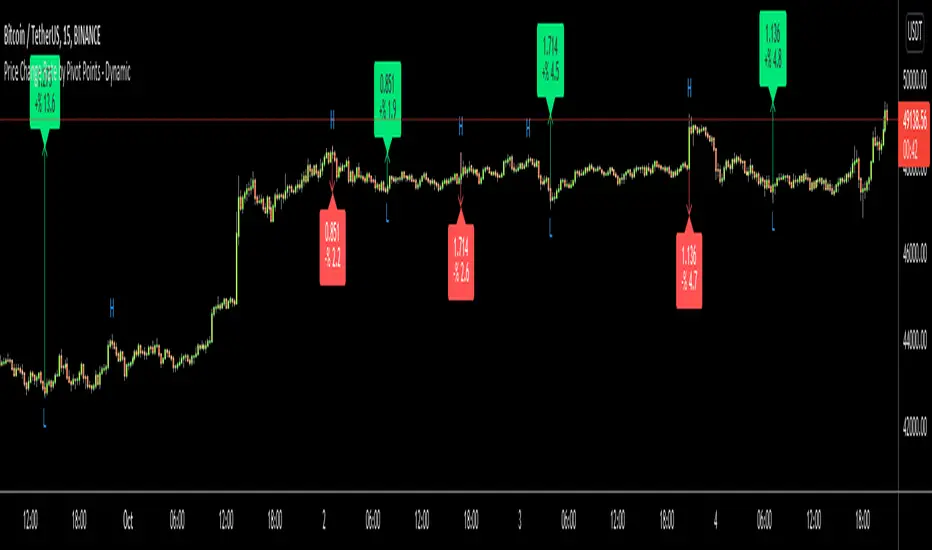
Price Change Rate by Pivot Points - DynamicHi Everyone
Usually I need Price Change info and I believe most of you need this info too. I want to see how it increased/decreased. I automate this by using Pivot Points.
it works dynamically and it uses Pivot Highs and Pivot Lows accordingly. That means it calculates which one to use.
Please watch following video:
Enjoy!
Smart Indicator 28 - Swing Pivots (Higher Highs and Lower Lows)A simple way to find Higher Highs and Lower Lows (HH and LL) whit automatic Fibonacci Lines in the most common levels.
In this indicator the Higher Highs only happens when a high value are rising from each other in the last "Length of Real Pivots" highs and the next same number of highs are falling in every single bar.
The Lower Lows are inverted, LL only appears if a low is falling in every single bar in the last number of length and the lows price of the "n" bars next are rising.
You can use this Indicator in any kind of market.

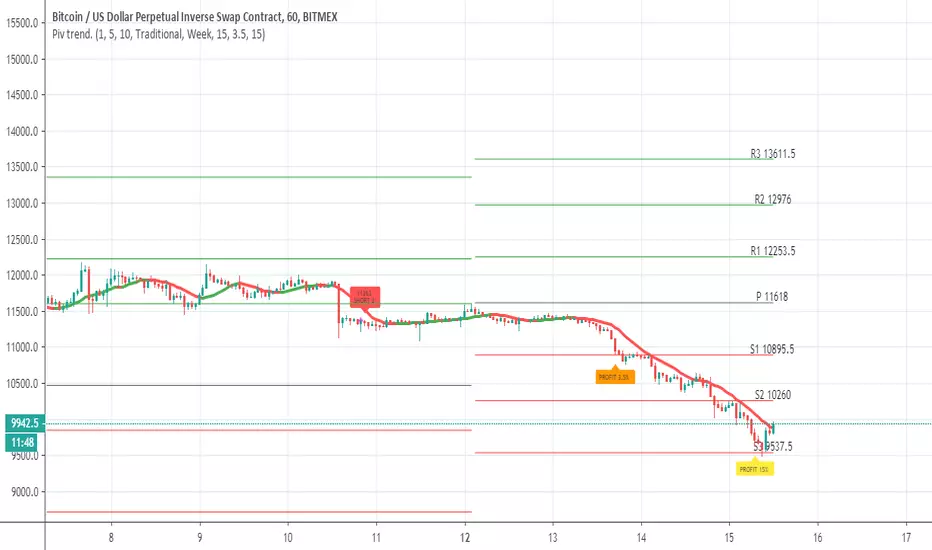
Pivot trend pivots taken from
the system is based on cross up or down of the trend line of weekly pivot point
exit is by % 3.5 and 15% (you can change it to your liking
rebuy at 15% loss
this is sill crude system so user need to refine setting to make it work best for him
ATR based Pivots mcbwHey everyone this is an exciting new script I have prepared for you.
I was reading an old forex bulletin article some time ago when I came across this: solar.murty.net (or you can download the full bulletin with lots of other good articles here: www.forexfactory.com).
You can already buy this for metatrader (www.mql5.com) so I figured to make it for free for tradingview.
This bulletin suggested that you can reasonably predict daily volatility by adding or subtracting multiples of the daily ATR to the daily opening. Using this you can choose multiples to use as price targets and alternatively as stop losses. For example, if you already have a sense of market direction you can buy at market open place a stop loss at - 1 daily ATR and a profit target at + 3 ATRs for a risk to reward ratio of 3. If you are looking for smaller/quicker moves with a ratio of 3 you can have a stop loss at -0.25 ATR and a take profit at +0.75 ATR.
Alternatively this article also suggests to use this method to catch volatility breakouts. If price is higher than the + 1 ATR area then you can safely assume it will be going to the +2 ATR area so you can put a buy stop at + 1 ATR with a profit target at + 2 ATR with a stop loss at +0.5 ATR to catch a volatility breakout with a risk to reward ratio of 2!
Even further there are methods that you can use with ATRs of multiple window sizes, for example by opening two copies of this indicator and measuring recent volatility with a 1 week window and long term volatility within a 1 month window. If the short term volatility is crossing the long term volatility then there is a high probability chance that even more price movement will occur.
However I have found that this method is good for more than daily volatility , it can also be used to measure weekly volatility , and monthly volatility and use these multiples as good long term price targets.
To select if you want daily, weekly, or monthly values of the ATR of volatility you're using go to the settings and click on the options in the "Opening period". The default window of the ATR here is 14 periods, but you can change this if you want to in "ATR period". Most importantly you are able to select which multiples of the ATR you would like to use in the settings in "ATR multiple 1" which is the green line, "ATR multiple 2" which is the blue line, and "ATR multiple 3" which is the purple line. You can select any values you want to put in these, the choice of 0.25, 0.5, and 1 is not special, some people use fibonacci numbers here or simply 0.33, 0.66, and 0.99.
Repainting issue: This script uses the daily value of the Average True Range (ATR), which measures the volatility that is happening today. If price becomes more volatile then the value of the ATR can increase throughout the day, but it can never decrease. What this means is that the ATR based pivots are able to expand away from the opening price, which should not affect the trades that you take based on these areas. If you base your take profit on one of these ATR multiples and the daily volatility increase this means that your take profit area will be closer to your entry than the ATR multiple. Meaning that your trades will be more conservative.
While this all may sound very technical it is super intuitive, throw this on your chart and play around with it :)
Happy trading!

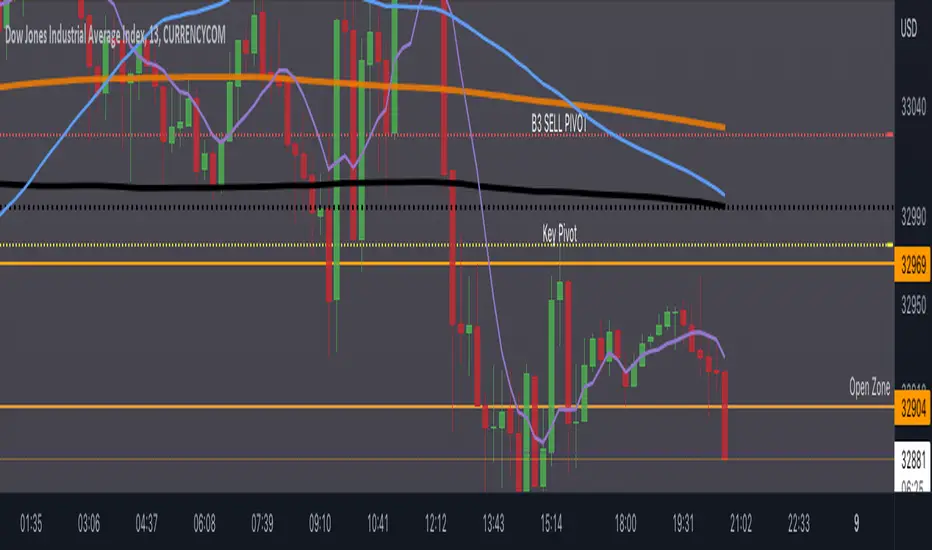
Protege Pivots Swings PointsThis is my version of my pivots points when i use it.
I use the same parameters that Gregory Mannarino use for his evolution system.
I just show it to be better for a quick view.
Trade at your own risk!

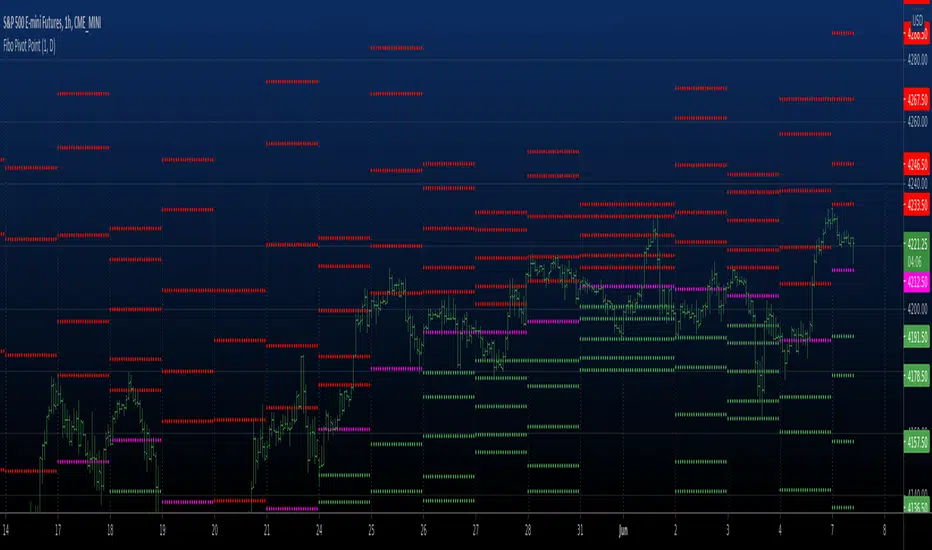
Fibonacci Pivot RangeThis is based on Fibonacci Pivot Points. I forked "CristianD CD_PivotR" code for this. Thanks
"Fibonacci Pivot Points start just the same as Standard Pivot Points. From the base Pivot Point, Fibonacci multiples of the high-low differential are added to form resistance levels and subtracted to form support levels."
Pivot Point (P) = (High + Low + Close)/3
Support 1 (S1) = P - {.382 * (High - Low)}
Support 2 (S2) = P - {.618 * (High - Low)}
Resistance 1 (R1) = P + {.382 * (High - Low)}
Resistance 2 (R2) = P + {.618 * (High - Low)}
Adding more support or resistance levels should be really easy.

Buy and Sell Signals using EMA, Stochastic and PivotsBuy and Sell Signals using EMA, Stochastic and Pivots
Programmed to best work for short-term strategies.
Less number of signals but more accurate.
Works best on the Hourly chart with Stocks in an uptrend.
Results are tested using an initial capital of 1000.
Disclosure : I have not tested it on many stocks. Hence, please let me know your feedback so I may improvise it.


Seasonal pivot datesPlots approximate equinox and solstice dates, which are often zones around which market pivots occur.

Dynamic Fibonacci Pivot Points & EMA CrossoversI have created this script for those who face difficulties drawing Fibonacci levels as this script is Dynamic so it automatically calculates the ranges based on current High and Lows. I have also added Standard Fibonacci Pivot Points so that we can easily see the confluences between Dynamic and Standard pivot points. Apart from this I have also added EMA Crossovers so that we can easily identify trend changes. You can modify this script as per your own.

Fibo Pivot Point Copyright by HPotter v1.0 07/05/2021
Fibo Pivot Points
Added change TF for calculate.
Original version:by BhavikBhavsar