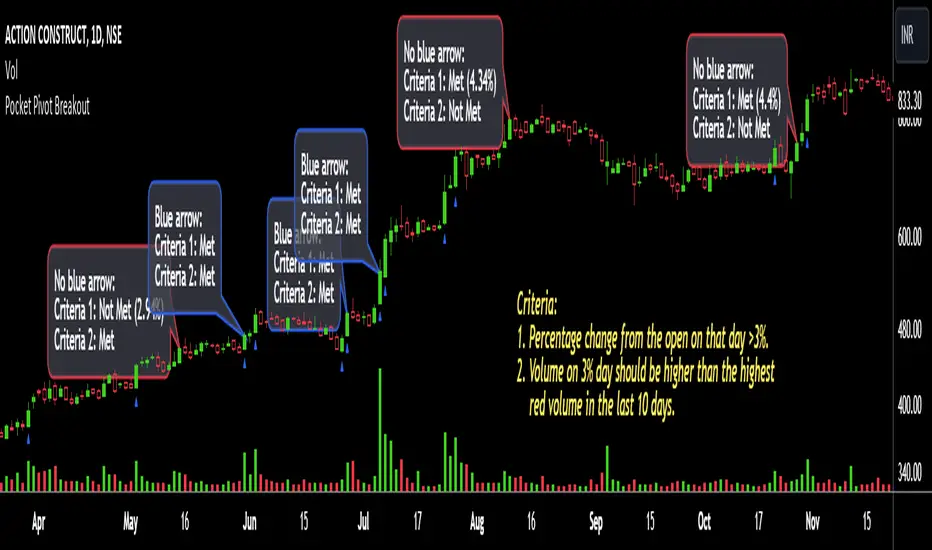
Pocket Pivot BreakoutPocket Pivot Breakout Indicator
The pocket pivot breakout indicator will show a blue arrow under the candle if both the following conditions are met:
1. The percentage change of the candle on that day from open is greater than 3%.
2. The volume on the day of 3% candle is higher than the highest red volume in the past 10 days.
The second condition is based on the 'Pocket Pivot' concept developed by Gil Morales and Chris Kacher.
If only one of the conditions is met, while the other is not, there will be no arrow.
How to use the Pocket Pivot Breakout indicator?
1. If the stock is breaking out of a proper base like (cup & handle, Darvas box etc.), you can use the blue arrow as an indicator to make your initial buy.
2. If you already own a stock, the blue arrow indicator can be used for pyramiding, following a continuation breakout from a proper base.
3. Avoid making a new entry or continuation entry if the stock is too extended from 10ma.
Gap-up > 0.5% Indicator
Gap-up Indicator displays a blue colored candle when a stock gaps up by more than 0.5% compared to previous day's close.
It is turned off by default. To activate it, check the box next to Gap-up > 0.5% in the indicator options.
How to use the Gap-up Indicator?
1. When a stock gaps up, it usually indicates strength, especially if on the day of the gap-up, the stock closes strongly.
2. This indicator should not be used in isolation but with a proper base breakout from a tight consolidation.
3. If a stock is already extended from 10ma, avoid taking any new or continuation entries.
Precautions
1. Avoid buying longs when the general market conditions are not favorable.
2. Avoid buying stocks below 200ma.
3. Avoid making a new entry or pyramid entry if a stock is too extended from 10ma.
Important Points
1. Always choose fundamentally strong stocks showing strong growth in earnings/margins/sales.
2. Buy these fundamentally strong stocks when they are breaking out of proper bases.
3. To learn more about pocket pivots and buyable gap-ups, read the book, Trade Like an O'Neil Disciple (by Gil Morales & Chris Kacher).
Cheers
Simranjit
ค้นหาในสคริปต์สำหรับ "pivot"
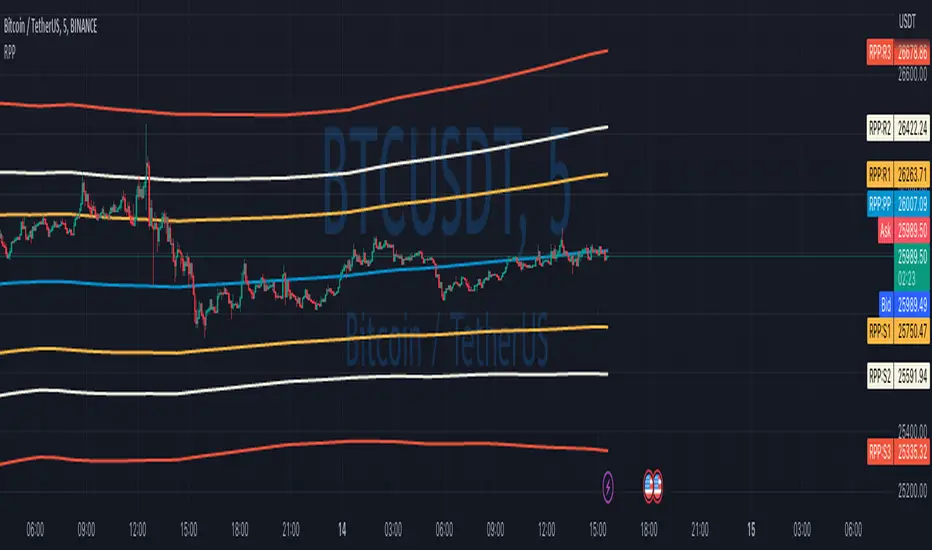
Rolling Pivot PointsStandard Pivot Points are calculated from the previous day’s (week/month/year) close/low/high values. But what is the day close for cryptocurrencies trading 24/7 on exchange? Does it make sense to use a specific time price as a close if it continues trading after that?
So I solved that issue with Rolling Pivot Points, where I calculate pivot points not at the end of the period but for every bar on a rolling basis. Every time I recalculate pivot points, I look at a window of period length in bars and base my calculations on these bars. This way, you get smooth pivot points changing with every bar, and it should better represent support and resistance for the price.
In this indicator, I implement three types of pivot points.
Camarilla
Fibonacci
Traditional
In terms of period, you can select any one you want. If you’ll keep Auto Indicator well, compute period automatically. For two days, for example, use ‘Day’ in Period and 2 in Period Mult parameters.
You can also change the type of MA used to smooth Pivot Points.
Disclaimer
Please remember that past performance may not be indicative of future results.
Due to various factors, including changing market conditions, the strategy may perform less well than in historical backtesting.
This post and the script don’t provide any financial advice.
Three-Day Rolling PivotThe three-day rolling pivot is another pivot concept,
which may be used by intermediate positions, for several days or even weeks.
It can be utilized in many ways, such as to determine an entry point or trailing stop.
As the name suggests, this pivot is based on the last three days.
I learned this concept of the book "The logical Trader" by Mark Fisher.
Kudos go to him!
My version of the Three-Day Rolling Pivot uses actual data!
And all similar scripts I have found so far calculate future data and don't take into account the original data.
I hope this script will help some people to do some better decisions.
And I am pleased to get some advice to make this script even better!
Future data vs original data
Pine Script v5 Reference Manual:
Merge strategy for the requested data position... This merge strategy can lead to undesirable effect of getting data from "future" on calculation on history. This is unacceptable in backtesting strategies, but can be useful in indicators.
e2e4 on Stack Overflow said:
Pine v1-v2's security() function is using the lookahead parameter by default, which could be modified in v3-v5...
stackoverflow.com
I haven't found a script which put this into account jet.
I leave this option available for people that wanna more speculated data. But it's disabled by default.
Long/Short Example
You can enter Long when the market cross over the upper line (default color is green) and you should put your trailing stop 1-5 ticks below the lower line (default color is red).
The opposite when Shorting, then the market has to cross down the lower line and your trailing stop should be 1-5 ticks above the upper line.
How does this script work:
First it fetches the highest high of ...
yesterday,
the day before yesterday,
and the day before that.
After that the script looks for the highest high of all three.
Next it does the same for previous lowest low.
Last but not least, it fetches the closing price of the last day.
After that it adds all three prices together and divide them by three.
This result in a three day pivot price.
Then it adds the highest high and lowest low of the three last days and divide it by two.
This gives us the second number we need to calculate the differential.
The differential is the gap between the three day pivot price and the second number.
Sometimes the second number is bigger than the three day pivot price so I took that into account too. Other wise the colors plotted would be on the wrong site.
Finally, the script is rounding the numbers to the nearest minimum tick of that security.

[JL] Supertrend Zone Pivot Point with zigzag fibThis is an open-source Pine script that generates a Supertrend Zone Pivot Point with Zigzag Fib indicator for TradingView. The indicator displays the Supertrend Zone, pivot points, and Fibonacci levels on the chart.
One of the unique features of this indicator is that it uses a Zigzag that does not repaint, ensuring accurate high and low points for the pivot points.
Another feature is that when the Supertrend is in an uptrend, only the highest points are taken as pivot points, and when it's in a downtrend, only the lowest points are taken as pivot points.
The Fibonacci levels are calculated based on the previous high and low pivot points, with labels displaying the corresponding levels on the chart.
The indicator also includes options to show/hide the Zigzag and Fibonacci levels.
Overall, this indicator is useful for identifying key pivot points and Fibonacci levels in the Supertrend Zone, providing valuable information for traders to make informed decisions.

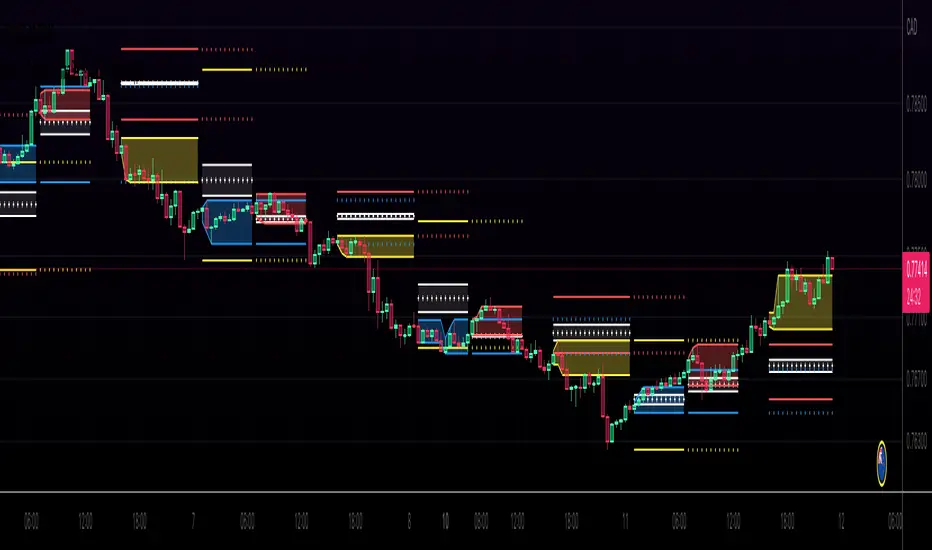
Bagang Pivot Zones | Supply & Demand, Support & ResistanceBagang Pivot Zones detects imbalances from classic reversal and momentum price actions.
Imbalances create pivot zones, a.k.a Supply & Demand / Support & Resistance / Orderblock zones.
Use Cases
1. Traders using Supply & Demand theory can quickly pinpoint imbalance zones created by BUY-to-SELL and SELL-to-BUY candles.
2. Trend Following traders can systematically catch and follow a trend based on pivot zones analysis.
3. Breakout traders can easily target pivot zones’ breakout and breakdown.
4. Take the guesswork out of risk management: manage stop-loss precisely behind pivot zones.
5. Analyze contrary pivot zones to set realistic profit targets.
Objectivity
By only comparing OHLC values to identify notable price actions, Bagang Pivot Zones avoids derived calculations with subjective parameters.
Chart Issue
If the chart zooms out after adding an indicator, right-click the price scale and toggle "Scale price chart only” on.

Bias Pivot PointA simple indicator that uses Pivot Points as a filter and to generate a Directional Bias .
How to use this indicator?
1. Directional Bias
Bullish => Closing Price > Pivot Point
Bearish => Closing Price < Pivot Point
2. Support / Resistance
Each Pivot Points can be used as Support or Resistance
3. Take Profit Targets
Each Pivot Points can be used as targets for taking profit

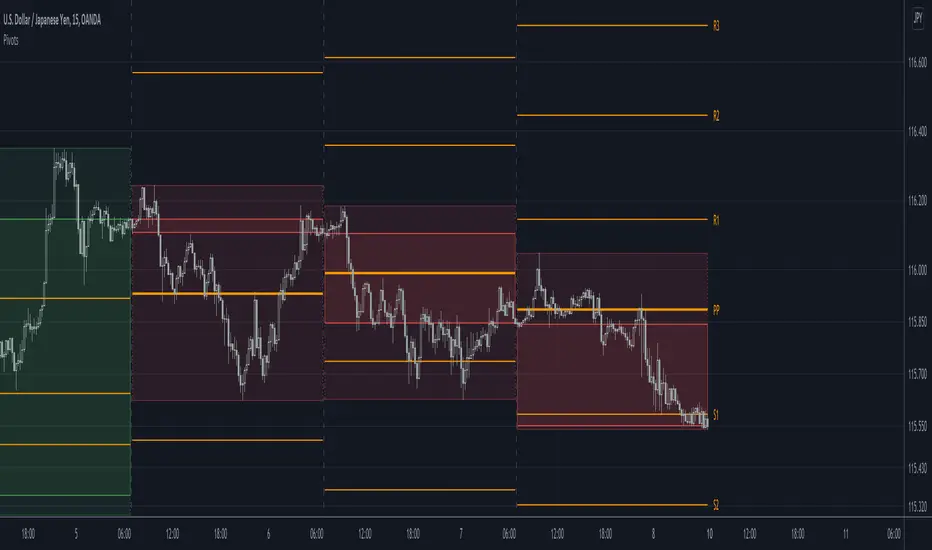
Fibonacci Pivot ZonesFibonacci Pivot Zones make use of the average price between the high, low & close of the previous session, while adding deviations based on Fibonacci numbers to form support and resistance zones, which can be used as targets for intraday and swing trading.
You can select the timeframe for the zones, for example 12 hour pivots to trade in 15m timeframe, or even monthly pivots to trade on the daily timeframe.
You can choose the different fibonacci levels on the menu, by default these are:
0.382
0.618
0.782
1
Enjoy!
Kviateq - Session Pivots for CryptoPretty much the exact same indicator as my other Session Pivots, however this one also shows the weekends and the session times are set to Bitmex exchange (note: I'm in a GMT+7 timezone myself).
Fibonacci Pivots Monthly and Weekly Full (no history)Fibonacci Pivots Monthly and Weekly Full (no history)
Inspired by FxChartAnalyst trader, with his great Monthly Weekly Daily Pivot Points Standard indicator
www.tradingview.com
This indicator calculates and plots both Monthly and Weekly pivots on a chart. Pivots are based on the Fibonacci ratios of the previous Month/Week candle close.
Good luck everyone!

(JS) Multi-Time Frame Pivot Point Detector 2.0So here's an updated version of my automatic Pivot Point detector.
If you don't like having a bunch of Pivots on your chart at once, or having to cycle through various resolutions to see different ones, this is for you!
What does this indicator do? It automatically detects the nearest daily, weekly, and monthly pivot points both above and below the current price and automatically plots them for you. It's really just as simple as that.
You select how far back you want it to plot with the "Pivot Point Look Back Period" option.
I also have transparency options for each type of pivot so its easy to find the opacity you prefer and save it as a default setting.
With "Turn Off Each Pivot Point On All Time Frames" turned on, as an example, if you were to uncheck "S1/R1" then it turns S1/R1 plots off across all 3 pivot resolutions. By default however, I have it set where you can pick and choose each one individually.
I also added the default "VWAP Periodic" script from TradingView in there with it (not in prior version). This works identical to the built in indicator (because it is identical).
Trading algorithms like to target pivot points and liquidity, so I figured they would pair together nicely for active trading.

CPR and Camarilla PivotsThis script has CPR ranges for (Daily, Weekly, Monthly) and Major pivot levels for daily (R/S 3,4,5) weekly (R/S 3,4). It also has prev day H/L and weekly H/L.
- Daily CPR (Black dotted lines)
- Weekly CPR (Blue dotted lines)
- Monthly CPR (Fushcia dotted lines)
- Prev Day H/L (Orange dotted lines)
- Weekly H/L (maroon dotted lines)
- Daily pivots R/S 3,4,5 (black cross lines)
- Weekly pivots R/S 3,4 (blue cross lines)

Clean Pivot By Ravi BelkhindiThis indicator create pivot on intraday charts, It has the following features
1. Create Pivots on intraday chart extending till the session closure time ( till 3.30 PM IST )
2. Dynamically plot Monthly and Weekly plots only if fall in daily pivot zone ( R3 to S3 )
3. CPR zone color indicated narrow and wide range, user can change the definition of narrow range in terms of %
4. Pivot visible only in intraday timeframe

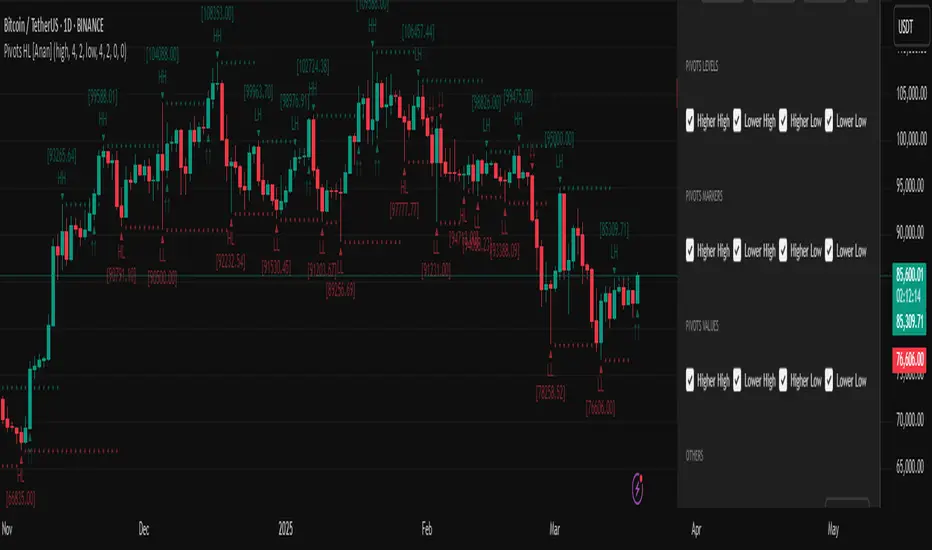
Pivot Points High Low (HH/HL/LH/LL) [Anan]Hello Friends,
This is my own version of ( Pivot Hilo Support n Resistance Levels R3-3 by JustUncleL )
- V4 Pinescript
- Removed MA dependency filters
- Add some arrows

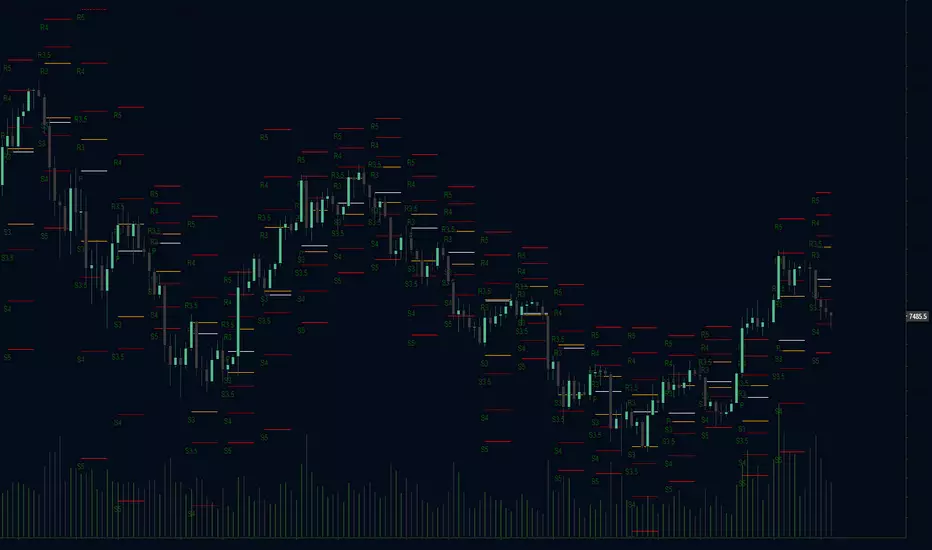
Fibonacci Camarilla Pivot Points Strategy Prototype
Camarilla pivot points with level 5 and another level 3 based on 1.618 added
Option to toggle regular Camarilla or Fibonacci based Camarilla pivot points
Option to toggle labels, candle overlay, levels, and more
Camarilla pivot points have greatly interested me due to the extremely choppy nature of the cryptocurrency market when it isn't going through a bull run. Camarilla pivot points aren't traditional pivots; the hlc3 of the previous candle close is the basis for each level, as the inventor felt that mean reversion to that previous value was likely.
Automatic Monthly Pivots with built-in Fibonacci LevelsClassic Floor Trader Pivots (algorithm decision points) with color segmented Fibonacci levels plotted in real-time Enjoy! Multi-variable Time Frame Pivots with Custom fib levels is in works.

STS Pivot System Multi Time Resolution PlotsThis Indicator can be used on ALL Time Frames - It plots the 1H, 2H, and Daily Pivots and 60M Targets
You can move to and from your favorite time frames and the "STS Pivot System" plots remain on the indicated time frames
The Published scripts are published as PROTECTED and INVITE ONLY for use by our
Subscribers to our Premium Alerts and "STS Pivot System" OR "STS Pivot System Charting Package"
Weekend Access Free Trial Available
More Information can be found at www.stspivotsystem.com
Be sure to check out our Videos on the "STS Pivot System"
youtube.swingtradersetups.com
Trading View Script Disclosure
As a Subscriber to our Service and Chart Setups Members acknowledge their
responsibility to perform Due Diligence of stocks featured. We are not financial
advisers and we perform NO Fundamental Analysis. We are only Price Action and
Momentum driven in our charts and ideas.
SPECIAL CAUTION should always be given to stocks about to have earnings and we
recommend NOT being in a short term swing trade into a Earnings Release. At the
same time using our Pivot System and Chart indicators can prepare you for the after
Release Trade Setups. Subscribers also Acknowledge awareness of News and Chatter
Effects on Stock Prices.

[RS]Shifted Pivots V1update: added weekly and monthly pivots, the offset is a average approximation so there may be inconsistency on the date forecasted to be end of week/month.
(using diferent sessions or limited time intervals is not possible).

Multi-Pivot Plotter//================================================================================
//📌 Manual Pivot Plotter (4 Sets: P, R1–R3, S1–S3)
// - Up to 4 indices
// - Each index: Name + P/S/R values
// - One shared Style block: colors, visibility, line width (applies to all indices)
// - Lines start at 00:00 UTC+8 and extend a few bars
// - Labels at line end or start, with optional "Index Name" and price value
//================================================================================

Developing Camarilla Pivots by Hexaurum LearningMathematical Foundation
The Camarilla Formula
The Camarilla pivot levels are derived from the following key price parameters of the preceding trading session:
C = Prior day's closing price
H = Prior day's high price
L = Prior day's low price
Resistance Levels:
H5 = (H / L) × C (proprietary derivation for identifying extreme
resistance)
H4 = (H 3 L) × 1.1 / 2 + C
H3 = (H 3 L) × 1.1 / 4 + C
H2 = (H 3 L) × 1.1 / 6 + C
H1 = (H 3 L) × 1.1 / 12 + C
Support Levels:
L1 = C 3 (H 3 L) × 1.1 / 12
L2 = C 3 (H 3 L) × 1.1 / 6
L3 = C 3 (H 3 L) × 1.1 / 4
L4 = C 3 (H 3 L) × 1.1 / 2
L5 = C 3 (H5 3 C) (symmetrical derivation mirroring H5)
The Significance of the 1.1 Multiplier
The inclusion of a 1.1 multiplier in the formula incorporates a buffer for anticipated volatility expansion. The sequential divisors (2, 4, 6, 12) generate a
series of levels with decreasing incremental distances from the closing price, with each level delineating distinct probabilistic trading zones for potential
mean reversion or trend continuation.

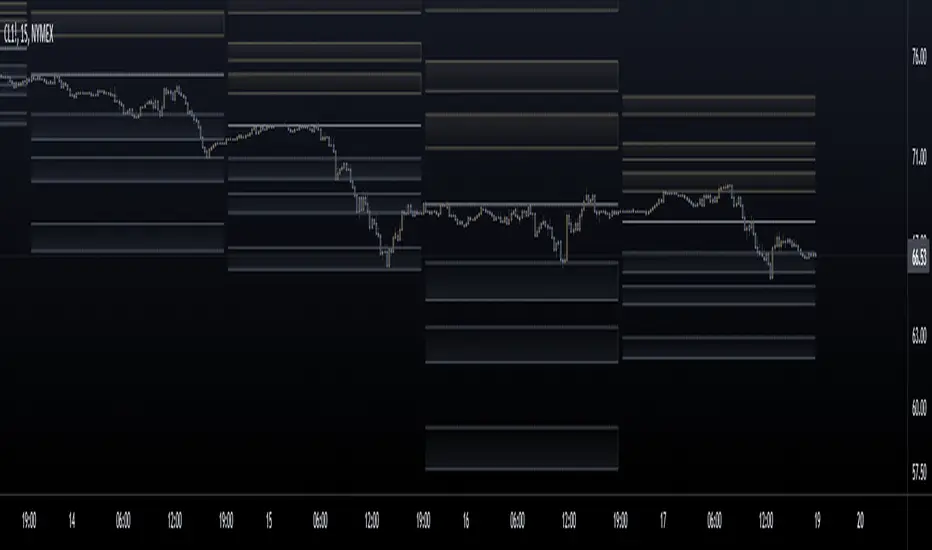
PIVOTBOSS ADR The PivotBoss ADR Method offers a complete approach to analyzing the volatility for a
given market in multiple timeframes by simply using average daily range. The ADR Breakout
helps us identify markets that are extremely compressed and due for significant expansion.
The PivotBoss ADR Targets Indicator is a simple, yet powerful, tool that helps you forecast extremely accurate targets based on the volatility of a given instrument. This indicator self-adjusts to a market's current volatility in order to plot reliable targets in multiple timeframes, including daily, weekly, and monthly targets.
1. Compression/Expansion: The development of trading ranges (Compression) builds the energy that will lead to the next
phase of price discovery (Expansion). ADR helps us quantify when a range is significantly compressed and due for expansion.
2. Volatility: Measures the SPEED of a market in order to forecast future volatility and price behavior. Markets rotate between
LOW and HIGH volatility states. Low ADR readings (<65% ADR) suggest significant compression, implying expansion ahead.
3. The ADR Breakout (Expansion Day): A true breakout from a narrow ADR range includes an Expansion Day, which is a
Trend Day on Day 1, wherein the session’s midpoint exceeds the breakout point and sees a Close beyond the range.
4. The ADR Breakout (Rejection Day): A failed breakout from a narrow ADR range includes a Rejection Day, which may take
the form of a long tail on Day 1, wherein the market attempted range expansion, but failed and closes back within the range.
This signature oftentimes leads to major expansion on the OPPOSITE side of the range.
5. A Variety of Trade Opportunities: Once TRUE expansion occurs from a narrow ADR range, a variety of trade opportunities
present themselves over the course of the next several days, or even weeks. These opportunities include swing trades, day
trades, and even scalps. Understanding when and where to look for these opportunities is key

Pivots libraryLibrary "Pivots"
TODO: add library description here
pivots(_type, _open, _high, _low, _clsoe) Calculates the pivot point and returns its value.
Parameters:
_type : Specifies the type of pivot point.
_open : The open price
_high : The high price
_low : The low price
_clsoe : The close price
Returns: Returns the value of the calculated pivot point as a tuple.
cpr(_high, _low, _clsoe) Calculate the Central Pivot Range
Parameters:
_high : The high price
_low : The low price
_clsoe : The close price
Returns: Returns the values as a tuple.
htf_ohlc(_htf) Calculate the HTF values
Parameters:
_htf : Resolution
Returns: Returns the values as a tuple.
Isolated PivotsThis script identifies potential price reversals at pivot high/low points using sets of 3 candles.
Pivot High: The middle candle must have a higher high and a higher low than the two outer candles.
Pivot Low: The middle candle must have a lower low and a lower high than the two outer candles.
Potential usage: When a market is moving higher in an uptrend, if a pivot low is identified then that might be a sign of price weakness.
