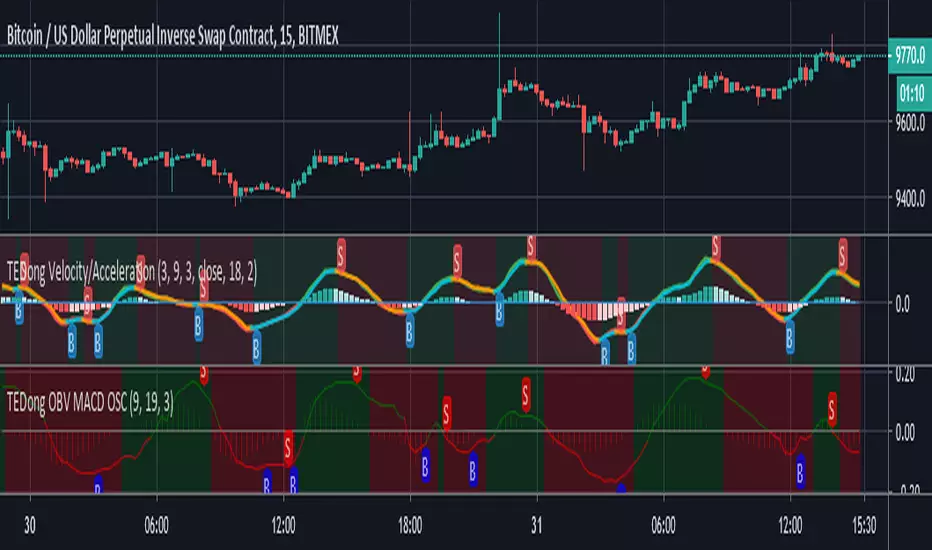
TEDong OBV MACD OSC ==> ProfitHi, Folg,
OBV MACD OSC gives a Buy signal when the OBV value crosses up its EMA and a Sell signal when it crosses down its EMA.
Cross over markers Directional bgcolor, where RED for bearish (S) and GREEN for bullish (B)
If you include volume analyses in your trading strategy, automating OBV MACD OSC will give buy signals whenever volume and price are rising altogether.
DONATE/TIP
BTC: 13nhMN2H4LoRi4VMcPcyR96jitxrH3uivB
ออน บาล๊านซ์ วอลุ่ม (OBV)
TA-Money Flow-Version3This is the MACD of a stochastic OBV movement indicator. It is good (right) to work with both price and volume. I've included highlighting based on price divergence. It works great on any time frame, but you need to have volume data. Not sure where I originally got this (stoch-OBV, somewhere off Tradingview several years ago, thanks to the person who shared), just publishing because of a request.
Enjoy.
Version 2 - TA-Money-Flow-v2-Stochastic-OBV

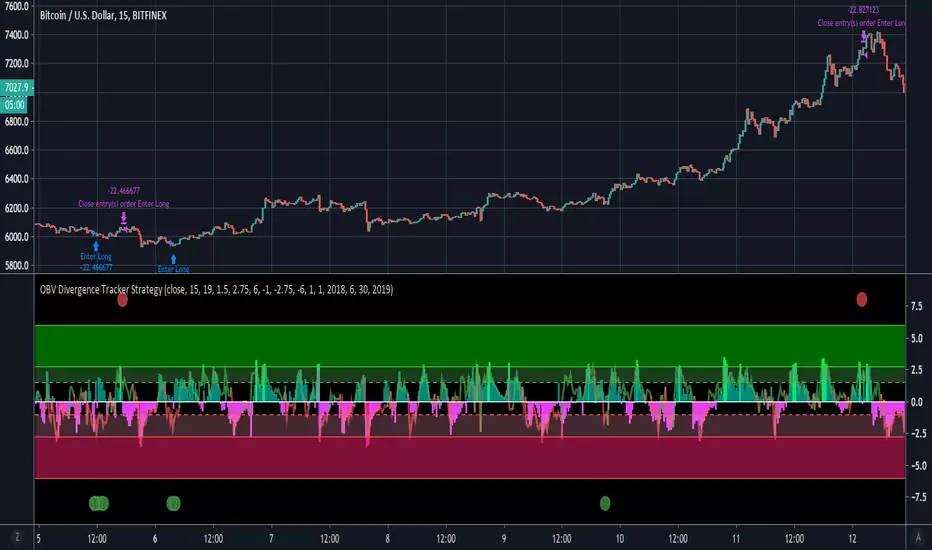
OBV Divergence Tracker StrategyThis strategy combines OBV Z Scores and price Z Scores to identify divergences and generate entry and exit signals.
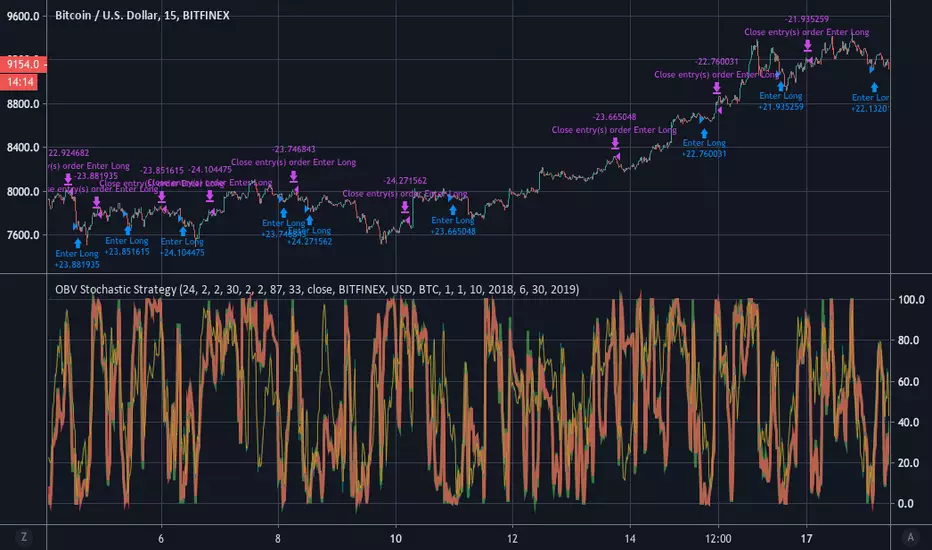
OBV StochasticsThis indicator uses both a standard Stochastic Oscillator based on security prices and stochastically oscillated OBV values.
Explanation:
Stochastics measure momentum by comparing the current closing price to its lowest and highest price over a user-defined window of n periods. Without going too in depth, traders can view the K value as the current value for the stochastic indicator and the D value as a Simple Moving Average of K values. Users can adjust the length of that Simple Moving Average through modifying the smooth D parameter in the input option menu.
Traders can also define the upper and lower bounds for both sets of K and D values. These are plotted on the graph as the horizontal red (upper) line and horizontal green (lower) line. Generally, the upper line is viewed as the threshold at which a security can be considered overBought. Conversely, the lower green line is the threshold at which they can be viewed as overSold.
OBV, or On-Balance Volume, is a versatile momentum indicator that we discussed in our OBV Z-Scores open-source script. That is a good place to look if you're looking to gain a better understanding of the OBV indicator. By applying the stochastic formula to the OBV, it allows us to gain a better understanding of the current OBV value relative to its historical data and display the OBV in a {0.100} bounded range of values.
Plotting the standard price-based Stoch. K and D in combination with the Stoch. OBV K and D can help identify divergences and track the progression and direction of trends. For example, you can see that when the two move in opposite directions or when one significantly outpaces the other, it often hints towards an impending reversal.
The Graph:
As mentioned the upper and lower overbought and oversold thresholds can be adjusted by the trader and are plotted on the graph in red and green.
The green oscillating line represents the Stoch. K of OBV values, while the red line symbolizes the OBV D values.
The teal line is the standard Stoch. K and the orange line is the standard Stoch. D.
Users have two options for background highlights. The first option is to use green highlights to show entry signals and red highlights to show exit signals. These signals are based on the criteria we have set for identifying optimal entry and exit points. This is shown in the second pane.
The second option is to plot red highlights whenever Stoch. OBV K crosses the upper bound and green highlights whenever it crosses the lower bound. This is shown in the bottom pane. NOTE: Choosing this option means that signals will not be displayed in sequential entry-exit order (instead this is a good option if traders only want to identify when the security is overbought or oversold).
Input Options:
Traders can adjust the respective smooth K and smooth D values for both the standard stoch. and OBV stoch. Additionally, the lookback window length can be adjusted as well as the upper and lower bounds(in addition to the display options shown above).
Alerts:
Indicator sends alerts when entry and exit conditions are met, as well as alerts to inform traders when overbought/oversold conditions are met. Alerts can be tailored for GunBot / other automated trading platforms upon request.
~Happy Trading~

OBV Z-ScoresThis study calculates the On-Balance Volume (OBV) and displays it in terms of its Z-Score.
OBV is a great momentum indicator . As the name suggests, OBV predicts changes in price based on the security's volume flow.
Formula:
if (Current Price > Previous Price)
then Current OBV = Previous OBV + Current Volume
if (Current Price < Previous Price)
then Current OBV = Previous OBV - Current Volume
if (Current Price == Previous Price)
then Current OBV = Previous OBV
As the formula shows, the OBV goes a step beyond just looking at the pure volume of a security. Instead, it factors in relative price action from period to period to reflect investor sentiment. As a result, we often look to the OBV to spot bullish or bearish trends while they are in the early stages of development or simply predict impending uptrends or downtrends.
To make the OBV easier to visualize, we converted the value to a Z-Score. The Z-Score is a simple statistical measurement and represents the current OBV value's distance from the mean OBV value in terms of # of standard deviations.
Users can adjust the values for the 2 upper bounds for Z Scores and 2 lower bounds. Additionally, the n value for z score calculation can be adjusted in the input menu. A higher n value means the z score will be based on a longer lookback period. A lower value will result in more sensitive readings.
Overall, I think this is an interesting way to represent OBV values and will be a valuable leading indicator.
~Happy Trading~

Cryptohopper OBVCryptohopper is an automated trading platform where you can automate your strategy based on technical indicators and candlestick patterns. OBV is one the indicators that you can automate with Cryptohopper.
How can you automate it? OBV gives a Buy signal when the OBV value crosses up its moving average (default: EMA) and a Sell signal when it crosses down its moving average.
If you include volume analyses in your trading strategy, automating OBV will give buy signals whenever volume and price are rising altogether.
Start automating your trading in Cryptohopper.com
--CRYPTOHOPPER--

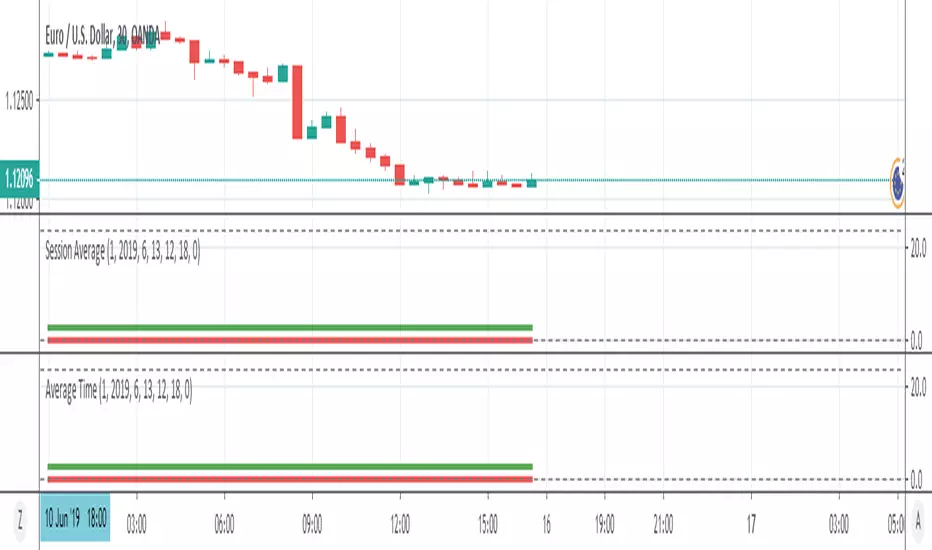
Session AverageThis indicator finds the average time of High or Low formed in sessions.
This is a request from trader @Salmanmahmood15 . You need permission from him to fully use it
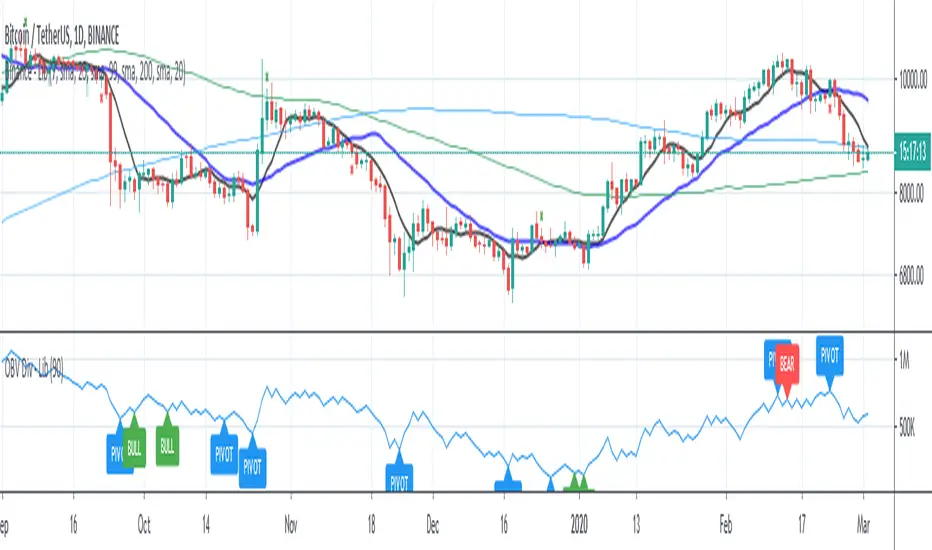
OBV On Balance Volume - Divergences - LibertusHello all,
As my RSI divergences script became popular, I got few requests for making divergences scripts on other indicators.
One of most popular and requested indicators next to RSI is OBV (on balance volume) which measures buy and sell volume based on candle close (green/red).
So finally, here it is, divergences script for OBV. I'll probably also make candle edition script after I iron out bugs on this one.
Have fun and good luck with trading.
Note for those that are not familiar, here you can find my RSI divergences scripts:
RSI Divergences - regular -
RSI Divergences - candle edition -
Gainzy OBV DiagsPlots diag breakouts and breakdowns of on balance volume. Toggle allows you to turn diags on and off. Default leaves them off since it's easier to view obv this way.
green = breakout
lime = parabolic breakout
red = breakdown
fuchsia = sell-off
all other colors are indicative of chop

OBV+ (v0.1)Just playing around with some ideas I had with On Balance Volume (OBV). Added a divergence spotter and EMA's that all uses OBV as a source. Let me know if you have any feedback!
My main use of OBV:
1) Confirm trend continuation: When price has a clear trend, OBV should be aligned with the trend.
2) Discover price reversal: When price and OBV moves in opposite directions, you can expect a reversal.
DIVERGENCE SPOTTER
The spotter will tell you when there are divergences between OBV and price. These are useful as they can indicate a trend reversal;
Regular Bullish Divergence
If price is making lower lows (LL), but the OBV is making higher lows (HL), this is considered to be regular bullish divergence .
This normally occurs at the end of a DOWNTREND.
Regular Bearish Divergence
Now, if the price is making a higher high (HH), but the OBV is lower high (LH), then you have regular bearish divergence.
This type of divergence can be found in an UPTREND. After price makes that second high, if the OBV makes a lower high, then you can probably expect price to reverse and drop .
Hidden Bullish Divergence
This can be seen when the pair is in a UPTREND.
Once price makes a higher low (HL), look and see if the OBV does the same.
Hidden Bearish Divergence
Lastly, we’ve got hidden bearish divergence.
This occurs when price makes a lower high (LH), but the OBV is making a higher high (HH).
By now you’ve probably guessed that this occurs in a DOWNTREND.
When you see hidden bearish divergence, chances are that the pair will continue to shoot lower and continue the downtrend.

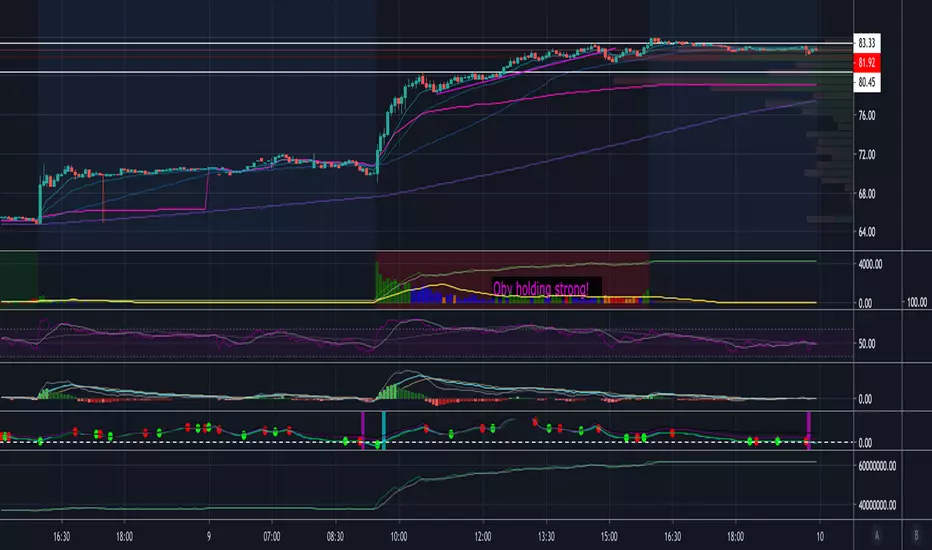
ALPHA: VolumePLEASE READ THE ENTIRE POST BEFORE PURCHASING & USING THE ALPHA: Volume INDICATOR. Saves you and me some time in emails and messages. :)
Volume is the only true predictive method for an assets movement.
Most of my followers know I am volume-obsessed, volume precedes price and identifying major spikes in volume prior to an assets movement is one of the most valuable finds a trader can accomplish. I have spent more time studying volume then any other analysis technique. During this time I have become frustrated time and time again with the inefficiencies our typical volume indicators produce. We have the old bar volume indicator everyone sees on their charts, OBV, CMF, Accumulation/Distribution, MFI etc. etc., the list goes on. I have my favorites that I have written about in past publications, but none provide a real time volume view to my liking.
Frustration has led me to create something I truly believe is groundbreaking.... And it wasn't easy, by any means.
ALPHA: Volume
The ALPHA series is a suite of indicators designed to improve analysis and past analysis techniques. The ALPHA: Volume provides real time volume in addition to identifying major positions and true visibility into where and when positions are being taken. Being able to consistently identify these qualities creates an invaluable edge on the market.
The average buyer of assets are a drop in the bucket in terms of how they impact daily transactions (volume) compared to institutional buyers. The institutional buyers typically buy in large blocks. When institutional buyers get into the market, they cause significant increase in demand. Like any case of supply and demand, when demand increases and supply stays the same, price will increase. When an asset becomes desirable, it is more likely that supply may decrease (as current holders will be less willing to sell) which will cause even more price pressure.
Based on this volume precedes price analysis, it is probably obvious that there is a herd mentality when it comes to the market. When one institution is buying a large block of an asset, other institutions will spot the buying and be motivated to jump in as well. This increases the pressure on the assets price. You and I are small investors so it is important to join the herd and let the supply and demand caused by the institutions carry our investments higher.
Introduction
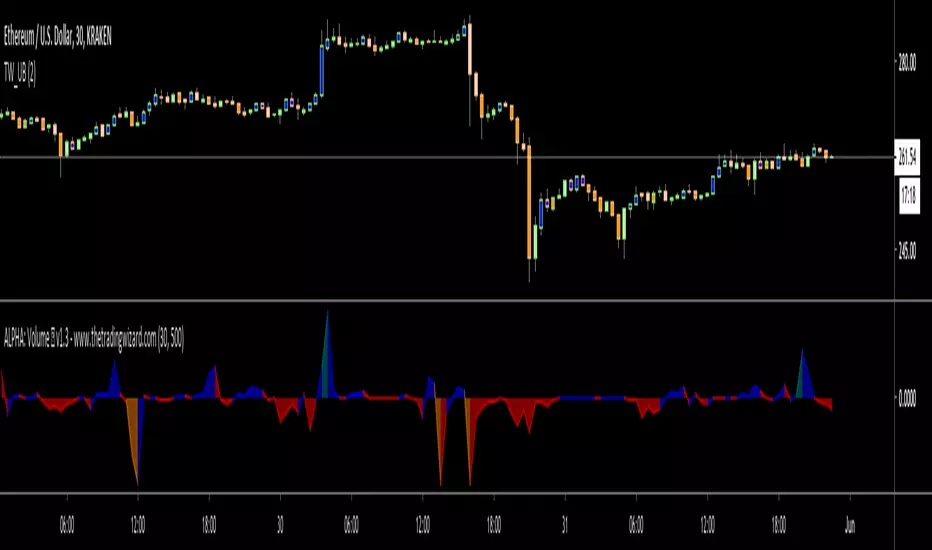
It's fairly simple to read, the default settings show an area with breaks view meaning positive and negative values, this is useful for seeing trends, pressure, and measuring divergences. Additionally, there is coloring to keep an eye on. To keep it simple:
Blue: Buying
Red: Selling
Teal: Heavy buying/major positions being taken.
Orange: Heavy selling/major positions being taken.
Let's get into what ALPHA: Volume does, it has numerous capabilities that I am still discovering, identifying false rallies/sell offs, telegraphing major moves, identifying underwater positions, spotting divergences, bottoms, tops and on and on. One thing to note that it doesn't do is show cumulative volume such as the OBV, this can be useful for identifying rising wedges and similar patterns, I will no longer be using other volume indicators unless I am identifying a pattern that is reliant on cumulative volume.
In this example below, we see heavy selling causing a dip that was then bought up with major positions causing a rally because demand exceeded supply.
The next example shows large positions being taken drying up supply ultimately causing a rally, very well telegraphed.
Same scenario but heavy selling weakening demand.
Originally, I planned on going on and on with examples, but I am going to keep this simple & short as I don't want to prolong the publishing. This will sell itself as more people discover the quality and accuracy. Still not sold? No worries, I'll be doing all of my volume analysis off of this indicator, so stay tuned for more in depth analysis with it on TradingView and twitter, I am truly excited for this indicator to be used by traders and analysts. Those of you that purchase and use it, (already orders off of my site and I haven't even published this) feel free to tag me in a tweet with a chart if you have questions, there will be times when volume is not making sense and perhaps I can offer insight into what is happening.
Conclusion
Before I get messages, "But Nick, the volume indicator was wrong here!".... No it wasn't, its not a signal generator, it is measuring real time volume. I cannot fix peoples' faulty positions that the indicator is showing. Volume should never be used independent of price action & other forms of analysis to determine buying or selling patterns. Volume is extremely important as a confirmation for technical indicators and I strongly suggest you use it as such. I will be doing several videos on this over the next couple weeks on my youtube channel showing ways to confirm other indicators with volume. Ichimoku goes great with it btw :).
Please note this works on all assets on all time frames, during my volume studies with this indicator I noticed lots of noise depending on the time frame, so I have implemented a feature that automatically adjusts to the correct settings based on what time frame you are on. I added a masking feature to keep my work proprietary that shows 30 and 500 (not true) as the settings in case my formula is ever figured out (doubtful but the capitalist in me that believes it is ok to protect what you work for) If you uncheck "Use Preset Periods" in settings then it will allow you to adjust the periods and peak limit, I don't recommend playing around with the settings as you can disturb the balance I've found. However, the option is there for the analysts that are into experimenting. If you feel the need to adjust some things then peak limit is the only thing I recommend adjusting, it allows you to view higher parameter limits on the volume spike to measure divergences of very large orders, the peak limit doesn't matter so much as long as it indicates the teal or orange, some spikes go as high as 80K in testing. In the end the size is typically irrelevant, but it is there in case you want to measure it or have curiosity.
I want to provide research and discoveries from its users and myself on a regular basis. I will be holding discussions & providing research in my discord server that I run with a team of very talented analysts. The link for that is here: discord.gg
This indicator is available for TradingView users on my web site www.thetradingwizard.com for $99, that includes a life time subscription. There is also a monthly subscription option for all three indicators from the ALPHA series. (Please see my published scripts for information on the other two) Both purchase options include updates and support as a user.
This will be the end of the ALPHA indicator series for a while, after finally conquering volume I am moving on with the formulas from the ALPHA series to bigger things. Enjoy!
Disclaimer
Nothing in this post is to be used or construed as financial advice. The indicator is not a signal-generating indicator and should not be used to trade off of solely. This post is meant as an educational post to explain the functions of the indicator.
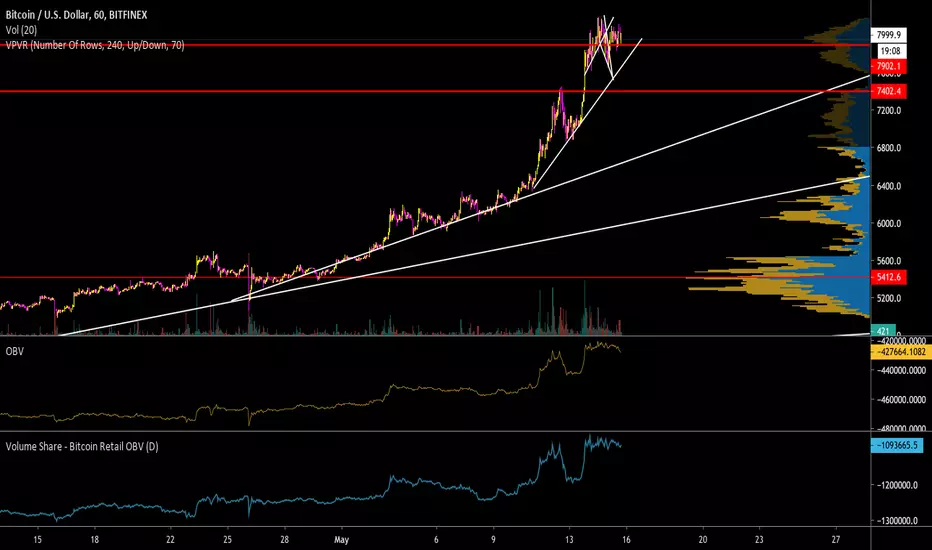
Bitcoin On-Chain OBVThe Bitcoin On-Chain OBV is a port of the classical volume oscillator that reflects the accumulation registered through the On-Chain Transactions.
It also allows to source through the aggregated combined exchange volumes.
The indicator can show the value either in BTC or USD.

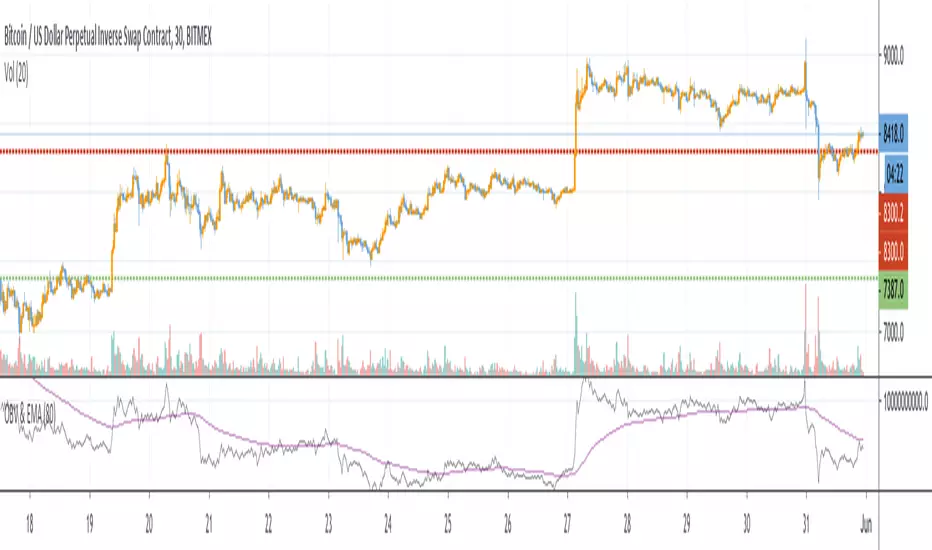
OBV on retail Volume This Indicator takes volume of retail exchanges as input - Bitfinex+Flyer+Coinbase+Bitstamp+Gemini+Binance and calculates OBV on that its always better than calculating obv based on volume of single exchange.
I had excluded futures exchanges like mex, deribit as they don't represent retail
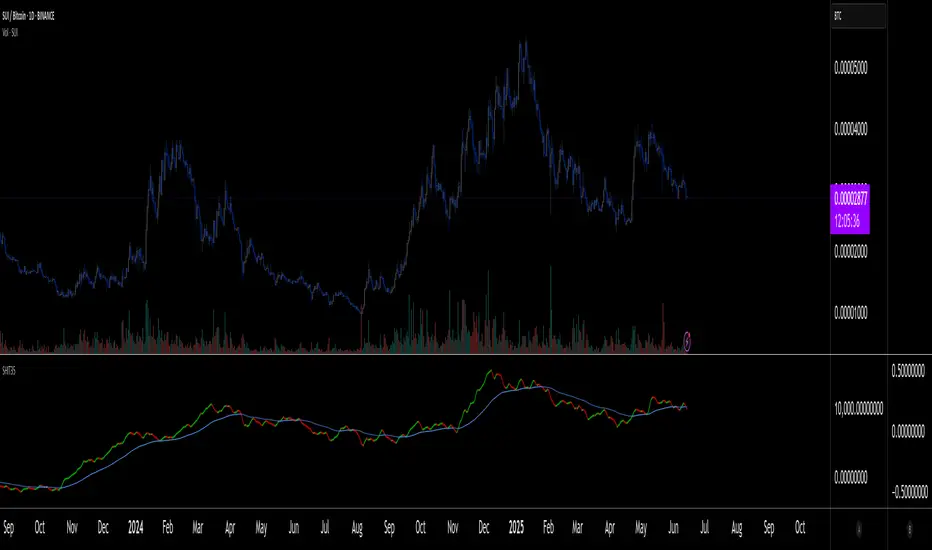
SHIT35 Alt Index (ROC or Volume) [LucF]SHIT35 is an index of 35 Binance alt/BTC pairs. It provides traders with a more reliable read of BTC pairs price movement than the often uncorrelated USD market cap standard.
Because it must read data coming from 35 markets, SHIT35 is painfully slow and should be kept hidden most of the time. Its features will hopefully seduce traders in using it nonetheless for market analysis.
Features
The Index can be calculated using 4 different modes:
1. Total of instant rate of change for all 35 markets ,
2. Cumulative total of ROCs,
3. Average of ROCs,
4. Plus/Minus volume (an aggregate OBV, if you will).
Select only one of the methods at a time to prevent confusion between modes.
An option allows showing the correlation between the Index as it is configured, and another instrument (CRYPTOCAP:TOTAL2 by default).
Markers can be used to identify abnormal movements in the Index. They are generated using Index exits from Bollinger bands.
The chart shows the Index with, from top to bottom, the default mode with BTC pairs, with USDT pairs, then mode 2 and 4 for BTC pairs.
Index Components
The Index is not weighed. The 35 instruments composing the index all have equivalents in the USDT quote currency on Binance, so you can easily change to those pairs using the Settings. Choosing another exchange or quote currency will require modifications to the list of instruments in the indicator’s code, since if one of the markets cannot be found, the indicator will not work. If the instrument exists but has no history for some bars, zero values will be used for them.
Watchlists
I have created a watchlist for the 35 markets in each of the BTC and USDT quote currencies. To import the watchlists, save the text you’ll find at these links in a file named the way you want your watchlist to be named and import them using the “Import Watchlist…” function.
BTC Watchlist: pastebin.com
USDT Watchlist: pastebin.com
Alerts
You can define alerts on any combination of markers you configure. After defining the markers you want the alert to trigger on, make sure you are on the interval you want the alert to be monitoring at, then create the alert, select the indicator, use the default alert condition and choose your triggering window (usually “Once Per Bar Close”). Once the alert is created, you can change the indicator's inputs with no effect on the alert.
TA-Money Flow-v2, Stochastic OBVNot sure where I originally got this (somewhere off Tradingview several years ago, thanks to the person who shared), just publishing because of a request.
This is basically a stochastic OBV movement indicator. It is good to work with both price and volume. I've updated to be able to display either as positive only, or both sides (50/-50), also included an invert function. It works great on any time frame, but you need to have volume data.
Enjoy.
I've got a version 3 if you're interested.

Volume Ticks - Increasing Volume Bar Count [LucF]Volume Ticks is a zero-lag market sentiment indicator. It works by providing a cumulative count of increasing volume columns.
A one count is added for each increasing volume column where close>open, and one is subtracted on an increasing volume column if close
OBV-Ichimoku [by: Bijan Ajdary]This indicator adds Tenkansen and 3 types of Kijunsen and ChikouSpan and Kumo to the OBV chart.
Just like the Ichimoku indicator, only with the difference that, OBV was used instead of the price,
And making it highly efficient for professional traders and Analyzers.
Email: bj.ajdary@gmail.com
Telegram Id: @The_Last_Savior

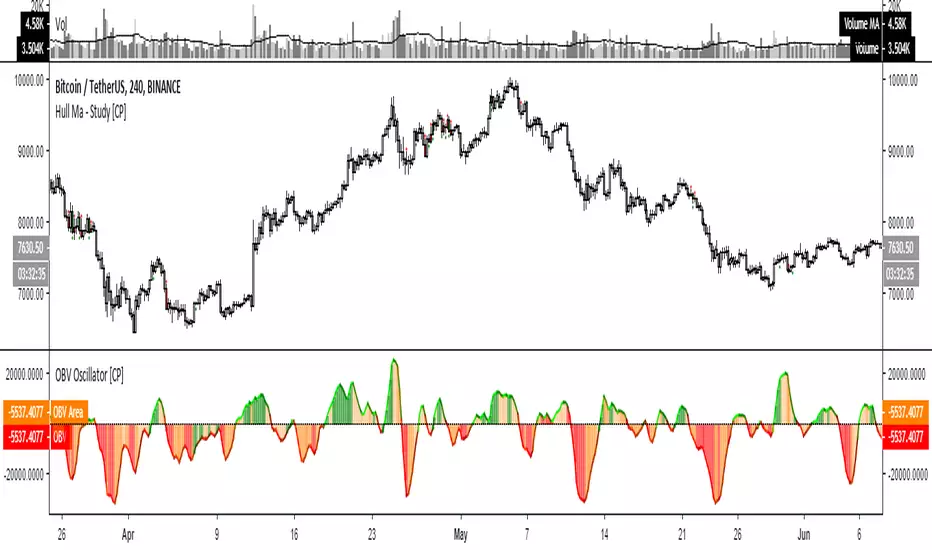
OBV Oscillator [CP]This is my version of the OBV Oscillator and I've used CCI to color the histogram
Line colors:
* Lime rising line above 0 line: Strong Bullish
* Green falling line above 0 line : Neutral Bullish
* Red falling line below 0 line : Strong Bearish
* Maroon rising line below 0 line : Neutral Bearish
Histogram colors:
*Green background above 0 line: Strong Bullish / Overbought
*Orange background above 0 line: Neutral Bullish
*Red background below 0 line: Strong Bearish / Oversold
*Orange background below 0 line: Neutral Bearish