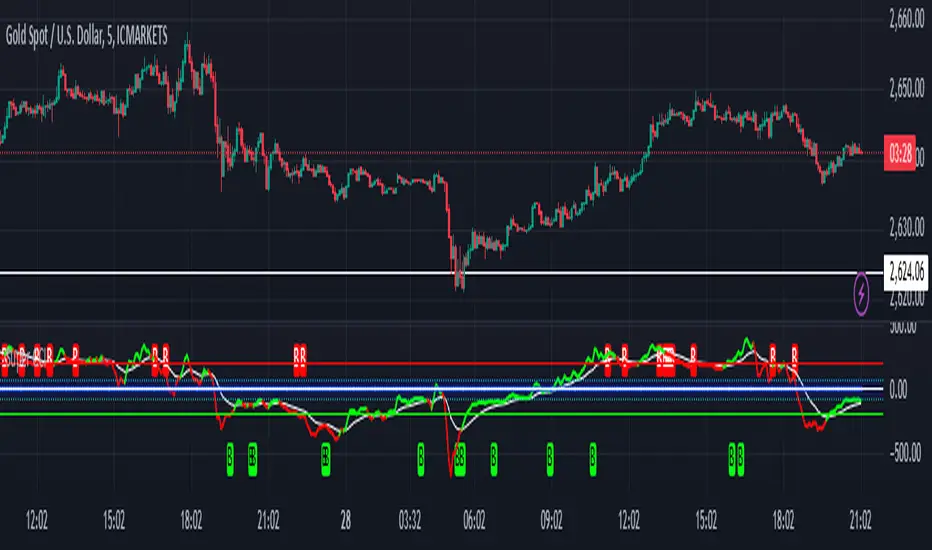
[blackcat] L2 Quantitative Trading Reference█ OVERVIEW
The script " L2 Quantitative Trading Reference" calculates and plots various directional indicators based on price movements over a specified period. It primarily focuses on identifying trends, trend strength, and specific candlestick patterns such as strong bearish candles.
█ LOGICAL FRAMEWORK
The script consists of several main components:
Input Parameters:
None explicitly set; however, implicit inputs include high, low, and close prices.
Custom Functions:
count_periods: Counts occurrences of a condition within a given lookback period.
every_condition: Checks if a condition holds true for an entire lookback period.
calculate_and_plot_directional_indicators: Computes directional movement indices and determines market conditions like direction, strength, and specific candle types.
Calculations:
• The script calculates the True Range, differences between highs/lows, and computes directional movement indices.
• It then uses these indices to determine the current market direction, strength, and identifies strong bearish candles.
Plotting:
• Plots histograms representing different conditions including negative directional movement in red, positive directional movement in green, continuous strength in yellow, and strong bearish candles in aqua.
Data flows from the calculation of basic price metrics through more complex computations involving sums and comparisons before being plotted according to their respective conditions.
█ CUSTOM FUNCTIONS
count_periods:
Counts how many times a certain condition occurs within a specified number of periods.
every_condition:
Determines whether a particular condition has been met continuously throughout a specified number of periods.
calculate_and_plot_directional_indicators:
This function encompasses multiple tasks including calculating the True Range, Positive/Negative Directional Movements and Indices, determining the market direction, assessing strength via bar continuity since the last change, and identifying strong bearish candles. It returns four arrays containing directional movement, positivity status, continuous strength, and strong bearish candle occurrence respectively.
█ KEY POINTS AND TECHNIQUES
• Utilizes custom functions for modular and reusable code.
• Employs math.sum and ta.barssince for efficient computation of cumulative values and counting bars since a condition was met.
• Uses ternary operators (condition ? value_if_true : value_if_false) extensively for concise conditional assignments.
• Leverages Pine Script’s built-in mathematical functions (math.max, math.min, etc.) for robust financial metric calculations.
• Implements histogram plotting styles to visually represent distinct market states effectively.
█ EXTENDED KNOWLEDGE AND APPLICATIONS
Potential enhancements can involve adding alerts when specific conditions are met, incorporating additional technical indicators, or refining existing logic for better accuracy. This script's approach could be adapted for creating strategies that react to changes in market dynamics identified by these directional indicators. Related topics worth exploring in Pine Script include backtesting frameworks, multi-timeframe analysis, risk management techniques, and integration with external data sources.
Centered Oscillators

Directional Volume IndexDirectional Volume Index (DVI) (buying/selling pressure)
This index is adapted from the Directional Movement Index (DMI), but based on volume instead of price movements. The idea is to detect building directional volume indicating a growing amount of orders that will eventually cause the price to follow. (DVI is not displayed by default)
The rough algorithm for the Positive Directional Volume Index (green bar):
calculate the delta to the previous green bar's volume
if the delta is positive (growing buying pressure) add it to an SMA, else add 0 (also for red bars)
divide these average deltas by the average volume
the result is the Positive Directional Volume Index (DVI+) (vice versa for DVI-)
Differential Directional Volume Index (DDVI) (relative pressure)
Creating the difference of both Directional Volume Indexes (DVI+ - DVI-) creates the Differential Directional Volume Index (DDVI) with rising values indicating a growing buying pressure, falling values a growing selling pressure. (DDVI is displayed by default, smoothed by a custom moving average)
Average Directional Volume Index (ADVX) (pressure strength)
Putting the relative pressure (DDVI) in relation to the total pressure (DVI+ + DVI-) we can determine the strength and duration of the currently building volume change / trend. For the DMI/ADX usually 20 is an indicator for a strong trend, values above 50 suggesting exhaustion and approaching reversals. (ADVX is not displayed by default, smoothed by a custom moving average)
Divergences of the Differential Directional Volume Index (DDVI) (imbalances)
By detecting divergences we can detect situations where e.g. bullish volume starts to build while price is in a downtrend, suggesting that there is growing buying pressure indicating an imminent bullish pullback/order block or reversal. (strong and hidden divergences are displayed by default)
Divergences Overview:
strong bull: higher lows on volume, lower lows on price
medium bull: higher lows on volume, equal lows on price
weak bull: equal lows on volume, lower lows on price
hidden bull: lower lows on volume, higher lows on price
strong bear: lower highs on volume, higher highs on price
medium bear: lower highs on volume, equal highs on price
weak bear: equal highs on volume, higher highs on price
hidden bear: higher highs on volume, lower highs on price
DDVI Bands (dynamic overbought/oversold levels)
Using Bollinger Bands with DDVI as source we receive an averaged relative pressure with stdev band offsets. This can be used as dynamic overbought/oversold levels indicating reversals on sharp crossovers.
Alerts
As of now there are no alerts built in, but all internal data is exposed via plot and plotshape functions, so it can be used for custom crossover conditions in the alert dialog. This is still a personal research project, so if you find good setups, please let me know.

Relative Price Position Flow (RPPF)Market work by short and long players positions. By commodities, players buy or sell positions based in market expectations. The volume of negotiations defines the optimum point to buy or sell. It means how much more volume in a price line, much of the players thinking this is the real value. So, in this indicator I calculate the volume of trades for some price line. And divide it to the total volume, to define whats the historical price line optimum. The diference between the actual price to the historical optimum trade, define some directions of the market. Some times the price is bigger, and sometimes it is smaller.
By experience, after some times the price is deviated to the flow price, it will search a compensation, starting a reversion movement.

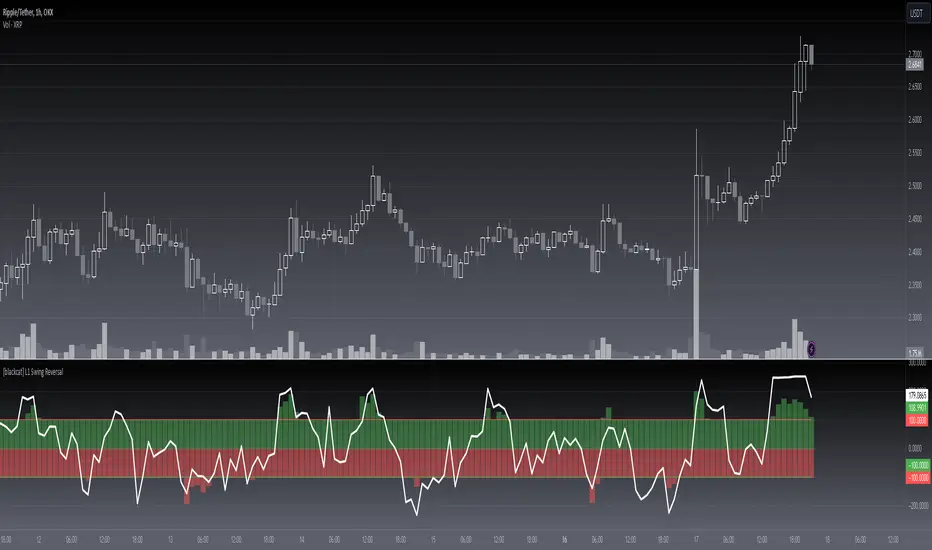
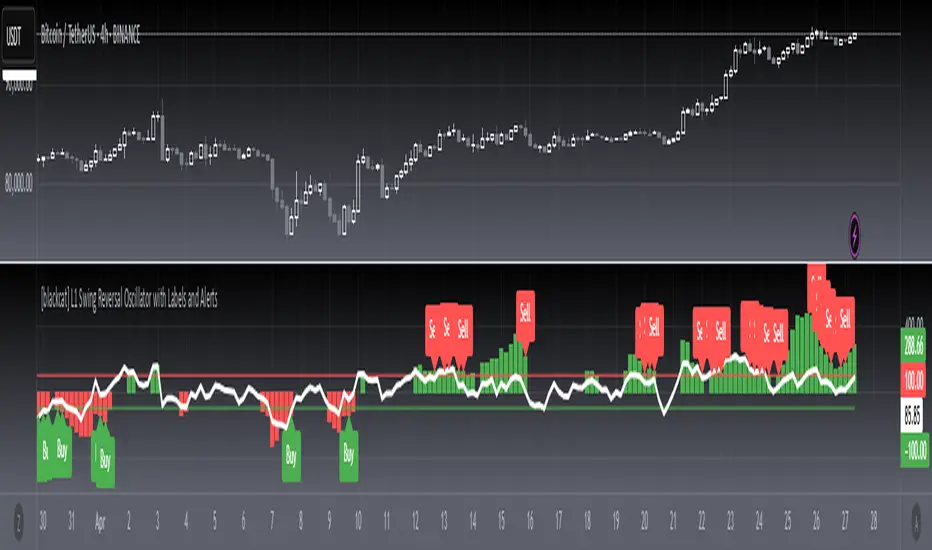
[blackcat] L1 Swing Reversal█ OVERVIEW
The script is an indicator that calculates and plots the L1 Swing Reversal, which involves smoothing price data and calculating a modified RSI to identify potential swing reversals in the market. It overlays columns representing the smoothed price data and a line for the adjusted RSI.
█ LOGICAL FRAMEWORK
The script begins by defining input parameters for customizable periods. It then calculates the typical price, derives components of the swing reversal indicator, smooths these components, and computes an adjusted RSI. The main sections include input parameter definitions, function definition, and plotting. The script flows data through calculations and logical operations to produce final plot values.
█ CUSTOM FUNCTIONS
Function: l1_swing_reversal
This function calculates the L1 Swing Reversal indicators based on high, low, close, and open prices, along with three periods. It computes a smoothed price component and an adjusted RSI.
Parameters:
• high : High prices of the asset.
• low : Low prices of the asset.
• close : Close prices of the asset.
• period_n : Period for the first component calculation.
• period_m : Period for standard deviation and moving average calculations.
• period_n1 : Period for RSI calculation.
Return Values:
• cc1_column_red : Red column values for the first component.
• cc1_column_green : Green column values for the first component.
• rsi : Adjusted RSI values.
█ KEY POINTS AND TECHNIQUES
The script uses several key Pine Script features such as the sma (simple moving average), stdev (standard deviation), max, abs, and ema (exponential moving average) functions. It also demonstrates the use of conditional operators to cap the column values at -100 and 100. The script’s structure is clear and follows best practices by encapsulating the main logic within a function and using descriptive variable names.
█ EXTENDED KNOWLEDGE AND APPLICATIONS
Potential modifications could include adding more sophisticated reversal signals based on the RSI and column values, or enhancing the visualization with additional plot types. This script could be used in scenarios where traders are interested in identifying potential swing reversals using a combination of smoothed price data and momentum indicators. Related Pine Script concepts include using barssince for counting bars since a condition, crossover and crossunder for detecting trend changes, and hline for adding horizontal lines to the chart.
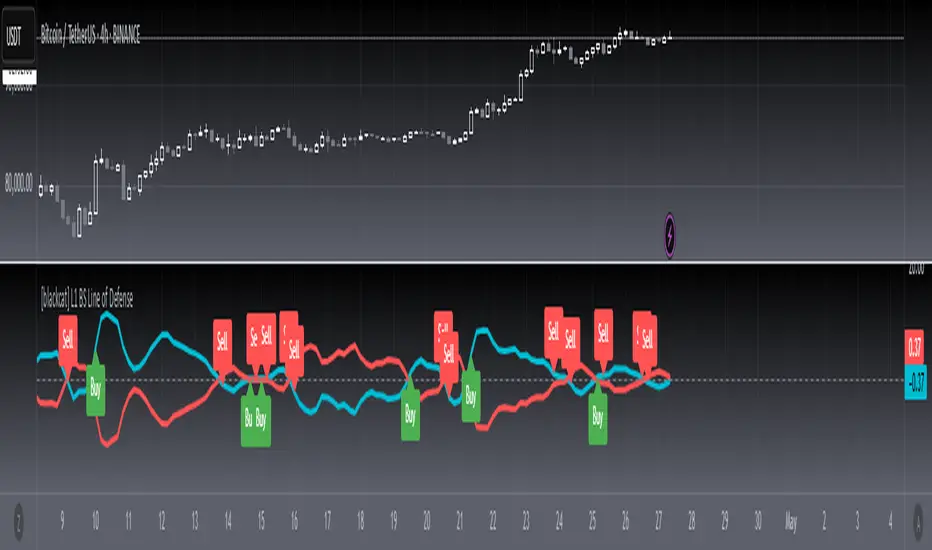
[blackcat] L1 BS Line of Defense █ OVERVIEW
The Pine Script provided is an advanced technical indicator designed to generate reliable buy and sell signals by integrating momentum, moving averages, and price level analyses. It employs a custom weighted moving average (WMA) and exponential moving averages (EMAs) to compute key signals known as the "Buy/Sell Signal" and the "Short Line." These signals aim to pinpoint optimal entry and exit points for trades by evaluating their relationship with current market dynamics.
█ FEATURES
Key Components:
• Custom Weighted Moving Average ( WMA ): Provides enhanced flexibility compared to traditional moving averages.
• Exponential Moving Averages ( EMA ): Smooths the defense line and its short-term counterpart to filter out market noise.
• Momentum Indicators: Includes both short-term and long-term momentum adjusted via custom WMA and EMAs.
• Conditional Signal Generation: Signals are triggered based on precise crossovers and price conditions.
Logical Framework:
1 — Input Parameters:
No explicit user-defined inputs; defaults are used for internal calculations.
2 — Custom Functions:
• custom_wma : Calculates a custom WMA.
• calculate_buy_sell_signals : Generates buy and sell signals.
3 — Calculations:
• Momentum and Range Analysis over 9, 34, and 60-bar periods.
• Application of custom WMA and EMAs to smooth and refine data.
• Derivation of the "defense line" and "short_ema_defense."
4 — Plotting:
• Main signal lines ("Buy/Sell Signal" and "Short Line") are visualized.
• A horizontal zero line serves as a reference point.
█ HOW TO USE
To utilize this script effectively:
1 — Add the script to your TradingView chart.
2 — Observe the "Buy/Sell Signal" and "Short Line" relative to the zero line and each other.
3 — Look for crossovers and divergence patterns to identify potential trade opportunities.
4 — Combine the signals with additional technical indicators or fundamental analysis for better accuracy.
█ LIMITATIONS
While the script provides valuable insights, users should consider the following limitations:
• Default settings may not suit all markets or instruments; customization might be necessary.
• False signals can occur during volatile or ranging markets.
• Backtesting and optimization are recommended before live trading.
█ NOTES
For further enhancement and personalization:
• Introduce adjustable input parameters for WMA and EMA lengths and weights.
• Extend the script into a full-fledged trading strategy with entry and exit rules.
• Apply the script across multiple timeframes for comprehensive analysis.
• Incorporate risk management practices such as stop-loss and take-profit levels.
• Explore related Pine Script functions like security() for multi-timeframe analysis and [pine>alertcondition() for automated alerts.
Understanding core concepts like momentum, moving averages, and crossovers will aid in developing similar indicators or refining existing ones.
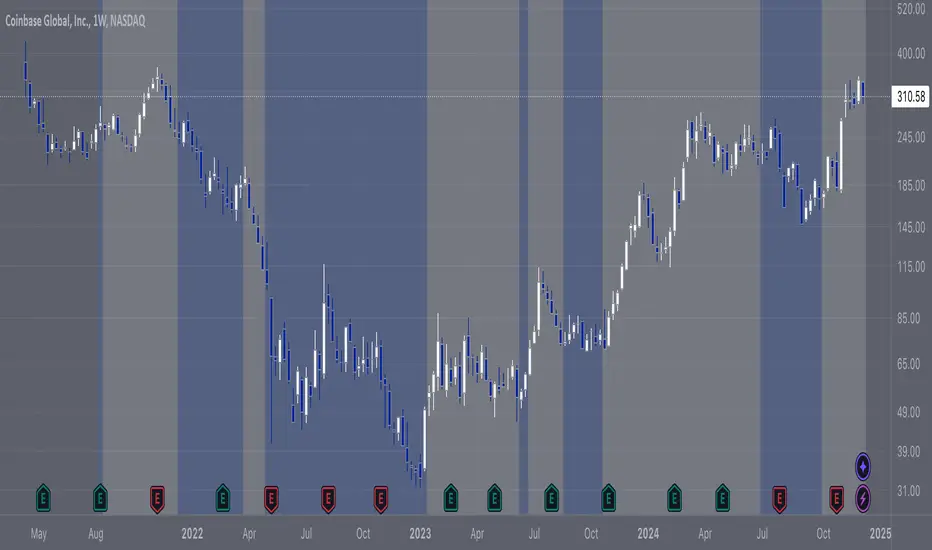
Momentum Matrix (BTC-COIN)The Momentum Matrix (BTC-COIN) indicator analyzes the momentum relationship between Coinbase stock ( NASDAQ:COIN ) and Bitcoin ( CRYPTOCAP:BTC ). By combining RSI, correlation, and dominance metrics, it identifies bullish and bearish macro trends to align trades with market momentum.
How It Works
Price Inputs: Pulls weekly price data for CRYPTOCAP:BTC and NASDAQ:COIN for macro analysis.
Metrics Calculated:
• RSI Divergence: Measures momentum differences between CRYPTOCAP:BTC and $COIN.
• Price Ratio: Tracks the $COIN/ CRYPTOCAP:BTC relationship relative to its long-term average (SMA).
• Correlation: Analyzes price co-movement between CRYPTOCAP:BTC and $COIN.
• Dominance Impact: Incorporates CRYPTOCAP:BTC dominance for broader crypto trends.
Composite Momentum Score: Combines these metrics into a smoothed macro momentum value.
Thresholds for Trend Detection: Upper and lower thresholds dynamically adapt to market conditions.
Signals and Visualization:
• Buy Signal: Momentum exceeds the upper threshold, indicating bullish trends.
• Sell Signal: Momentum falls below the lower threshold, indicating bearish trends.
• Background Colors: Green (bullish), Red (bearish).
Strengths
Integrates multiple metrics for robust macro analysis.
Dynamic thresholds adapt to market conditions.
Effective for identifying macro momentum shifts.
Limitations
Lag in high volatility due to smoothing.
Less effective in choppy, sideways markets.
Assumes CRYPTOCAP:BTC dominance drives NASDAQ:COIN momentum, which may not always hold true.
Improvements
Multi-Timeframe Analysis: Add daily or monthly data for precision.
Volume Filters: Include volume thresholds for signal validation.
Additional Metrics: Consider MACD or Stochastics for further confirmation.
Complementary Tools
Volume Indicators: OBV or cumulative delta for confirmation.
Trend-Following Systems: Pair with moving averages for timing.
Market Breadth Metrics: Combine with CRYPTOCAP:BTC dominance trends for context.

COIN/BTC Trend OscillatorThe COIN/BTC Trend Oscillator is a versatile tool designed to measure and visualize momentum divergences between Coinbase stock ( NASDAQ:COIN ) and Bitcoin ( CRYPTOCAP:BTC ). It helps identify overbought and oversold conditions, while also highlighting potential trend reversals.
Key Features:
VWAP-Based Divergence Analysis:
• Tracks the difference between NASDAQ:COIN and CRYPTOCAP:BTC relative to their respective VWAPs.
• Highlights shifts in momentum between the two assets.
Normalized Oscillator:
• Uses ATR normalization to adapt to different volatility conditions.
• Displays momentum shifts on a standardized scale for better comparability.
Overbought and Oversold Conditions:
• Identifies extremes using customizable thresholds (default: ±80).
• Dynamic background colors for quick visual identification:
• Blue for overbought zones (potential sell).
• White for oversold zones (potential buy).
Rolling Highs and Lows Detection:
• Tracks turning points in the oscillator to identify possible trend reversals.
• Useful for spotting exhaustion or accumulation phases.
Use Case:
This indicator is ideal for trading Coinbase stock relative to Bitcoin’s momentum. It’s especially useful during strong market trends, helping traders time entries and exits based on extremes in relative performance.
Limitations:
• Performance may degrade in choppy or sideways markets.
• Assumes a strong correlation between NASDAQ:COIN and CRYPTOCAP:BTC , which may not hold during independent events.
Pro Tip: Use this oscillator with broader trend confirmation tools like moving averages or RSI to improve reliability. For macro strategies, consider combining with higher timeframes for alignment.
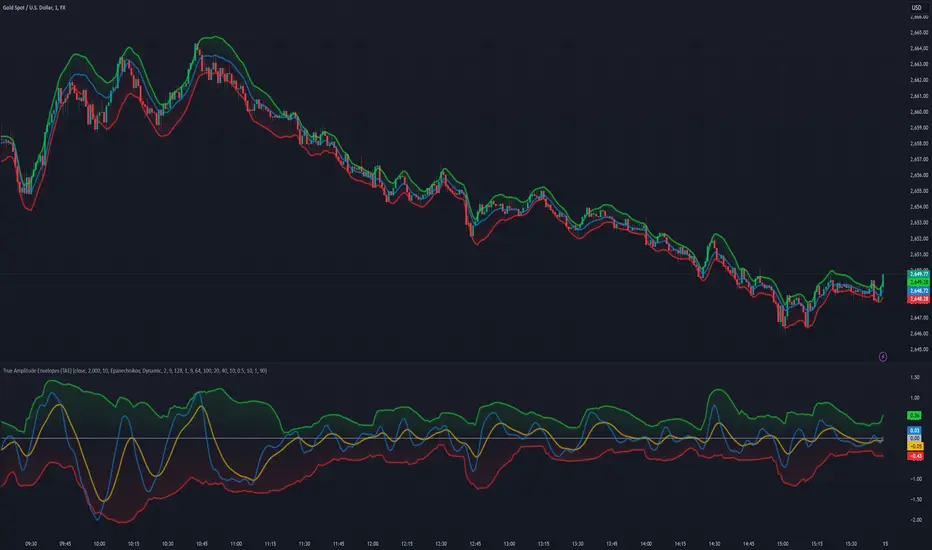
True Amplitude Envelopes (TAE)The True Envelopes indicator is an adaptation of the True Amplitude Envelope (TAE) method, based on the research paper " Improved Estimation of the Amplitude Envelope of Time Domain Signals Using True Envelope Cepstral Smoothing " by Caetano and Rodet. This indicator aims to create an asymmetric price envelope with strong predictive power, closely following the methodology outlined in the paper.
Due to the inherent limitations of Pine Script, the indicator utilizes a Kernel Density Estimator (KDE) in place of the original Cepstral Smoothing technique described in the paper. While this approach was chosen out of necessity rather than superiority, the resulting method is designed to be as effective as possible within the constraints of the Pine environment.
This indicator is ideal for traders seeking an advanced tool to analyze price dynamics, offering insights into potential price movements while working within the practical constraints of Pine Script. Whether used in dynamic mode or with a static setting, the True Envelopes indicator helps in identifying key support and resistance levels, making it a valuable asset in any trading strategy.
Key Features:
Dynamic Mode: The indicator dynamically estimates the fundamental frequency of the price, optimizing the envelope generation process in real-time to capture critical price movements.
High-Pass Filtering: Uses a high-pass filtered signal to identify and smoothly interpolate price peaks, ensuring that the envelope accurately reflects significant price changes.
Kernel Density Estimation: Although implemented as a workaround, the KDE technique allows for flexible and adaptive smoothing of the envelope, aimed at achieving results comparable to the more sophisticated methods described in the original research.
Symmetric and Asymmetric Envelopes: Provides options to select between symmetric and asymmetric envelopes, accommodating various trading strategies and market conditions.
Smoothness Control: Features adjustable smoothness settings, enabling users to balance between responsiveness and the overall smoothness of the envelopes.
The True Envelopes indicator comes with a variety of input settings that allow traders to customize the behavior of the envelopes to match their specific trading needs and market conditions. Understanding each of these settings is crucial for optimizing the indicator's performance.
Main Settings
Source: This is the data series on which the indicator is applied, typically the closing price (close). You can select other price data like open, high, low, or a custom series to base the envelope calculations.
History: This setting determines how much historical data the indicator should consider when calculating the envelopes. A value of 0 will make the indicator process all available data, while a higher value restricts it to the most recent n bars. This can be useful for reducing the computational load or focusing the analysis on recent market behavior.
Iterations: This parameter controls the number of iterations used in the envelope generation algorithm. More iterations will typically result in a smoother envelope, but can also increase computation time. The optimal number of iterations depends on the desired balance between smoothness and responsiveness.
Kernel Style: The smoothing kernel used in the Kernel Density Estimator (KDE). Available options include Sinc, Gaussian, Epanechnikov, Logistic, and Triangular. Each kernel has different properties, affecting how the smoothing is applied. For example, Gaussian provides a smooth, bell-shaped curve, while Epanechnikov is more efficient computationally with a parabolic shape.
Envelope Style: This setting determines whether the envelope should be Static or Dynamic. The Static mode applies a fixed period for the envelope, while the Dynamic mode automatically adjusts the period based on the fundamental frequency of the price data. Dynamic mode is typically more responsive to changing market conditions.
High Q: This option controls the quality factor (Q) of the high-pass filter. Enabling this will increase the Q factor, leading to a sharper cutoff and more precise isolation of high-frequency components, which can help in better identifying significant price peaks.
Symmetric: This setting allows you to choose between symmetric and asymmetric envelopes. Symmetric envelopes maintain an equal distance from the central price line on both sides, while asymmetric envelopes can adjust differently above and below the price line, which might better capture market conditions where upside and downside volatility are not equal.
Smooth Envelopes: When enabled, this setting applies additional smoothing to the envelopes. While this can reduce noise and make the envelopes more visually appealing, it may also decrease their responsiveness to sudden market changes.
Dynamic Settings
Extra Detrend: This setting toggles an additional high-pass filter that can be applied when using a long filter period. The purpose is to further detrend the data, ensuring that the envelope focuses solely on the most recent price oscillations.
Filter Period Multiplier: This multiplier adjusts the period of the high-pass filter dynamically based on the detected fundamental frequency. Increasing this multiplier will lengthen the period, making the filter less sensitive to short-term price fluctuations.
Filter Period (Min) and Filter Period (Max): These settings define the minimum and maximum bounds for the high-pass filter period. They ensure that the filter period stays within a reasonable range, preventing it from becoming too short (and overly sensitive) or too long (and too sluggish).
Envelope Period Multiplier: Similar to the filter period multiplier, this adjusts the period for the envelope generation. It scales the period dynamically to match the detected price cycles, allowing for more precise envelope adjustments.
Envelope Period (Min) and Envelope Period (Max): These settings establish the minimum and maximum bounds for the envelope period, ensuring the envelopes remain adaptive without becoming too reactive or too slow.
Static Settings
Filter Period: In static mode, this setting determines the fixed period for the high-pass filter. A shorter period will make the filter more responsive to price changes, while a longer period will smooth out more of the price data.
Envelope Period: This setting specifies the fixed period used for generating the envelopes in static mode. It directly influences how tightly or loosely the envelopes follow the price action.
TAE Smoothing: This controls the degree of smoothing applied during the TAE process in static mode. Higher smoothing values result in more gradual envelope curves, which can be useful in reducing noise but may also delay the envelope’s response to rapid price movements.
Visual Settings
Top Band Color: This setting allows you to choose the color for the upper band of the envelope. This band represents the resistance level in the price action.
Bottom Band Color: Similar to the top band color, this setting controls the color of the lower band, which represents the support level.
Center Line Color: This is the color of the central price line, often referred to as the carrier. It represents the detrended price around which the envelopes are constructed.
Line Width: This determines the thickness of the plotted lines for the top band, bottom band, and center line. Thicker lines can make the envelopes more visible, especially when overlaid on price data.
Fill Alpha: This controls the transparency level of the shaded area between the top and bottom bands. A lower alpha value will make the fill more transparent, while a higher value will make it more opaque, helping to highlight the envelope more clearly.
The envelopes generated by the True Envelopes indicator are designed to provide a more precise and responsive representation of price action compared to traditional methods like Bollinger Bands or Keltner Channels. The core idea behind this indicator is to create a price envelope that smoothly interpolates the significant peaks in price action, offering a more accurate depiction of support and resistance levels.
One of the critical aspects of this approach is the use of a high-pass filtered signal to identify these peaks. The high-pass filter serves as an effective method of detrending the price data, isolating the rapid fluctuations in price that are often lost in standard trend-following indicators. By filtering out the lower frequency components (i.e., the trend), the high-pass filter reveals the underlying oscillations in the price, which correspond to significant peaks and troughs. These oscillations are crucial for accurately constructing the envelope, as they represent the most responsive elements of the price movement.
The algorithm works by first applying the high-pass filter to the source price data, effectively detrending the series and isolating the high-frequency price changes. This filtered signal is then used to estimate the fundamental frequency of the price movement, which is essential for dynamically adjusting the envelope to current market conditions. By focusing on the peaks identified in the high-pass filtered signal, the algorithm generates an envelope that is both smooth and adaptive, closely following the most significant price changes without overfitting to transient noise.
Compared to traditional envelopes and bands, such as Bollinger Bands and Keltner Channels, the True Envelopes indicator offers several advantages. Bollinger Bands, which are based on standard deviations, and Keltner Channels, which use the average true range (ATR), both tend to react to price volatility but do not necessarily follow the peaks and troughs of the price with precision. As a result, these traditional methods can sometimes lag behind or fail to capture sudden shifts in price momentum, leading to either false signals or missed opportunities.
In contrast, the True Envelopes indicator, by using a high-pass filtered signal and a dynamic period estimation, adapts more quickly to changes in price behavior. The envelopes generated by this method are less prone to the lag that often affects standard deviation or ATR-based bands, and they provide a more accurate representation of the price's immediate oscillations. This can result in better predictive power and more reliable identification of support and resistance levels, making the True Envelopes indicator a valuable tool for traders looking for a more responsive and precise approach to market analysis.
In conclusion, the True Envelopes indicator is a powerful tool that blends advanced theoretical concepts with practical implementation, offering traders a precise and responsive way to analyze price dynamics. By adapting the True Amplitude Envelope (TAE) method through the use of a Kernel Density Estimator (KDE) and high-pass filtering, this indicator effectively captures the most significant price movements, providing a more accurate depiction of support and resistance levels compared to traditional methods like Bollinger Bands and Keltner Channels. The flexible settings allow for extensive customization, ensuring the indicator can be tailored to suit various trading strategies and market conditions.
MACD Aggressive Scalp SimpleComment on the Script
Purpose and Structure:
The script is a scalping strategy based on the MACD indicator combined with EMA (50) as a trend filter.
It uses the MACD histogram's crossover/crossunder of zero to trigger entries and exits, allowing the trader to capitalize on short-term momentum shifts.
The use of strategy.close ensures that positions are closed when specified conditions are met, although adjustments were made to align with Pine Script version 6.
Strengths:
Simplicity and Clarity: The logic is straightforward and focuses on essential scalping principles (momentum-based entries and exits).
Visual Indicators: The plotted MACD line, signal line, and histogram columns provide clear visual feedback for the strategy's operation.
Trend Confirmation: Incorporating the EMA(50) as a trend filter helps avoid trades that go against the prevailing trend, reducing the likelihood of false signals.
Dynamic Exit Conditions: The conditional logic for closing positions based on weakening momentum (via MACD histogram change) is a good way to protect profits or minimize losses.
Potential Improvements:
Parameter Inputs:
Make the MACD (12, 26, 9) and EMA(50) values adjustable by the user through input statements for better customization during backtesting.
Example:
pine
Copy code
macdFast = input(12, title="MACD Fast Length")
macdSlow = input(26, title="MACD Slow Length")
macdSignal = input(9, title="MACD Signal Line Length")
emaLength = input(50, title="EMA Length")
Stop Loss and Take Profit:
The strategy currently lacks explicit stop-loss or take-profit levels, which are critical in a scalping strategy to manage risk and lock in profits.
ATR-based or fixed-percentage exits could be added for better control.
Position Size and Risk Management:
While the script uses 50% of equity per trade, additional options (e.g., fixed position sizes or risk-adjusted sizes) would be beneficial for flexibility.
Avoid Overlapping Signals:
Add logic to prevent overlapping signals (e.g., opening a new position immediately after closing one on the same bar).
Backtesting Optimization:
Consider adding labels or markers (label.new or plotshape) to visualize entry and exit points on the chart for better debugging and analysis.
The inclusion of performance metrics like max drawdown, Sharpe ratio, or profit factor would help assess the strategy's robustness during backtesting.
Compatibility with Live Trading:
The strategy could be further enhanced with alert conditions using alertcondition to notify the trader of buy/sell signals in real-time.

[blackcat]L3 Strong Power Wave █ OVERVIEW
The script is an indicator named ' L3 Strong Power Wave' (SPW) designed to identify buy and sell signals based on the contraction and expansion of candlestick patterns. It calculates various indicators and plots them on a separate chart panel. The main purpose is to detect when candlestick patterns transition from contracting to expanding (buy signal) and from expanding to contracting (sell signal).
█ LOGICAL FRAMEWORK
The script is structured into several key sections:
Input Parameters and Initialization: The script uses indicator() to define the title, short title, and other properties.
Custom Functions: Several custom functions are defined for calculations, including calculate_weighted_moving_average, calculate_spw_variation, and calculate_strong_power_wave.
Calculations: The script performs complex calculations for the SPW indicators using multiple ta.alma and ta.sma functions.
Plotting: The indicators are plotted on the chart using plot().
Signal Detection: The script detects buy and sell signals based on changes in candlestick sizes.
Labeling: Buy and sell signals are indicated on the chart using label.new().
The flow of data and logic involves first calculating the SPW indicators, then plotting them, and finally detecting and labeling the buy and sell signals based on candlestick pattern changes.
█ CUSTOM FUNCTIONS
1 — calculate_weighted_moving_average(src, length, weight) :
• Purpose: Calculates a weighted moving average of the source data.
• Parameters: src (source data), length (period length), weight (weighting factor).
• Return Value: Weighted moving average value.
2 — calculate_spw_variation(base, multiplier) :
• Purpose: Computes a variation of the base value using a simple moving average and a multiplier.
• Parameters: base (base value), multiplier (multiplier factor).
• Return Value: Calculated variation value.
3 — calculate_strong_power_wave(src) :
• Purpose: Calculates multiple SPW indicators including various ta.alma and ta.sma values.
• Parameters: src (source data, typically close).
• Return Value: A tuple containing calculated SPW indicators.
█ KEY POINTS AND TECHNIQUES
• Weighted Moving Average: The script uses a custom function to calculate a weighted moving average, which can provide more emphasis on recent data points.
• Exponential Moving Averages (ALMA): The script uses ta.alma to smooth data, which is useful for identifying trends.
• Custom Indicators: The script defines and uses multiple custom indicators, demonstrating how to create and integrate complex calculations.
• Signal Detection: The script uses logical conditions to detect buy and sell signals based on candlestick pattern changes, showcasing practical application of technical analysis concepts.
• Labeling: The use of label.new() to mark buy and sell signals provides clear visual cues on the chart.
█ EXTENDED KNOWLEDGE AND APPLICATIONS
• Enhancements: The script could be enhanced by adding additional filters or parameters to refine signal accuracy.
• Backtesting: Implementing backtesting to evaluate the effectiveness of the buy and sell signals.
• Optimization: Optimizing the parameters of the moving averages and multipliers to better suit different market conditions.
• Alternative Indicators: Exploring other indicators that could complement or replace the SPW indicators.
• Related Concepts: Understanding the principles of candlestick pattern analysis and how they can be integrated into Pine Script.

[blackcat] L1 Swing Reversal Oscillator█ OVERVIEW
The script defines a custom indicator called the "L1 Swing Reversal Oscillator," which integrates moving averages and RSI to detect possible swing reversals in market trends. Its core purpose is to produce signals derived from the oscillator's indications of overbought or oversold states.
█ LOGICAL FRAMEWORK
The script comprises multiple key segments:
1 — Custom Functions: Encompasses calculate_weighted_moving_average and calculate_l1_swing_reversal_oscillator.
2 — Input Parameters: Permits customization of moving average lengths and weights alongside RSI settings.
3 — Calculations: Employs predefined functions to determine oscillator readings.
4 — Plot Statements: Depicts oscillator outputs graphically on the chart.
Data processing follows this sequence: initial computation of the typical price, subsequent derivation of the adjusted CC1 metric, additional smoothing operations, and finally, RSI evaluation prior to plotting the resultant oscillator figures.
█ CUSTOM FUNCTIONS
• calculate_weighted_moving_average(source, length, weight) : Generates a weighted moving average from the provided source material utilizing specified duration and coefficient inputs.
– Returns computed weighted moving average.
• calculate_l1_swing_reversal_oscillator(close_price, high_price, low_price, sma_length, sma_weight, rsi_length) : Assesses the L1 Swing Reversal Oscillator leveraging closing, highest, and lowest prices along with defined SMA span, weighting factor, and RSI period.
– Yields an array featuring central CC1, CB1, CB2, and RSI metrics.
█ KEY POINTS AND TECHNIQUES
• Weighted Moving Average: Incorporates bespoke functionality for computing weighted moving averages, distinct from built-in Pine Script methods.
• RSI Calculation: Employs customized logic for calculating Relative Strength Index, offering adaptable computational approaches.
• Plotting Techniques: Implements color coding contingent upon oscillator values to emphasize visual cues regarding overbought and oversold statuses.
• Optimization: Furnishes adjustable parameters including SMA timeframe, weightage, and RSI interval enabling personalized fine-tuning per user requirements.
█ EXTENDED KNOWLEDGE AND APPLICATIONS
• Modifications: Potential enhancements involve integrating supplementary oscillators like MACD or Stochastic Oscillator alongside the existing L1 Swing Reversal Oscillator.
• Application Scenarios: Comparable methodologies can be adopted within various trading frameworks focusing on momentum shifts such as trend-following or mean reversion tactics.
• Related Concepts: Proficiency in crafting custom functions, manipulating moving averages, and interpreting RSI within Pine Script environment proves advantageous when altering or expanding on current script functionalities. Understanding utilization of nz and na functions for managing null data points adds significant depth.
Super Oscillator with Alerts by BigBlueCheeseSuper Oscillator with Alerts (by BigBlueCheese)
I got sick of eyeballing multiple oscillators generating output on different scales and interpreting them on the fly, so I picked 4 of my favs, 2 fisher transforms (fast & slow) The Squeeze & my own Market Rhythm Oscillator & made the Super Oscillator with Alerts which combines multiple indicators and oscillators to analyze market conditions and generate actionable trading signals.
The output is buy/sell/neutral signals and a color coded table summarizing indicator states (strong buy to strong sell etc). The color legend can be disabled once you get used to the color codes. The user can choose to watch the table output and its changing output, OR unclutter their screen by toggling the table off & just watching for the signals SO+ (buy), SO-(sell), SO?(neutral)
The combined signals are run through a scoring and weighting scheme that utilizes each indicators Z-scores, Min-Max normalization, and raw values which are all used in different parts of the scoring process.
A velocity filter (for more immediate/sensitive response) is available for the user to toggle on/off. The raw indicator values are classified into categories reflecting their current strength and are assigned momentum points.
Z-scores measure how far each oscillator's current value deviates from its mean in terms of standard deviations. Basically, the Z-scores focus on relative behavior, while momentum captures directional trends. Together, they provide a more nuanced view of market conditions. Large Z-scores increase the likelihood of stronger signals. The idea is to are amplify influence in extreme conditions whereas low Z scores will have minimal impact on the cumulative score, making signals less prone to noise.
Inputs and Their Contributions
1. Momentum: Controlled by the raw oscillator values and thresholds.
2. Min-Max: Automatically calculated based on the historical range of oscillators.
3. Velocity: Input: useVelocity (true/false) toggle. Weights: User-defined weights for velocity contribution.
4. Z-Score: Input: useZScore (true/false) toggle. Weights: User-defined weights for Z-score contribution.
The system combines momentum, Min-Max normalization, (and if enabled) velocity, and Z-scores, to generate dynamic and actionable trading signals that appear as markers on the chart indicating buy, sell, and neutral signals.
Alerts can also be triggered based on these signals.
Users can customize the weighting and inclusion of velocity and Z-scores to align the scoring system with their trading strategy and preferences.
If there is enough interest for some other preferred oscillator, I will substitute it for out my Market Rhythm Oscillator & republish with the code. LMK
For the curious out there, the Market Rhythm Oscillator (MRO) is a custom oscillator that analyzes price dynamics using a combination of weighted volatility-based calculations. It helps measure price momentum and potential exhaustion levels by identifying high and low volatility regions.
• Purpose: The MRO is particularly effective at identifying market trends and potential reversals by analyzing price extremes and their behavior over a defined lookback period.
• Calculation Components might include:
o Waveform Volatility Factor (WVF): Measures the price's deviation from its highest or lowest values within a given period.
o Bands and Smoothing:
Upper and lower bands based on standard deviations of WVF.
Smoothing is applied to the WVF for better trend clarity.
o Exhaustion Levels: Uses the MRO's trend length to calculate when the price action may become overextended.
Happy hunting but as always, not a trade recommendation, past results not indicative of future results, DYOR!

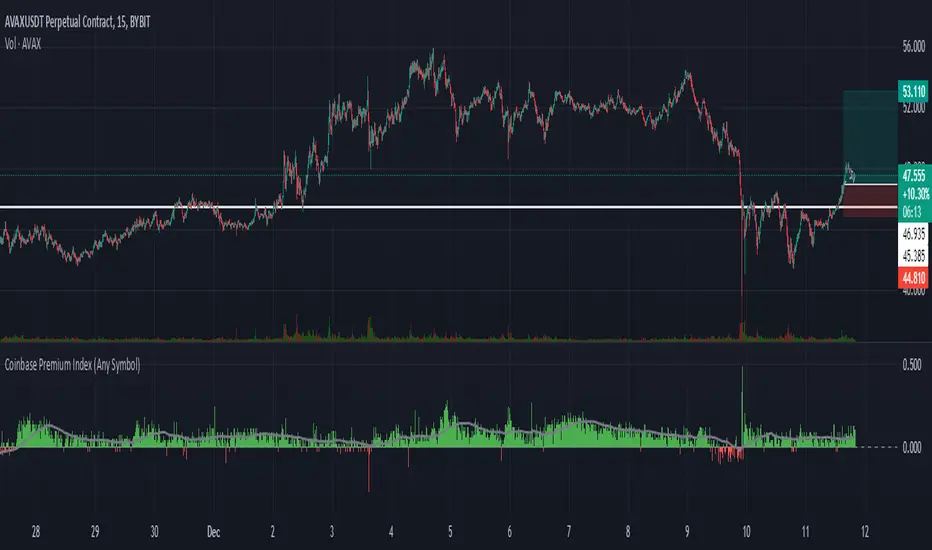
Coinbase Premium Index (Any Symbol)The Coinbase Premium Index provides a valuable insight into market dynamics by calculating the price premium between Coinbase (USD pairs) and Binance (USDT pairs). A positive premium typically indicates heavy buying pressure on Coinbase, often coinciding with upward price trends on lower timeframes. Conversely, a negative premium suggests selling pressure or weaker demand on Coinbase compared to Binance.
** Key Features: **
**Dynamic Symbol Detection**: Automatically detects the current chart symbol and adapts the premium calculation accordingly.
**Customizable Moving Averages**:
Select between SMA (Simple Moving Average) or EMA (Exponential Moving Average).
Adjust the moving average period to suit your trading strategy (default: SMA with 50 periods).
**Error Handling for Missing Data**:
Displays "Symbol not on Coinbase" when the cryptocurrency is unavailable on Coinbase.
Plots zero-value columns in light grey for unsupported symbols.
**Visual Representation**:
Premium values are displayed as columns: green for positive premiums, red for negative premiums.
A moving average line in light grey helps highlight trends.
Zero Line: A horizontal dashed line is included as a reference point.
** Why Use This Script?**
The Coinbase Premium Index helps traders identify moments of increased buying pressure among U.S. investors, often indicative of bullish momentum on lower timeframes. Use this tool to monitor premium dynamics and gain a clearer understanding of market sentiment across major exchanges.
** How to Use: **
Add this script to your TradingView chart.
Adjust the moving average type and period through the input menu.
Use the premium columns and moving averages to identify potential price trends and validate exchange-specific trading opportunities.
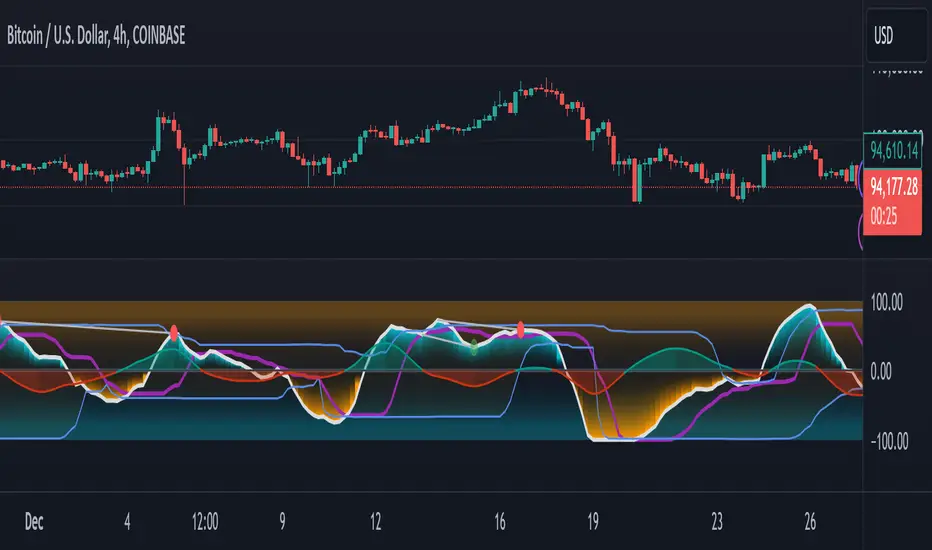
GMO (Gyroscopic Momentum Oscillator) GMO
Overview
This indicator fuses multiple advanced concepts to give traders a comprehensive view of market momentum, volatility, and potential turning points. It leverages the Gyroscopic Momentum Oscillator (GMO) foundation and layers on IQR-based bands, dynamic ATR-adjusted OB/OS levels, torque filtering, and divergence detection. The outcome is a versatile tool that can assist in identifying both short-term squeezes and long-term reversal zones while detecting subtle shifts in momentum acceleration.
Key Components:
Gyroscopic Momentum Oscillator (GMO) – A physics-inspired metric capturing trend stability and momentum by treating price dynamics as “angle,” “angular velocity,” and “inertia.”
IQR Bands – Highlight statistically typical oscillation ranges, providing insight into short-term squeezes and potential near-term trend shifts.
ATR-Adjusted OB/OS Levels – Dynamic thresholds for overbought/oversold conditions, adapting to volatility, aiding in identifying long-term potential reversal zones.
Torque Filtering & Scaling – Smooths and thresholds torque (the rate of change of momentum) and visually scales it for clarity, indicating sudden force changes that may precede volatility adjustments.
Divergence Detection – Highlights potential reversal cues by comparing oscillator swings against price swings, revealing regular and hidden bullish/bearish divergences.
Conceptual Insights
IQR Bands (Short-Term Squeeze & Trend Direction):
Short-Term Momentum and Squeeze: The IQR (Interquartile Range) bands show where the oscillator tends to “live” statistically. When the GMO line hovers within compressed IQR bands, it can signal a momentum squeeze phase. Exiting these tight ranges often correlates with short-term breakout opportunities.
Trend Reversals: If the oscillator pushes beyond these IQR ranges, it may indicate an emerging short-term trend change. Traders can watch for GMO escaping the IQR “comfort zone” to anticipate a new directional move.
Dynamic OB/OS Levels (Long-Term Reversal Zones):
ATR-Based Adaptive Thresholds: Instead of static overbought/oversold lines, this tool uses ATR to adjust OB/OS boundaries. In calm markets, these lines remain closer to ±90. As volatility rises, they approach ±100, reflecting greater permissible swings.
Long-Term Trend Reversal Potential: If GMO hits these dynamically adjusted OB/OS extremes, it suggests conditions ripe for possible long-term trend reversals. Traders seeking major inflection points may find these adaptive levels more reliable than fixed thresholds.
Torque (Sudden Force & Directional Shifts):
Momentum Acceleration Insight: Torque represents the second derivative of momentum, highlighting how quickly momentum is changing. High positive torque suggests a rapidly strengthening bullish force, while high negative torque warns of sudden bearish pressure.
Early Warning & Stability/Volatility Adjustments: By monitoring torque spikes, traders can anticipate momentum shifts before price fully confirms them. This can signal imminent changes in stability or increased volatility phases.
Indicator Parameters and Usage
GMO-Related Inputs:
lenPivot (Default 100): Length for calculating the pivot line (slow market axis).
lenSmoothAngle (Default 200): Smooths the angle measure, reducing noise.
lenATR (Default 14): ATR period for scaling factor, linking price changes to volatility.
useVolatility (Default true): If true, volatility (ATR) influences inertia, adjusting momentum calculations.
useVolume (Default false): If true, volume affects inertia, adding a liquidity dimension to momentum.
lenVolSmoothing (Default 50): Smooths volume calculations if useVolume is enabled.
lenMomentumSmooth (Default 20): EMA smoothing of GMO for a cleaner oscillator line.
normalizeRange (Default true): Normalizes GMO to a fixed range for consistent interpretation.
lenNorm (Default 100): Length for normalization window, ensuring GMO’s scale adapts to recent extremes.
IQR Bands Settings:
iqrLength (Default 14): Period to compute the oscillator’s statistical IQR.
iqrMult (Default 1.5): Multiplier to define the upper and lower IQR-based bands.
ATR-Adjusted OB/OS Settings:
baseOBLevel (Fixed at 90) and baseOSLevel (Fixed at 90): Base lines for OB/OS.
atrPeriodForOBOS (Default 50): ATR length for adjusting OB/OS thresholds dynamically.
atrScaling (Default 0.2): Controls how strongly volatility affects OB/OS lines.
Torque Filtering & Visualization:
torqueSmoothLength (Default 10): EMA length to smooth raw torque values.
atrPeriodForTorque (Default 14): ATR period to determine torque threshold.
atrTorqueScaling (Default 0.5): Scales ATR for determining torque’s “significant” threshold.
torqueScaleFactor (Default 10.0): Multiplies the torque values for better visual prominence on the chart.
Divergence Inputs:
showDivergences (Default true): Toggles divergence signals.
lbR, lbL (Defaults 5): Pivot lookback periods to identify swing highs and lows.
rangeUpper, rangeLower: Bar constraints to validate potential divergences.
plotBull, plotHiddenBull, plotBear, plotHiddenBear: Toggles for each divergence type.
Visual Elements on the Chart
GMO Line (Blue) & Zero Line (Gray):
GMO line oscillates around zero. Positive territory hints bullish momentum, negative suggests bearish.
IQR Bands (Teal Lines & Yellow Fill):
Upper/lower bands form a statistical “normal range” for GMO. The median line (purple) provides a central reference. Contraction near these bands indicates a short-term squeeze, expansions beyond them can signal emerging short-term trend changes.
Dynamic OB/OS (Red & Green Lines):
Red line near +90 to +100: Overbought zone (dynamic).
Green line near -90 to -100: Oversold zone (dynamic).
Movement into these zones may mark significant, longer-term reversal potential.
Torque Histogram (Colored Bars):
Plotted below GMO. Green bars = torque above positive threshold (bullish acceleration).
Red bars = torque below negative threshold (bearish acceleration).
Gray bars = neutral range.
This provides early warnings of momentum shifts before price responds fully.
Precession (Orange Line):
Scaled for visibility, adds context to long-term angular shifts in the oscillator.
Divergence Signals (Shapes):
Circles and offset lines highlight regular or hidden bullish/bearish divergences, offering potential reversal signals.
Practical Interpretation & Strategy
Short-Term Opportunities (IQR Focus):
If GMO compresses within IQR bands, the market might be “winding up.” A break above/below these bands can signal a short-term trade opportunity.
Long-Term Reversal Zones (Dynamic OB/OS):
When GMO approaches these dynamically adjusted extremes, conditions may be ripe for a major trend shift. This is particularly useful for swing or position traders looking for significant turnarounds.
Monitoring Torque for Acceleration Cues:
Torque spikes can precede price action, serving as an early catalyst signal. If torque turns strongly positive, anticipate bullish acceleration; strongly negative torque may warn of upcoming bearish pressure.
Confirm with Divergences:
Divergences between price and GMO reinforce potential reversal or continuation signals identified by IQR, OB/OS, or torque. Use them to increase confidence in setups.
Tips and Best Practices
Combine with Price & Volume Action:
While the indicator is powerful, always confirm signals with actual price structure, volume patterns, or other trend-following tools.
Adjust Lengths & Periods as Needed:
Shorter lengths = more responsiveness but more noise. Longer lengths = smoother signals but greater lag. Tune parameters to match your trading style and timeframe.
Use ATR and Volume Settings Wisely:
If markets are highly volatile, consider useVolatility to refine momentum readings. If liquidity is key, enable useVolume.
Scaling Torque:
If torque bars are hard to read, increase torqueScaleFactor further. The scaling doesn’t affect logic—only visibility.
Conclusion
The “GMO + IQR Bands + ATR-Adjusted OB/OS + Torque Filtering (Scaled)” indicator presents a holistic framework for understanding market momentum across multiple timescales and conditions. By interpreting short-term squeezes via IQR bands, long-term reversal zones via adaptive OB/OS, and subtle acceleration changes through torque, traders can gain advanced insights into when to anticipate breakouts, manage risk around potential reversals, and fine-tune timing for entries and exits.
This integrated approach helps navigate complex market dynamics, making it a valuable addition to any technical analysis toolkit.
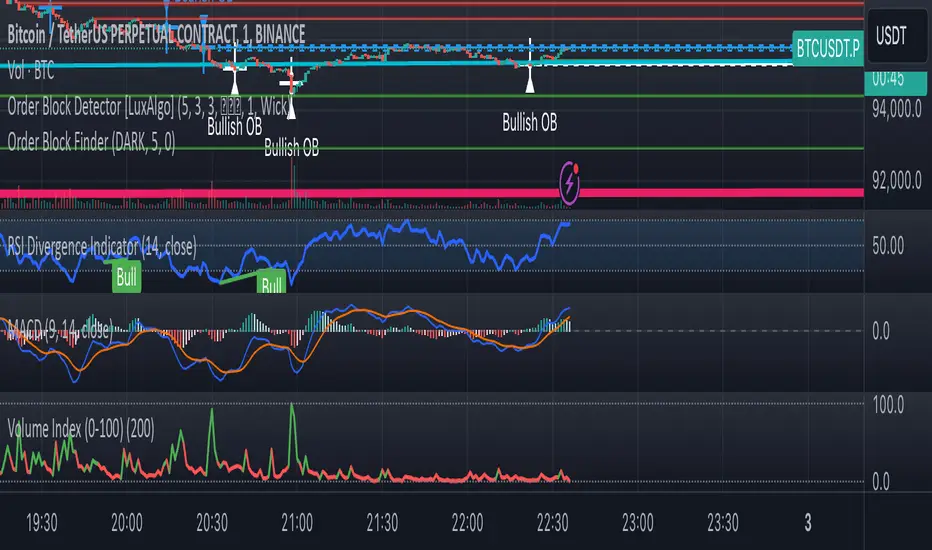
Volume Index (0-100)Volume Index (0-100) Indicator
The Volume Index (0-100) indicator is a powerful tool designed to help traders understand current volume levels in relation to past activity over a specified period. By normalizing volume data to a scale from 0 to 100, this indicator makes it easy to compare today's volume against recent history and gauge the strength of market movements.
Key Features:
Normalized Volume Index: The indicator indexes volume between 0 and 100, allowing traders to easily determine if the current volume is unusually high or low compared to recent trends.
Colored Visualization: The line graph is colored green for positive volume (increasing activity) and red for negative volume (decreasing activity). This helps traders quickly grasp the market sentiment and volume direction.
User-Defined Lookback Period: Traders can customize the lookback period to best fit their trading strategy, providing flexibility for different market conditions.
How Traders Can Use It:
Identifying Volume Extremes: The Volume Index helps identify periods of unusually high or low volume. Values approaching 100 indicate high volume, while values close to 0 indicate low volume.
Confirmation Tool: During price movements, high volume (near 100) can act as a confirmation signal for the strength of the trend. For instance, a high volume during an uptrend may indicate strong buying interest.
Divergence Analysis: Traders can look for divergences between volume and price. For example, if the price is consolidating while the Volume Index remains high, it could signal an impending breakout.
Volume Alerts: The indicator includes an alert feature when the Volume Index exceeds 80, helping traders stay informed about potential shifts in market volatility.
Adapted RSI w/ Multi-Asset Regime Detection v1.1The relative strength index (RSI) is a momentum indicator used in technical analysis. RSI measures the speed and magnitude of an asset's recent price changes to detect overbought or oversold conditions in the price of said asset.
In addition to identifying overbought and oversold assets, the RSI can also indicate whether your desired asset may be primed for a trend reversal or a corrective pullback in price. It can signal when to buy and sell.
The RSI will oscillate between 0 and 100. Traditionally, an RSI reading of 70 or above indicates an overbought condition. A reading of 30 or below indicates an oversold condition.
The RSI is one of the most popular technical indicators. I intend to offer a fresh spin.
Adapted RSI w/ Multi-Asset Regime Detection
Our Adapted RSI makes necessary improvements to the original Relative Strength Index (RSI) by combining multi-timeframe analysis with multi-asset monitoring and providing traders with an efficient way to analyse market-wide conditions across different timeframes and assets simultaneously. The indicator automatically detects market regimes and generates clear signals based on RSI levels, presenting this data in an organised, easy-to-read format through two dynamic tables. Simplicity is key, and having access to more RSI data at any given time, allows traders to prepare more effectively, especially when trading markets that "move" together.
How we calculate the RSI
First, the RSI identifies price changes between periods, calculating gains and losses from one look-back period to the next. This look-back period averages gains and losses over 14 periods, which in this case would be 14 days, and those gains/losses are calculated based on the daily closing price. For example:
Average Gain = Sum of Gains over the past 14 days / 14
Average Loss = Sum of Losses over the past 14 days / 14
Then we calculate the Relative Strength (RS):
RS = Average Gain / Average Loss
Finally, this is converted to the RSI value:
RSI = 100 - (100 / (1 + RS))
Key Features
Our multi-timeframe RSI indicator enhances traditional technical analysis by offering synchronised Daily, Weekly, and Monthly RSI readings with automatic regime detection. The multi-asset monitoring system allows tracking of up to 10 different assets simultaneously, with pre-configured major pairs that can be customised to any asset selection. The signal generation system provides clear market guidance through automatic regime detection and a five-level signal system, all presented through a sophisticated visual interface with dynamic RSI line colouring and customisable display options.
Quick Guide to Use it
Begin by adding the indicator to your chart and configuring your preferred assets in the "Asset Comparison" settings.
Position the two information tables according to your preference.
The main table displays RSI analysis across three timeframes for your current asset, while the asset table shows a comparative analysis of all monitored assets.
Signals are colour-coded for instant recognition, with green indicating bullish conditions and red for bearish conditions. Pay special attention to regime changes and signal transitions, using multi-timeframe confluence to identify stronger signals.
How it Works (Regime Detection & Signals)
When we say 'Regime', a regime is determined by a persistent trend or in this case momentum and by leveraging this for RSI, which is a momentum oscillator, our indicator employs a relatively simple regime detection system that classifies market conditions as either Bullish (RSI > 50) or Bearish (RSI < 50). Our benchmark between a trending bullish or bearish market is equal to 50. By leveraging a simple classification system helps determine the probability of trend continuation and the weight given to various signals. Whilst we could determine a Neutral regime for consolidating markets, we have employed a 'neutral' signal generation which will be further discussed below...
Signal generation occurs across five distinct levels:
Strong Buy (RSI < 15)
Buy (RSI < 30)
Neutral (RSI 30-70)
Sell (RSI > 70)
Strong Sell (RSI > 85)
Each level represents different market conditions and probability scenarios. For instance, extreme readings (Strong Buy/Sell) indicate the highest probability of mean reversion, while neutral readings suggest equilibrium conditions where traders should focus on the overall regime bias (Bullish/Bearish momentum).
This approach offers traders a new and fresh spin on a popular and well-known tool in technical analysis, allowing traders to make better and more informed decisions from the well presented information across multiple assets and timeframes. Experienced and beginner traders alike, I hope you enjoy this adaptation.

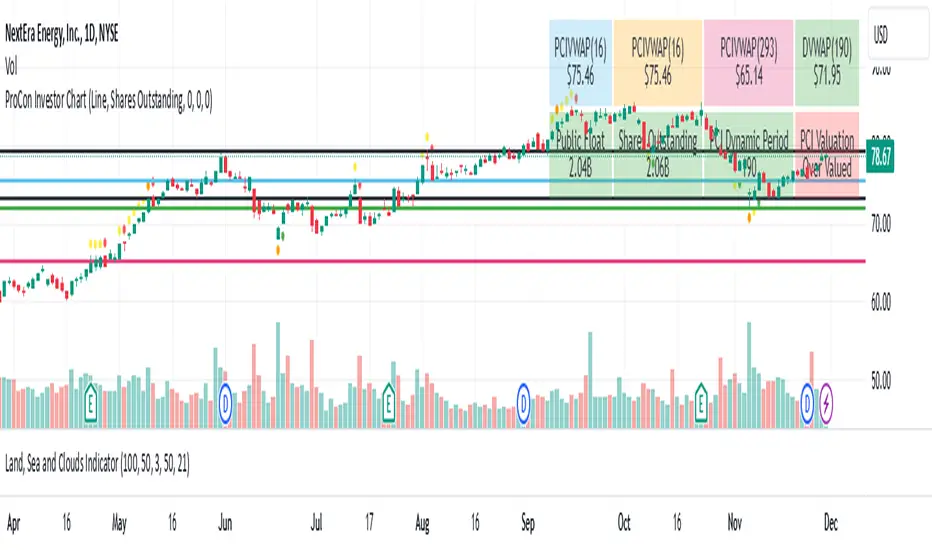
ProCon Investor ChartProCon Investor Chart: Originality and Usefulness
The ProCon Investor Chart is a unique integration of multiple technical indicators designed to provide actionable insights for traders. Unlike standalone indicators such as RSI, Stochastic, or Bollinger Bands, this script combines them into a proprietary framework that evaluates market conditions holistically.
Each component is enhanced to complement the others:
Dots: Proprietary algorithms combine RSI, Stochastic, MACD, and Bollinger Bands to determine overbought/oversold conditions and high-volume reversals. This combination adds a unique dimension by accounting for both momentum and market participation.
VWAP-Based Support and Resistance: The VWAP lines are calculated dynamically by combining trade volume with shares outstanding or public float, making them adaptable to specific securities and timeframes. This approach provides more precise levels compared to static support/resistance calculations.
Colored Bars: SMA-based trend analysis identifies short- and long-term trends while ensuring transparency for trend traders. The inclusion of SMA (5, 20, 50) allows users to spot transitions and key moments of trend reversal.
By integrating these components, the ProCon Investor Chart helps traders identify opportunities that standalone indicators might miss, providing a comprehensive view of market behavior.
Indicator Description and How to Use
The ProCon Investor Chart is a multi-layered analytical tool designed for identifying trends, market sentiment, and dynamic support/resistance levels. Here's how it works:
Dots for Overbought/Oversold Conditions:
Calculated using RSI, Stochastic, MACD, and Bollinger Bands.
Yellow dots (above/below bars) signify overbought/oversold levels.
Orange dots highlight high-volume oversold/overbought areas, combining price action and market participation.
Red and green dots mark potential reversals in price trends.
VWAP Support and Resistance Lines:
VWAP lines are calculated using a proprietary metric that integrates trade volume with public float or shares outstanding.
These levels adapt dynamically and are reset based on trading activity, offering precise support/resistance points.
Trend-Driven Colored Bars:
Bars are color-coded based on SMA values (5, 20, 50) to identify trends and market transitions.
Table Summary:
Displays VWAP levels, sentiment analysis, and dynamic metrics, offering traders a snapshot of critical data.
This approach ensures that the script provides unique insights beyond what individual indicators can achieve. By integrating multiple dimensions of technical analysis, the ProCon Investor Chart is a reliable companion for day traders, swing traders, and investors seeking actionable market analytics.
Value Proposition for Invite-Only Script
While the ProCon Investor Chart uses classic indicators like RSI, Bollinger Bands, and VWAP, it integrates these elements into a proprietary system that offers unique advantages:
Advanced Calculations:
The VWAP-based support and resistance levels go beyond standard VWAP by integrating trade volume with float data, making them highly adaptable to specific securities.
Actionable Visuals:
The dot-based system simplifies the detection of overbought/oversold levels, incorporating volume and momentum into one visual cue.
Trend-Specific Features:
By combining SMAs with custom color coding, the script allows trend traders to identify transitions at a glance.
Additional Features
Table Display: Support and resistance lines are conveniently displayed in a table in the top-right corner of the chart, along with a simple valuation of the stock relative to these levels.
This multi-dimensional approach justifies the script’s originality and ensures that users receive actionable insights tailored to their trading strategies.
The ProCon Investor Chart is designed to consolidate multiple data points into a unified tool, helping traders make informed decisions with greater confidence. Its custom dynamic VWAP calculations and sentiment analysis provide a clear and actionable view of market conditions.
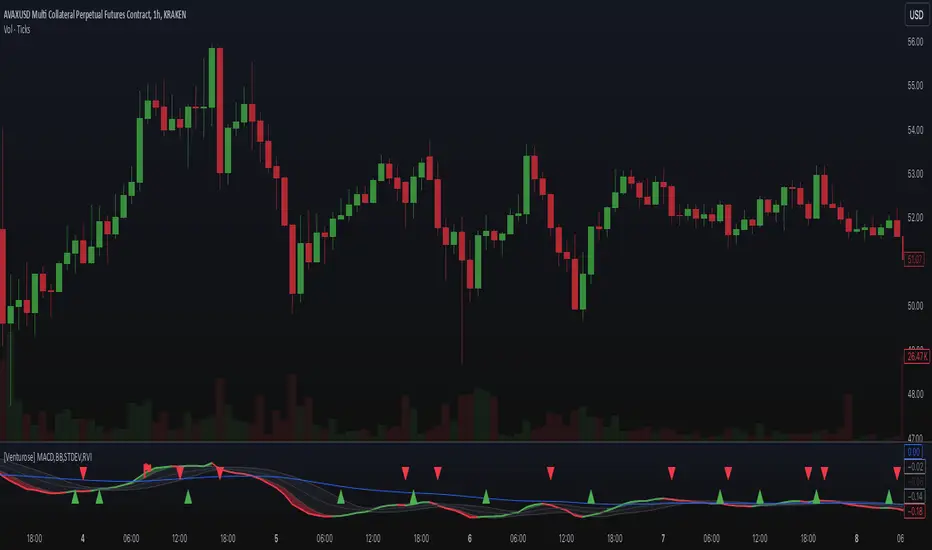
[Venturose] MACD x BB x STDEV x RVIDescription:
The MACD x BB x STDEV x RVI combines MACD, Bollinger Bands, Standard Deviation, and Relative Volatility Index into a single tool. This indicator is designed to provide insights into market trends, momentum, and volatility. It generates buy and sell signals, by analyzing the interactions between these components. These buy and sell signals are not literal, and should be used in combination with the current trend.
How It Works:
MACD: Tracks momentum and trend direction using customizable fast and slow EMA periods.
Bollinger Bands: Adds volatility bands to MACD to identify overextension zones.
Standard Deviation: Dynamically adjusts the Bollinger Band width based on MACD volatility.
RVI (Relative Volatility Index): Confirms momentum extremes with upper and lower threshold markers.
Custom Logic: Includes a trigger system ("inside" or "flipped") to adapt signals to various market conditions and an optional filter to reduce noise.
Key Features:
Combines MACD and Bollinger Bands with volatility and momentum confirmations from RVI.
Dynamic color-coded plots for identifying bullish, bearish, and neutral trends.
Customizable parameters for tailoring the indicator to different strategies.
Optional signal filtering to refine buy and sell triggers.
Alerts for buy and sell signals based on signal logic.
Why It’s Unique:
This indicator combines momentum (MACD), volatility (Bollinger Bands and Standard Deviation), and confirmation signals (RVI thresholds) into a unified system. It introduces custom "inside" and "flipped" triggers for adaptable signal generation and includes signal filtering to reduce noise. The addition of RVI-based hints helps identify early overbought or oversold conditions, providing an extra layer of insight for decision-making. The dynamic integration of these components ensures a comprehensive yet straightforward analysis tool for various market conditions.
Momentum Zones [TradersPro]OVERVIEW
The Momentum Zones indicator is designed for momentum stock traders to provide a visible trend structure with actionable price levels. The indicator has been designed for high-growth, bullish stocks on a daily time frame but can be used on any chart and timeframe.
Momentum zones help traders focus on the momentum structure of price, enabling disciplined trading plans with specific entry, exit, and risk management levels.
It is built using CCI values, allowing for fixed trend range calculations. It is most effective when applied to screens of stocks with high RSI, year-to-date (YTD) price gains of 25% or higher, as well as stocks showing growth in both sales and earnings quarter-over-quarter and year-over-year.
CONCEPTS
The indicator defines and colors uptrends (green), downtrends (red), and trends in transition or pausing (yellow).
The indicator can be used for new trend entry or trend continuation entry. New trend entry can be done on the first green bar after a red bar. Trend continuation entries can be done with the first green bar after a yellow bar. The yellow transition zones can be used as price buffers for stop-loss management on new entries.
To see the color changes, users need to be sure to uncheck the candlestick color settings. This can be done by right-clicking the chart, going to Symbols, and unchecking the candle color body, border, and wick boxes.
Remember to check them if the indicator is turned off, or the candles will be blank with no color.
The settings also correspond to the screening function to get a list of stocks entering various momentum zones so you can have a prime list of the stocks meeting any other fundamental criteria you may desire. Traders can then use the indicator for the entry and risk structure of the trading plan.

Triple CCI Strategy MFI Confirmed [Skyrexio]Overview
Triple CCI Strategy MFI Confirmed leverages 3 different periods Commodity Channel Index (CCI) indicator in conjunction Money Flow Index (MFI) and Exponential Moving Average (EMA) to obtain the high probability setups. Fast period CCI is used for having the high probability to enter in the direction of short term trend, middle and slow period CCI are used for confirmation, if market now likely in the mid and long-term uptrend. MFI is used to confirm trade with the money inflow/outflow with the high probability. EMA is used as an additional trend filter. Moreover, strategy uses exponential moving average (EMA) to trail the price when it reaches the specific level. More information in "Methodology" and "Justification of Methodology" paragraphs. The strategy opens only long trades.
Unique Features
Dynamic stop-loss system: Instead of fixed stop-loss level strategy utilizes average true range (ATR) multiplied by user given number subtracted from the position entry price as a dynamic stop loss level.
Configurable Trading Periods: Users can tailor the strategy to specific market windows, adapting to different market conditions.
Four layers trade filtering system: Strategy utilizes two different period CCI indicators, MFI and EMA indicators to confirm the signals produced by fast period CCI.
Trailing take profit level: After reaching the trailing profit activation level scrip activate the trailing of long trade using EMA. More information in methodology.
Methodology
The strategy opens long trade when the following price met the conditions:
Fast period CCI shall crossover the zero-line.
Slow and Middle period CCI shall be above zero-lines.
Price shall close above the EMA. Crossover is not obligatory
MFI shall be above 50
When long trade is executed, strategy set the stop-loss level at the price ATR multiplied by user-given value below the entry price. This level is recalculated on every next candle close, adjusting to the current market volatility.
At the same time strategy set up the trailing stop validation level. When the price crosses the level equals entry price plus ATR multiplied by user-given value script starts to trail the price with EMA. If price closes below EMA long trade is closed. When the trailing starts, script prints the label “Trailing Activated”.
Strategy settings
In the inputs window user can setup the following strategy settings:
ATR Stop Loss (by default = 1.75)
ATR Trailing Profit Activation Level (by default = 2.25)
CCI Fast Length (by default = 14, used for calculation short term period CCI)
CCI Middle Length (by default = 25, used for calculation short term period CCI)
CCI Slow Length (by default = 50, used for calculation long term period CCI)
MFI Length (by default = 14, used for calculation MFI
EMA Length (by default = 50, period of EMA, used for trend filtering EMA calculation)
Trailing EMA Length (by default = 20)
User can choose the optimal parameters during backtesting on certain price chart.
Justification of Methodology
Before understanding why this particular combination of indicator has been chosen let's briefly explain what is CCI, MFI and EMA.
The Commodity Channel Index (CCI) is a momentum-based technical indicator that measures the deviation of a security's price from its average price over a specific period. It helps traders identify overbought or oversold conditions and potential trend reversals.
The CCI formula is:
CCI = (Typical Price − SMA) / (0.015 × Mean Deviation)
Typical Price (TP): This is calculated as the average of the high, low, and closing prices for the period.
Simple Moving Average (SMA): This is the average of the Typical Prices over a specific number of periods.
Mean Deviation: This is the average of the absolute differences between the Typical Price and the SMA.
The result is a value that typically fluctuates between +100 and -100, though it is not bounded and can go higher or lower depending on the price movement.
The Money Flow Index (MFI) is a technical indicator that measures the strength of money flowing into and out of a security. It combines price and volume data to assess buying and selling pressure and is often used to identify overbought or oversold conditions. The formula for MFI involves several steps:
1. Calculate the Typical Price (TP):
TP = (high + low + close) / 3
2. Calculate the Raw Money Flow (RMF):
Raw Money Flow = TP × Volume
3. Determine Positive and Negative Money Flow:
If the current TP is greater than the previous TP, it's Positive Money Flow.
If the current TP is less than the previous TP, it's Negative Money Flow.
4. Calculate the Money Flow Ratio (MFR):
Money Flow Ratio = Sum of Positive Money Flow (over n periods) / Sum of Negative Money Flow (over n periods)
5. Calculate the Money Flow Index (MFI):
MFI = 100 − (100 / (1 + Money Flow Ratio))
MFI above 80 can be considered as overbought, below 20 - oversold.
The Exponential Moving Average (EMA) is a type of moving average that places greater weight and significance on the most recent data points. It is widely used in technical analysis to smooth price data and identify trends more quickly than the Simple Moving Average (SMA).
Formula:
1. Calculate the multiplier
Multiplier = 2 / (n + 1) , Where n is the number of periods.
2. EMA Calculation
EMA = (Current Price) × Multiplier + (Previous EMA) × (1 − Multiplier)
This strategy leverages Fast period CCI, which shall break the zero line to the upside to say that probability of short term trend change to the upside increased. This zero line crossover shall be confirmed by the Middle and Slow periods CCI Indicators. At the moment of breakout these two CCIs shall be above 0, indicating that there is a high probability that price is in middle and long term uptrend. This approach increases chances to have a long trade setup in the direction of mid-term and long-term trends when the short-term trend starts to reverse to the upside.
Additionally strategy uses MFI to have a greater probability that fast CCI breakout is confirmed by this indicator. We consider the values of MFI above 50 as a higher probability that trend change from downtrend to the uptrend is real. Script opens long trades only if MFI is above 50. As you already know from the MFI description, it incorporates volume in its calculation, therefore we have another one confirmation factor.
Finally, strategy uses EMA an additional trend filter. It allows to open long trades only if price close above EMA (by default 50 period). It increases the probability of taking long trades only in the direction of the trend.
ATR is used to adjust the strategy risk management to the current market volatility. If volatility is low, we don’t need the large stop loss to understand the there is a high probability that we made a mistake opening the trade. User can setup the settings ATR Stop Loss and ATR Trailing Profit Activation Level to realize his own risk to reward preferences, but the unique feature of a strategy is that after reaching trailing profit activation level strategy is trying to follow the trend until it is likely to be finished instead of using fixed risk management settings. It allows sometimes to be involved in the large movements. It’s also important to make a note, that script uses another one EMA (by default = 20 period) as a trailing profit level.
Backtest Results
Operating window: Date range of backtests is 2022.04.01 - 2024.11.25. It is chosen to let the strategy to close all opened positions.
Commission and Slippage: Includes a standard Binance commission of 0.1% and accounts for possible slippage over 5 ticks.
Initial capital: 10000 USDT
Percent of capital used in every trade: 50%
Maximum Single Position Loss: -4.13%
Maximum Single Profit: +19.66%
Net Profit: +5421.21 USDT (+54.21%)
Total Trades: 108 (44.44% win rate)
Profit Factor: 2.006
Maximum Accumulated Loss: 777.40 USDT (-7.77%)
Average Profit per Trade: 50.20 USDT (+0.85%)
Average Trade Duration: 44 hours
These results are obtained with realistic parameters representing trading conditions observed at major exchanges such as Binance and with realistic trading portfolio usage parameters.
How to Use
Add the script to favorites for easy access.
Apply to the desired timeframe and chart (optimal performance observed on 2h BTC/USDT).
Configure settings using the dropdown choice list in the built-in menu.
Set up alerts to automate strategy positions through web hook with the text: {{strategy.order.alert_message}}
Disclaimer:
Educational and informational tool reflecting Skyrex commitment to informed trading. Past performance does not guarantee future results. Test strategies in a simulated environment before live implementation

RSI + Normalized Fisher Transform with SignalsThis indicator combines three tools for market analysis: the Relative Strength Index (RSI), the RSI's moving average, and the Fisher Transform. RSI is a momentum oscillator that measures the speed and change of price movements, helping identify overbought and oversold conditions. The RSI moving average is a smoothed version of the RSI that filters noise and confirms trends. The Fisher Transform is a mathematical technique that transforms price data into a Gaussian normal distribution, making it easier to identify turning points. It has been normalized to the same scale as the RSI (0-100) for consistency.
Purpose
The goal of this indicator is to identify potential buy and sell opportunities with varying degrees of strength (strong and weak). By combining the RSI, its moving average, and the Fisher Transform, the indicator ensures signals are based on both momentum and reversals, making it highly versatile across different market conditions.
Key Features
This indicator provides strong and weak buy and sell signals. A strong buy occurs when the RSI crosses above its moving average while both the RSI and its moving average are oversold (below the default threshold of 30), and the Fisher Transform reverses direction within the same or prior bar while also being oversold. A weak buy occurs when the Fisher Transform is oversold, and the RSI crosses above its moving average while its value is between the default oversold threshold (30) and 50. A strong sell occurs when the RSI crosses below its moving average while both the RSI and its moving average are overbought (above the default threshold of 70), and the Fisher Transform reverses direction within the same or prior bar while also being overbought. A weak sell occurs when the Fisher Transform is overbought, and the RSI crosses below its moving average while its value is between 50 and the default overbought threshold (70).
The indicator includes customizable thresholds and lengths. Users can adjust the oversold and overbought thresholds to suit their trading style. The RSI length, moving average length, and Fisher Transform length are also customizable. The Fisher Transform is scaled to the RSI’s range of 0-100 to simplify analysis and signal interpretation.
How to Use the Indicator
On the chart, you will see the RSI line in blue, the RSI moving average in orange, and the Fisher Transform in purple. Horizontal lines at the default oversold (30) and overbought (70) levels mark critical zones for signals. Adjust these thresholds in the indicator settings as needed.
Strong buy signals are shown as larger, darker green arrows below the price. Weak buy signals are small lime arrows below the price. Strong sell signals are larger, darker red arrows above the price. Weak sell signals are small fuchsia arrows above the price.
Signal Interpretation
A strong buy indicates a highly favorable buying opportunity. This typically occurs when the asset is in a downtrend but shows signs of reversal, particularly in oversold zones. A weak buy suggests a potential buying opportunity but with less conviction, often when the market is neutral to slightly bearish but showing upward momentum. A strong sell indicates a highly favorable selling opportunity, usually occurring when the asset is in an uptrend but shows signs of reversal, particularly in overbought zones. A weak sell suggests a potential selling opportunity but with less conviction, often in neutral to slightly bullish markets showing downward momentum.
Practical Tips
Avoid using signals in isolation. Combine this indicator with other tools such as trendlines, moving averages, or support/resistance levels for greater accuracy. Adjust the parameters for different assets to match their volatility. For volatile assets, consider wider thresholds like 20/80 for oversold/overbought levels. For less volatile assets, tighter thresholds like 35/65 may be more appropriate. Use higher timeframes to confirm signals before trading on lower timeframes. Be cautious in sideways markets, as both RSI and the Fisher Transform perform better in trending conditions.
Instructions for Adjustments
To change the oversold or overbought levels, open the indicator settings by clicking the gear icon and modify the "Oversold Threshold" and "Overbought Threshold" values. To adjust lengths for RSI and Fisher Transform, update the "RSI Length," "RSI Moving Average Length," and "Fisher Transform Length" settings. If needed, toggle signal visibility by enabling or disabling specific arrows (Strong Buy, Weak Buy, Strong Sell, Weak Sell) in the "Style" tab.
Best Practices
Risk management is essential. Always set appropriate stop-loss levels and position sizes based on your risk tolerance. Backtest the indicator on historical data to understand its performance and behavior for your chosen asset and timeframe. Combining this indicator with volume or volatility analysis (Bollinger Band Width, for example) can help confirm signal validity.
This indicator simplifies decision-making by identifying high-probability trading opportunities using a combination of momentum, trend, and reversals. Follow these instructions to fully utilize its capabilities without needing to analyze the underlying code.

BTCUSD Momentum After Abnormal DaysThis indicator identifies abnormal days in the Bitcoin market (BTCUSD) based on daily returns exceeding specific thresholds defined by a statistical approach. It is inspired by the findings of Caporale and Plastun (2020), who analyzed the cryptocurrency market's inefficiencies and identified exploitable patterns, particularly around abnormal returns.
Key Concept:
Abnormal Days:
Days where the daily return significantly deviates (positively or negatively) from the historical average.
Positive abnormal days: Returns exceed the mean return plus k times the standard deviation.
Negative abnormal days: Returns fall below the mean return minus k times the standard deviation.
Momentum Effect:
As described in the academic paper, on abnormal days, prices tend to move in the direction of the abnormal return until the end of the trading day, creating momentum effects. This can be leveraged by traders for profit opportunities.
How It Works:
Calculation:
The script calculates the daily return as the percentage difference between the open and close prices. It then derives the mean and standard deviation of returns over a configurable lookback period.
Thresholds:
The script dynamically computes upper and lower thresholds for abnormal days using the mean and standard deviation. Days exceeding these thresholds are flagged as abnormal.
Visualization:
The mean return and thresholds are plotted as dynamic lines.
Abnormal days are visually highlighted with transparent green (positive) or red (negative) backgrounds on the chart.
References:
This indicator is based on the methodology discussed in "Momentum Effects in the Cryptocurrency Market After One-Day Abnormal Returns" by Caporale and Plastun (2020). Their research demonstrates that hourly returns during abnormal days exhibit a strong momentum effect, moving in the same direction as the abnormal return. This behavior contradicts the efficient market hypothesis and suggests profitable trading opportunities.
"Prices tend to move in the direction of abnormal returns till the end of the day, which implies the existence of a momentum effect on that day giving rise to exploitable profit opportunities" (Caporale & Plastun, 2020).

Super CCI By Baljit AujlaThe indicator you've shared is a custom CCI (Commodity Channel Index) with multiple types of Moving Averages (MA) and Divergence Detection. It is designed to help traders identify trends and reversals by combining the CCI with various MAs and detecting different types of divergences between the price and the CCI.
Key Components of the Indicator:
CCI (Commodity Channel Index):
The CCI is an oscillator that measures the deviation of the price from its average price over a specific period. It helps identify overbought and oversold conditions and the strength of a trend.
The CCI is calculated by subtracting a moving average (SMA) from the price and dividing by the average deviation from the SMA. The CCI values fluctuate above and below a zero centerline.
Multiple Moving Averages (MA):
The indicator allows you to choose from a variety of moving averages to smooth the CCI line and identify trend direction or support/resistance levels. The available types of MAs include:
SMA (Simple Moving Average)
EMA (Exponential Moving Average)
WMA (Weighted Moving Average)
HMA (Hull Moving Average)
RMA (Running Moving Average)
SMMA (Smoothed Moving Average)
TEMA (Triple Exponential Moving Average)
DEMA (Double Exponential Moving Average)
VWMA (Volume-Weighted Moving Average)
ZLEMA (Zero-Lag Exponential Moving Average)
You can select the type of MA to use with a specified length to help identify the trend direction or smooth out the CCI.
Divergence Detection:
The indicator includes a divergence detection mechanism to identify potential trend reversals. Divergences occur when the price and an oscillator like the CCI move in opposite directions, signaling a potential change in price momentum.
Four types of divergences are detected:
Bullish Divergence: Occurs when the price makes a lower low, but the CCI makes a higher low. This indicates a potential reversal to the upside.
Bearish Divergence: Occurs when the price makes a higher high, but the CCI makes a lower high. This indicates a potential reversal to the downside.
Hidden Bullish Divergence: Occurs when the price makes a higher low, but the CCI makes a lower low. This suggests a continuation of the uptrend.
Hidden Bearish Divergence: Occurs when the price makes a lower high, but the CCI makes a higher high. This suggests a continuation of the downtrend.
Each type of divergence is marked on the chart with arrows and labels to alert traders to potential trading opportunities. The labels include the divergence type (e.g., "Bull Div" for Bullish Divergence) and have customizable text colors.
Visual Representation:
The CCI and its associated moving average are plotted on the indicator panel below the price chart. The CCI is plotted as a line, and its color changes depending on whether it is above or below the moving average:
Green when the CCI is above the MA (indicating bullish momentum).
Red when the CCI is below the MA (indicating bearish momentum).
Horizontal lines are drawn at specific levels to help identify key CCI thresholds:
200 and -200 levels indicate extreme overbought or oversold conditions.
75 and -75 levels represent less extreme levels of overbought or oversold conditions.
The 0 level acts as a neutral or baseline level.
A background color fill between the 75 and -75 levels helps highlight the neutral zone.
Customization Options:
CCI Length: You can customize the length of the CCI, which determines the period over which the CCI is calculated.
MA Length: The length of the moving average applied to the CCI can also be adjusted.
MA Type: Choose from a variety of moving averages (SMA, EMA, WMA, etc.) to smooth the CCI.
Divergence Detection: The indicator automatically detects the four types of divergences (bullish, bearish, hidden bullish, hidden bearish) and visually marks them on the chart.
How to Use the Indicator:
Trend Identification: When the CCI is above the selected moving average, it suggests bullish momentum. When the CCI is below the moving average, it suggests bearish momentum.
Overbought/Oversold Conditions: The CCI values above 100 or below -100 indicate overbought and oversold conditions, respectively.
Divergence Analysis: The detection of bullish or bearish divergences can signal potential trend reversals. Hidden divergences may suggest trend continuation.
Trading Signals: You can use the divergence markers (arrows and labels) as potential buy or sell signals, depending on whether the divergence is bullish or bearish.
Practical Application:
This indicator is useful for traders who want to:
Combine the CCI with different moving averages for trend-following strategies.
Identify overbought and oversold conditions using the CCI.
Use divergence detection to anticipate potential trend reversals or continuations.
Have a highly customizable tool for various trading strategies, including trend trading, reversal trading, and divergence-based trading.
Overall, this is a comprehensive tool that combines multiple technical analysis techniques (CCI, moving averages, and divergence) in a single indicator, providing traders with a robust way to analyze price action and spot potential trading opportunities.