[DEM] Correlation Dashboard Correlation Dashboard is designed to display real-time correlation analysis between the current chart's asset and five major market instruments (Bitcoin, Dow Jones 30, Dollar Index, Nasdaq 100, and S&P 500) in an easy-to-read table format overlaid on the price chart. The indicator calculates correlation coefficients over a configurable period (default 20 bars) and applies additional smoothing using a 200-period RMA to filter out noise and identify persistent correlation trends. The dashboard categorizes correlations into five levels ranging from "Very Strong Positive/Negative Correlation" (above ±0.5) to "No Strong Correlation" (between ±0.3), with color-coded text displaying green for positive correlations, red for negative correlations, and white for neutral relationships, enabling traders to quickly assess how their asset moves relative to major market benchmarks and identify potential diversification opportunities or risk concentrations.
Centered Oscillators

[DEM] Correlation Coefficient Correlation Coefficient is designed to calculate and visualize the statistical correlation between the current chart's price movement and another selected symbol (defaulting to SPX) over a specified period. The indicator displays the correlation coefficient as both a colored area chart and line plot in a separate pane below the main chart, with colors dynamically changing from red (negative correlation) through purple (no correlation) to green (positive correlation) based on the strength and direction of the relationship. The correlation values range from -1 (perfect negative correlation) to +1 (perfect positive correlation), with horizontal reference lines at these extremes and zero, helping traders understand how closely their asset moves in relation to the selected benchmark symbol and identify periods of divergence or convergence in market behavior.

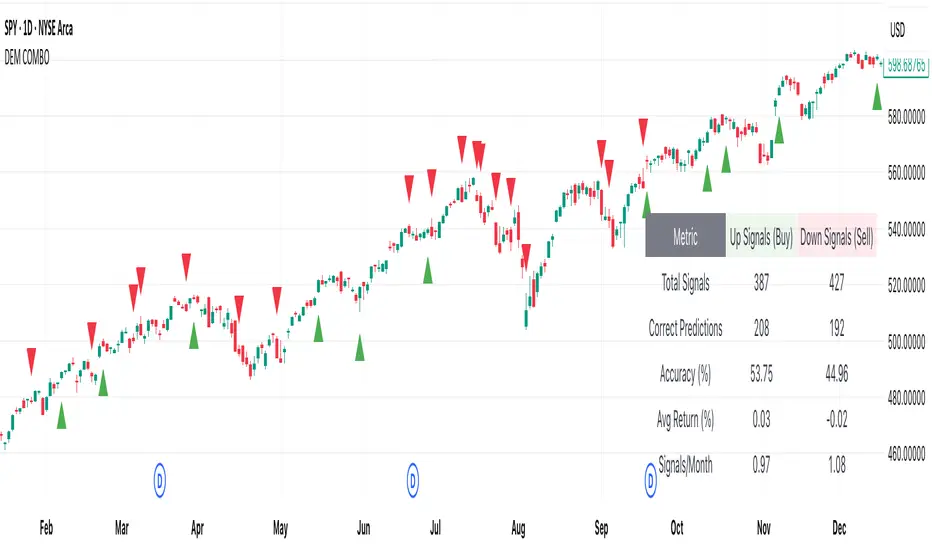
[DEM] Combo Signal (With Backtesting) Combo Signal (With Backtesting) is designed to generate buy and sell signals by combining seven different trading strategies that incorporate multiple technical indicators including SuperTrend, Parabolic SAR, MACD, and RSI. It also includes a comprehensive backtesting framework to evaluate the historical performance of these signals. The indicator overlays directly on the price chart, plotting signals and displaying performance statistics in a table. The strategy triggers buy signals when any of seven long conditions are met (including ATR-based reversal patterns, SuperTrend confirmations, RSI oversold crossovers, MACD bullish crossovers, and SuperTrend line breaks), while sell signals are generated when any of the corresponding seven short conditions occur, creating a multi-faceted approach that aims to capture various market conditions and trading opportunities while tracking signal accuracy, average returns, and signal frequency through its integrated backtesting system.
[DEM] Chande Momentum + Aroon Signal (With Backtesting) Chande Momentum + Aroon Signal (With Backtesting) is designed to generate buy and sell signals by combining the Chande Momentum Oscillator with the Aroon indicator. It also includes a comprehensive backtesting framework to evaluate the historical performance of these signals. The indicator overlays directly on the price chart, plotting signals and displaying performance statistics in a table. The strategy generates buy signals when the Aroon Up reaches 100% (indicating a new high) and the Chande Momentum Oscillator crosses above zero, while sell signals are triggered when the Aroon Down reaches 100% (indicating a new low) and the Chande Momentum Oscillator crosses below zero. The backtesting module tracks signal accuracy, average returns, signal frequency per month, and total correct predictions for both buy and sell signals across a configurable time horizon.

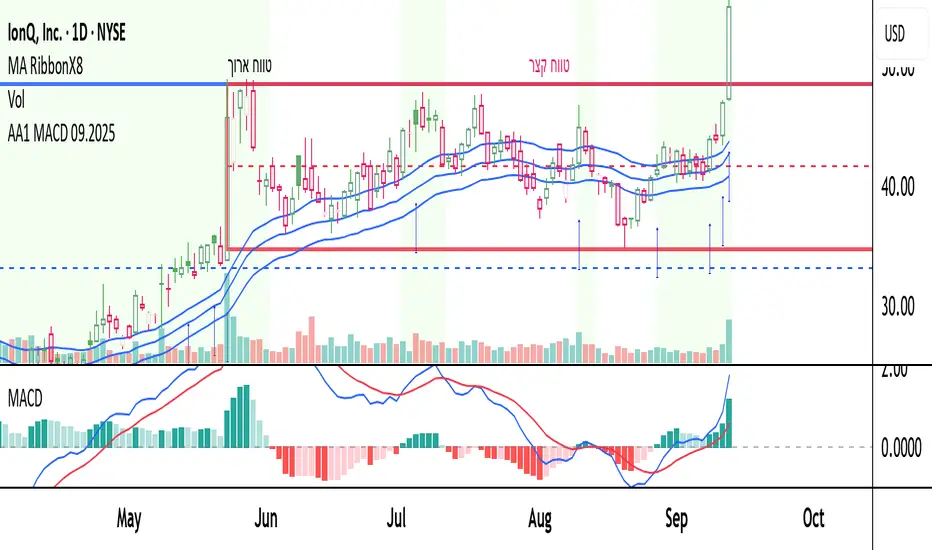
AA1 MACD 09.2025this is a learing project i want to share
the script is open for anyone
I combain some ema's mcad and more indicators to help find stocks in momentum
Trend-Strong Candle - 3 EMAs with Filters# Trend-Strong Candle - Professional Trading Indicator
## 📊 What It Does
Identifies high-probability entries by combining triple EMA trend analysis with strong candle detection. Only signals when all conditions align for maximum accuracy.
## 🎯 Core Features
- Triple EMA System: Fast (20) / Medium (50) / Slow (200) for trend confirmation
- Strong Candle Filter: ATR-based sizing ensures genuine momentum
- Advanced Filters: EMA close validation + trend stability checks
- Live Alerts: Instant notifications for real-time signals
- Session Filter: Trade only during active EU/US market hours
## ⚡ Quick Setup
Scalping (1-5min): Default settings + enable session filter
Day Trading (15-60min): Default settings work perfectly
Swing Trading (4H+): Increase ATR multiplier to 0.8-1.0
## 📈 Trading Rules
Long Signals: Green triangle below candle
- Strong bullish candle during confirmed uptrend
- All EMAs properly aligned (Fast > Medium > Slow)
Short Signals: Red triangle above candle
- Strong bearish candle during confirmed downtrend
- All EMAs properly aligned (Fast < Medium < Slow)
## ⚠️ Critical Success Factors
1. Always Verify the Trend Yourself
The indicator helps identify signals, but YOU must confirm the larger trend context. Check higher timeframes and overall market structure before entering.
2. Understand the "Big Players"
Strong candles in trend direction usually come from institutional money (banks, funds, algorithms). These create the momentum that retail traders can follow. The indicator catches these institutional moves.
3. Distance to Next Value Level
NEVER enter if price is too close to major resistance/support levels:
- Check distance to round numbers (1.1000, 1.1050, etc.)
- Ensure at least 20-30 pips room to next key level
- You need space for profit - tight levels = limited upside
4. Risk Management
- Stop Loss: 1-2 ATR from entry
- Take Profit: 2-3 ATR target (minimum 1:2 R/R)
- Position Size: Risk max 1-2% per trade
## 💡 Pro Tips
- Best Sessions: London open (8-12 UTC) and NY open (13-17 UTC)
- Avoid: Major news, low liquidity periods, choppy markets
- Multiple Timeframes: Confirm signals on higher timeframe
- Value Levels: Always check daily/weekly support/resistance before entering
## 🎯 Success Formula
Trend Confirmation + Strong Institutional Candle + Distance to Value Levels = High Probability Trade
*
Remember: The indicator finds the signals, but successful trading requires your analysis of trend context and value level positioning. Trade smart, not just frequent.

SOLACE PROSOLACE PRO is a confirmation-based trend/breakout indicator that computes on the previous candle to cut intrabar noise and repainting. It plots VWAP, Bollinger Bands (20,2), and SMA50/200, and signals BUY when the prior bar closed above the upper band and above VWAP/SMA50/SMA200 with MACD > signal; SELL when it closed below the lower band and below VWAP/SMAs with MACD < signal. Labels are stamped on the prior bar (offset −1), duplicate same-side signals are suppressed, and alert conditions are included for instant notifications.
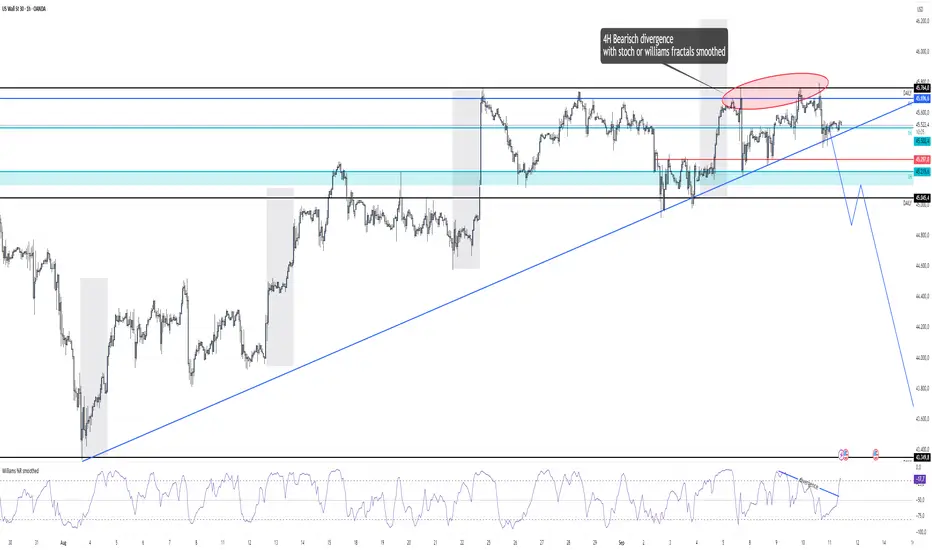
Williams %R smoothed🌍 English Description
Williams %R Smoothed – by Ján Salma
This is the first smoothed version of the Williams %R indicator published on TradingView.
The traditional Williams %R is a momentum oscillator that can be very choppy and noisy. Many traders find it hard to use because of the constant whipsaws.
This indicator solves that problem by applying an EMA smoothing on top of the raw Williams %R values.
Why is this special?
[* ]📉 Reduces noise → much cleaner signal, fewer false spikes.
🔍 Highlights real momentum shifts → easier to spot when the market truly changes direction.
🎯 Customizable smoothing → you decide how sensitive or smooth the curve should be.
⚡ Unique → currently, there is no other smoothed Williams %R available on TradingView.
Settings
Length → default 14 (standard Williams %R period).
Smoothing → default 3 EMA (smooths out the raw values).
Levels: -20 (overbought), -80 (oversold), -50 (mid-level).
This indicator is great for scalpers and swing traders who love Williams %R but hate the noise.
Now you can finally use %R with more confidence and clarity.
--------------------------------------------------------------------
Slovenský popis
Williams %R Smoothed – od Jána Salmu
Toto je prvá vyhladená verzia Williams %R indikátora publikovaná na TradingView.
Klasický Williams %R je oscilátor hybnosti, ktorý je často veľmi „roztrasený“ a plný šumu. Mnoho traderov s ním preto pracuje ťažko, pretože dáva veľa falošných signálov.
Tento indikátor to rieši tak, že na pôvodné hodnoty Williams %R aplikuje EMA vyhladenie .
Čo robí tento indikátor výnimočným?
📉 Redukuje šum → výsledná krivka je čistejšia, s menej falošnými výkyvmi.
🔍 Zvýrazňuje skutočné zmeny hybnosti → jasnejšie vidíš, kedy sa trh naozaj otáča.
🎯 Nastaviteľné vyhladenie → citlivosť indikátora si prispôsobíš podľa seba.
⚡ Unikát → na TradingView zatiaľ neexistuje žiadny iný vyhladený Williams %R.
Nastavenia
Dĺžka → predvolená hodnota 14 (štandardný Williams %R).
Smoothing (EMA) → predvolená hodnota 3 (vyhladenie krivky).
Úrovne: -20 (prekúpený trh), -80 (prepredaný trh), -50 (stredová hodnota).
Tento indikátor je skvelý pre scalperov aj swing traderov, ktorí majú radi Williams %R, ale chcú ho používať s väčšou presnosťou a prehľadnosťou.
3CRGANG - CANDLE CLOSE TIMER3CRGANG - CANDLE CLOSE TIMER
This indicator displays a timer for the current candle’s close and a multi-timeframe (MTF) timer table, showing the time remaining for various timeframes. It supports customizable timezones, visualization settings, and alerts for new candle openings and pre-close notifications, with filters for trading sessions and holidays.
Features:
Candle Timer: Displays the time remaining until the current candle closes, with color-coded visuals based on candle direction (green for up, red for down, gold when nearing close).
MTF Timer Table: Shows time remaining for multiple timeframes (M5, M15, M30, H1, H4, D, W, M, Q, Y) with a gradient-colored progress bar (green to red as time decreases).
Timezone Support: Choose from a wide range of timezones to align timer and alerts with your local time.
Visualization Options: Select device template (Desktop, Tablet, Mobile) and color theme (Light or Dark) for optimal display.
Alerts: Configurable alerts for new candle openings and pre-close thresholds across multiple timeframes, with session and holiday filters.
Session and Holiday Filters: Supports major exchanges (NYSE, LSE, FSE, SSX, TSE, HKSE) with holiday schedules and half-day considerations.
Do Not Disturb (DND): Set DND periods to suppress alerts during specific hours.
Time Settings:
Timezone: Select from a list of global timezones (e.g., UTC+3 Jerusalem, UTC-4 New York).
Time Format: Choose between Standard (12-hour with AM/PM) or Military (24-hour) time.
Visualization Setup:
Device: Select Desktop, Tablet, or Mobile template to adjust table sizes.
Color Theme: Choose Light or Dark theme for visual elements.
Timer Dashboard:
Timer Table Position: Set the position of the main timer table (e.g., top-right, bottom-center).
MTF Timer Dashboard:
Hide MTF Timer Table: Toggle visibility (off by default on Mobile template).
MTF Timer Table Position: Set position for the MTF timer table.
Offset Table Position: Adjust the Y-axis offset for the MTF table.
Notifications Settings:
Enable Alerts: Toggle alerts for Yearly, Quarterly, Monthly, Weekly, Daily, H4, H1, M30, and M15 timeframes.
Pre-Alert Threshold: Set the percentage of candle duration remaining for pre-close alerts (0–100%).
DND Settings:
Weekend Alerts: Enable/disable alerts during weekends.
DND Mode: Set start and end times for suppressing alerts.
Session Alerts Filter:
Holiday Alerts: Enable/disable alerts on exchange holidays.
Exchange Alerts: Toggle alerts for NYSE, LSE, FSE, SSX, TSE, and HKSE sessions.
Notes:
The indicator supports various asset types (stocks, forex, futures, crypto, commodities, indices) with tailored session detection.
The MTF timer table is hidden on Mobile template by default to optimize screen space.
Alerts respect user-defined session filters, holiday schedules, and DND settings for major exchanges.
Ensure sufficient chart history for accurate timeframe calculations.
Use the settings to customize timer display, alert behavior, and session filters to match your trading strategy.

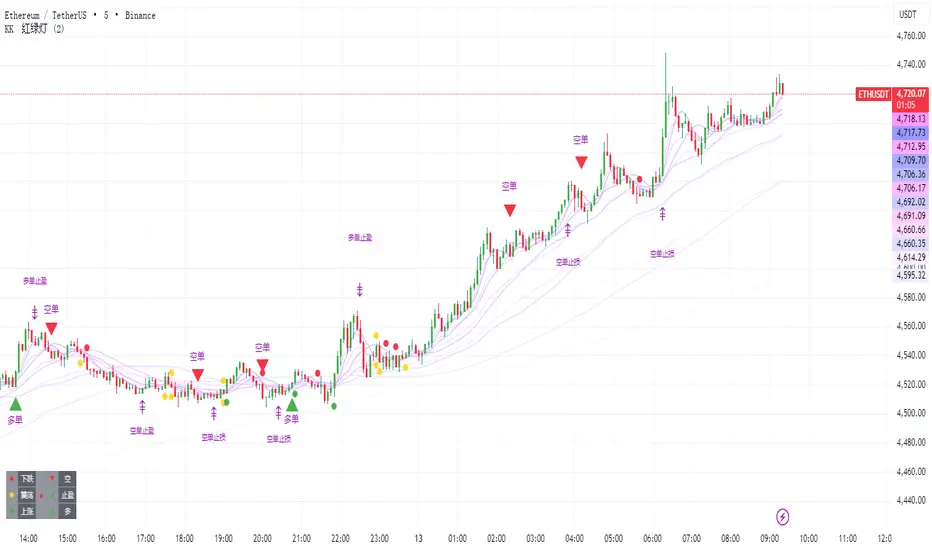
KK🚦LightKK Light is for 5min ~ 15min ETH/BTC only
The red triangles indicate selling, and the green ones indicate buying.
When the colored lights appear, you should be more careful.
The colored squares mean that you should stop what you're doing right now.
You can contact me for more details
Machine Learning Gaussian Mixture Model | AlphaNattMachine Learning Gaussian Mixture Model | AlphaNatt
A revolutionary oscillator that uses Gaussian Mixture Models (GMM) with unsupervised machine learning to identify market regimes and automatically adapt momentum calculations - bringing statistical pattern recognition techniques to trading.
"Markets don't follow a single distribution - they're a mixture of different regimes. This oscillator identifies which regime we're in and adapts accordingly."
━━━━━━━━━━━━━━━━━━━━━━━━━━━━━━━━━━━━━━━━
🤖 THE MACHINE LEARNING
Gaussian Mixture Models (GMM):
Unlike K-means clustering which assigns hard boundaries, GMM uses probabilistic clustering :
Models data as coming from multiple Gaussian distributions
Each market regime is a different Gaussian component
Provides probability of belonging to each regime
More sophisticated than simple clustering
Expectation-Maximization Algorithm:
The indicator continuously learns and adapts using the E-M algorithm:
E-step: Calculate probability of current market belonging to each regime
M-step: Update regime parameters based on new data
Continuous learning without repainting
Adapts to changing market conditions
━━━━━━━━━━━━━━━━━━━━━━━━━━━━━━━━━━━━━━━━
🎯 THREE MARKET REGIMES
The GMM identifies three distinct market states:
Regime 1 - Low Volatility:
Quiet, ranging markets
Uses RSI-based momentum calculation
Reduces false signals in choppy conditions
Background: Pink tint
Regime 2 - Normal Market:
Standard trending conditions
Uses Rate of Change momentum
Balanced sensitivity
Background: Gray tint
Regime 3 - High Volatility:
Strong trends or volatility events
Uses Z-score based momentum
Captures extreme moves
Background: Cyan tint
━━━━━━━━━━━━━━━━━━━━━━━━━━━━━━━━━━━━━━━━
💡 KEY INNOVATIONS
1. Probabilistic Regime Detection:
Instead of binary regime assignment, provides probabilities:
30% Regime 1, 60% Regime 2, 10% Regime 3
Smooth transitions between regimes
No sudden indicator jumps
2. Weighted Momentum Calculation:
Combines three different momentum formulas
Weights based on regime probabilities
Automatically adapts to market conditions
3. Confidence Indicator:
Shows how certain the model is (white line)
High confidence = strong regime identification
Low confidence = transitional market state
Line transparency changes with confidence
━━━━━━━━━━━━━━━━━━━━━━━━━━━━━━━━━━━━━━━━
⚙️ PARAMETER OPTIMIZATION
Training Period (50-500):
50-100: Quick adaptation to recent conditions
100: Balanced (default)
200-500: Stable regime identification
Number of Components (2-5):
2: Simple bull/bear regimes
3: Low/Normal/High volatility (default)
4-5: More granular regime detection
Learning Rate (0.1-1.0):
0.1-0.3: Slow, stable learning
0.3: Balanced (default)
0.5-1.0: Fast adaptation
━━━━━━━━━━━━━━━━━━━━━━━━━━━━━━━━━━━━━━━━
📊 TRADING STRATEGIES
Visual Signals:
Cyan gradient: Bullish momentum
Magenta gradient: Bearish momentum
Background color: Current regime
Confidence line: Model certainty
1. Regime-Based Trading:
Regime 1 (pink): Expect mean reversion
Regime 2 (gray): Standard trend following
Regime 3 (cyan): Strong momentum trades
2. Confidence-Filtered Signals:
Only trade when confidence > 70%
High confidence = clearer market state
Avoid transitions (low confidence)
3. Adaptive Position Sizing:
Regime 1: Smaller positions (choppy)
Regime 2: Normal positions
Regime 3: Larger positions (trending)
━━━━━━━━━━━━━━━━━━━━━━━━━━━━━━━━━━━━━━━━
🚀 ADVANTAGES OVER OTHER ML INDICATORS
vs K-Means Clustering:
Soft clustering (probabilities) vs hard boundaries
Captures uncertainty and transitions
More mathematically robust
vs KNN (K-Nearest Neighbors):
Unsupervised learning (no historical labels needed)
Continuous adaptation
Lower computational complexity
vs Neural Networks:
Interpretable (know what each regime means)
No overfitting issues
Works with limited data
━━━━━━━━━━━━━━━━━━━━━━━━━━━━━━━━━━━━━━━━
📈 PERFORMANCE CHARACTERISTICS
Best Market Conditions:
Markets with clear regime shifts
Volatile to trending transitions
Multi-timeframe analysis
Cryptocurrency markets (high regime variation)
Key Strengths:
Automatically adapts to market changes
No manual parameter adjustment needed
Smooth transitions between regimes
Probabilistic confidence measure
━━━━━━━━━━━━━━━━━━━━━━━━━━━━━━━━━━━━━━━━
🔬 TECHNICAL BACKGROUND
Gaussian Mixture Models are used extensively in:
Speech recognition (Google Assistant)
Computer vision (facial recognition)
Astronomy (galaxy classification)
Genomics (gene expression analysis)
Finance (risk modeling at investment banks)
The E-M algorithm was developed at Stanford in 1977 and is one of the most important algorithms in unsupervised machine learning.
━━━━━━━━━━━━━━━━━━━━━━━━━━━━━━━━━━━━━━━━
💡 PRO TIPS
Watch regime transitions: Best opportunities often occur when regimes change
Combine with volume: High volume + regime change = strong signal
Use confidence filter: Avoid low confidence periods
Multi-timeframe: Compare regimes across timeframes
Adjust position size: Scale based on identified regime
━━━━━━━━━━━━━━━━━━━━━━━━━━━━━━━━━━━━━━━━
⚠️ IMPORTANT NOTES
Machine learning adapts but doesn't predict the future
Best used with other confirmation indicators
Allow time for model to learn (100+ bars)
Not financial advice - educational purposes
Backtest thoroughly on your instruments
━━━━━━━━━━━━━━━━━━━━━━━━━━━━━━━━━━━━━━━━
🏆 CONCLUSION
The GMM Momentum Oscillator brings institutional-grade machine learning to retail trading. By identifying market regimes probabilistically and adapting momentum calculations accordingly, it provides:
Automatic adaptation to market conditions
Clear regime identification with confidence levels
Smooth, professional signal generation
True unsupervised machine learning
This isn't just another indicator with "ML" in the name - it's a genuine implementation of Gaussian Mixture Models with the Expectation-Maximization algorithm, the same technology used in:
Google's speech recognition
Tesla's computer vision
NASA's data analysis
Wall Street risk models
"Let the machine learn the market regimes. Trade with statistical confidence."
━━━━━━━━━━━━━━━━━━━━━━━━━━━━━━━━━━━━━━━━
Developed by AlphaNatt | Machine Learning Trading Systems
Version: 1.0
Algorithm: Gaussian Mixture Model with E-M
Classification: Unsupervised Learning Oscillator
Not financial advice. Always DYOR.

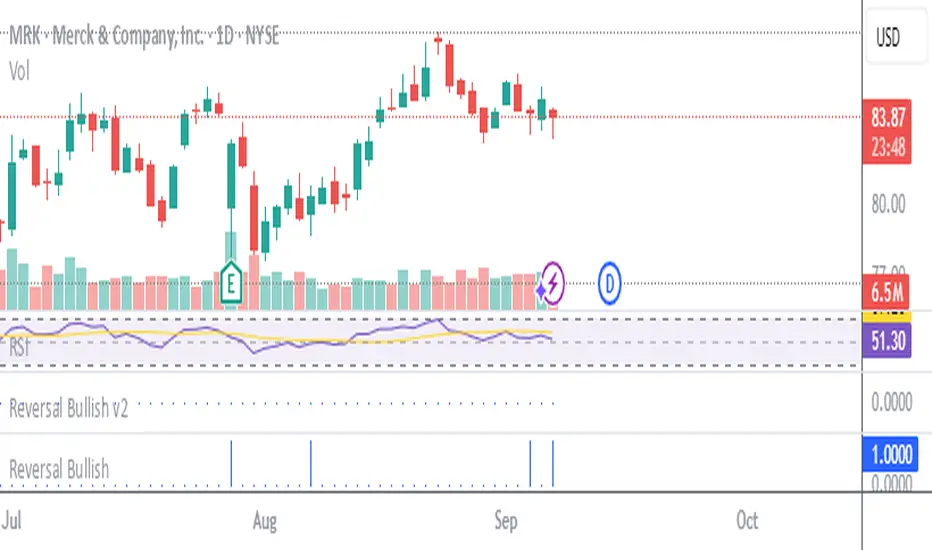
Stockbee Reversal BullishCustom indicator for identifying stocks that meet the Stockbee's Reversal Bullish criteria. This can be used as a standalone indicator or use it to screen for stocks in Pine Screener.
AI-Weighted RSI (Zeiierman)█ Overview
AI-Weighted RSI (Zeiierman) is an adaptive oscillator that enhances classic RSI by applying a correlation-weighted prediction layer. Instead of looking only at RSI values directly, this indicator continuously evaluates how other price- and volume-based features (returns, volatility, volume shifts) correlate with RSI, and then weights them accordingly to project the next RSI state.
The result is a smoother, forward-looking RSI framework that adapts to market conditions in real time.
By leveraging feature correlation instead of static formulas, AI-Weighted RSI behaves like a lightweight learning model, adjusting its emphasis depending on which features are most aligned with RSI behavior during the current regime.
█ How It Works
⚪ Feature Extraction
Each bar, the script computes features: log returns, RSI itself, ATR% (volatility), volume, and volume log-change.
⚪ Correlation Screening
Over a rolling learning window, it measures the correlation of each feature against RSI. The strongest relationships are ranked and selected.
⚪ Adaptive Weighting
Features are standardized (z-scored), then combined using their signed correlations as weights, building a rolling, adaptive prediction of RSI.
⚪ Prediction to RSI Weight
The predicted RSI is mapped back into a “weight” scale (±2 by default). Above 0 = bullish bias, below 0 = bearish bias, with color-graded fills to visualize overbought/oversold pressure.
⚪ Signal Line
A smoothing option (signal length) overlays a moving average of the AI-Weighted RSI for clearer trend confirmation.
█ Why AI-Weighted RSI
⚪ Adaptive to Market Regime
Because the model re-evaluates correlations continuously, it naturally shifts which features dominate, sometimes volatility explains RSI best, sometimes volume, sometimes returns.
⚪ Forward-Looking Bias
Instead of simply reflecting RSI, the model provides a projection, helping anticipate shifts in momentum before RSI itself flips.
█ How to Use
⚪ Directional Bias
Read the RSI relative to 0. Above = bullish momentum bias, below = bearish.
⚪ Overbought / Oversold Zones
Shaded fills beyond +0.5 or -0.5 highlight extremes where RSI pressure often exhausts.
⚪ Divergences
When price makes new highs/lows but AI-Weighted RSI fails to confirm, it often signals weakening momentum.
█ Settings
RSI Length: Lookback for the core RSI calculation.
Signal Length: Smoothing applied to the AI-Weighted RSI output.
Learning Window: Bars used for correlation learning and z-scoring.
-----------------
Disclaimer
The content provided in my scripts, indicators, ideas, algorithms, and systems is for educational and informational purposes only. It does not constitute financial advice, investment recommendations, or a solicitation to buy or sell any financial instruments. I will not accept liability for any loss or damage, including without limitation any loss of profit, which may arise directly or indirectly from the use of or reliance on such information.
All investments involve risk, and the past performance of a security, industry, sector, market, financial product, trading strategy, backtest, or individual's trading does not guarantee future results or returns. Investors are fully responsible for any investment decisions they make. Such decisions should be based solely on an evaluation of their financial circumstances, investment objectives, risk tolerance, and liquidity needs.

عكفة الماكد المتقدمة - أبو فارس ©// 🔒 Advanced MACD Curve © 2025
// 💡 Idea & Creativity: Engineer Abu Elias
// 🛠️ Development & Implementation: Abu Fares
// 📜 All intellectual rights reserved - Copying, modifying, or redistributing is not permitted
// 🚫 Any attempt to tamper with this code or violate intellectual property rights is legally prohibited
// 📧 For inquiries and licensing: Please contact the developer, Abu Fares

عكفة الماكد المتقدمة - أبو فارس ©// 🔒 عكفة الماكد المتقدمة © 2025
// 💡 فكرة وإبداع: المهندس أبو الياس
// 🛠️ تطوير وتنفيذ: أبو فارس
// 📜 جميع الحقوق الفكرية محفوظة - لا يُسمح بالنسخ أو التعديل أو إعادة التوزيع
// 🚫 أي محاولة للعبث بهذا الكود أو انتهاك الحقوق الفكرية مرفوضة قانونياً
// 📧 للاستفسارات والتراخيص: يرجى التواصل مع المطور أبو فارس
// 🔒 Advanced MACD Curve © 2025
// 💡 Idea & Creativity: Engineer Abu Elias
// 🛠️ Development & Implementation: Abu Fares
// 📜 All intellectual rights reserved - Copying, modifying, or redistributing is not permitted
// 🚫 Any attempt to tamper with this code or violate intellectual property rights is legally prohibited
// 📧 For inquiries and licensing: Please contact the developer, Abu Fares

[ClearEdege] Momentum Suites V3 Advanced contrarian momentum analysis with intelligent pivot point integration for precision market timing. Developed for ClearEdge members
*This indicator is not publicly available.
Key Features
Smart Signal System
- Buy Low/Sell High Logic: Identifies oversold conditions for long entries and overbought conditions for short entries
- Multi-Timeframe Confirmation: Incorporates higher timeframe bias for enhanced signal reliability
- Momentum Convergence: Combines RSI, StochRSI, and Bollinger Bands for comprehensive market analysis
Dynamic Pivot Integration
- Classic Pivot Points: Auto-calculated daily/weekly/monthly support and resistance levels
- Pivot Confluence Detection: Signals gain strength when price approaches key pivot levels
- Smart Warning System: Single-alert approach prevents label spam while highlighting critical S/R interactions
Table Dashboard
- Compact Signal Table: Real-time buy/sell signal strength with scoring system
- Market Context: Momentum status, nearest pivot level, volume and trend analysis
- Clean Visual Design: Minimal interface focused on actionable information
Intelligent Alerts
- Approach Warnings: Alerts when price nears resistance with overbought momentum or support with oversold momentum
- Confluence Signals: High-probability setups combining momentum extremes with pivot level proximity
- Single-Shot Logic: Prevents alert fatigue with smart reset mechanisms
Best Use Cases
- Swing Trading: Ideal for identifying major reversal points at key levels
- Risk Management: Clear warning system for potential turning points
- Multi-Asset Analysis: Works across forex, crypto, stocks, and commodities
- All Timeframes: Scalable from 5-minute charts to daily analysis
Designed for traders who value precision over noise - combining classical pivot analysis with modern momentum indicators for superior market timing.

Hurst Momentum Oscillator | AlphaNattHurst Momentum Oscillator | AlphaNatt
An adaptive oscillator that combines the Hurst Exponent - which identifies whether markets are trending or mean-reverting - with momentum analysis to create signals that automatically adjust to market regime.
"The Hurst Exponent reveals a hidden truth: markets aren't always trending. This oscillator knows when to ride momentum and when to fade it."
━━━━━━━━━━━━━━━━━━━━━━━━━━━━━━━━━━━━━━━━
📐 THE MATHEMATICS
Hurst Exponent (H):
Measures the long-term memory of time series:
H > 0.5: Trending (persistent) behavior
H = 0.5: Random walk
H < 0.5: Mean-reverting behavior
Originally developed for analyzing Nile river flooding patterns, now used in:
Fractal market analysis
Network traffic prediction
Climate modeling
Financial markets
The Innovation:
This oscillator multiplies momentum by the Hurst coefficient:
When trending (H > 0.5): Momentum is amplified
When mean-reverting (H < 0.5): Momentum is reduced
Result: Adaptive signals based on market regime
━━━━━━━━━━━━━━━━━━━━━━━━━━━━━━━━━━━━━━━━
💎 KEY ADVANTAGES
Regime Adaptive: Automatically adjusts to trending vs ranging markets
False Signal Reduction: Reduces momentum signals in mean-reverting markets
Trend Amplification: Stronger signals when trends are persistent
Mathematical Edge: Based on fractal dimension analysis
No Repainting: All calculations on historical data
━━━━━━━━━━━━━━━━━━━━━━━━━━━━━━━━━━━━━━━━
📊 TRADING SIGNALS
Visual Interpretation:
Cyan zones: Bullish momentum in trending market
Magenta zones: Bearish momentum or mean reversion
Background tint: Blue = trending, Pink = mean-reverting
Gradient intensity: Signal strength
Trading Strategies:
1. Trend Following:
Trade momentum signals when background is blue (trending)
2. Mean Reversion:
Fade extreme readings when background is pink
3. Regime Transition:
Watch for background color changes as early warning
━━━━━━━━━━━━━━━━━━━━━━━━━━━━━━━━━━━━━━━━
🎯 OPTIMAL USAGE
Best Conditions:
Strong trending markets (crypto bull runs)
Clear ranging markets (forex sessions)
Regime transitions
Multi-timeframe analysis
Market Applications:
Crypto: Excellent for identifying trend persistence
Forex: Detects when pairs are ranging
Stocks: Identifies momentum stocks
Commodities: Catches persistent trends
━━━━━━━━━━━━━━━━━━━━━━━━━━━━━━━━━━━━━━━━
Developed by AlphaNatt | Fractal Market Analysis
Version: 1.0
Classification: Adaptive Regime Oscillator
Not financial advice. Always DYOR.

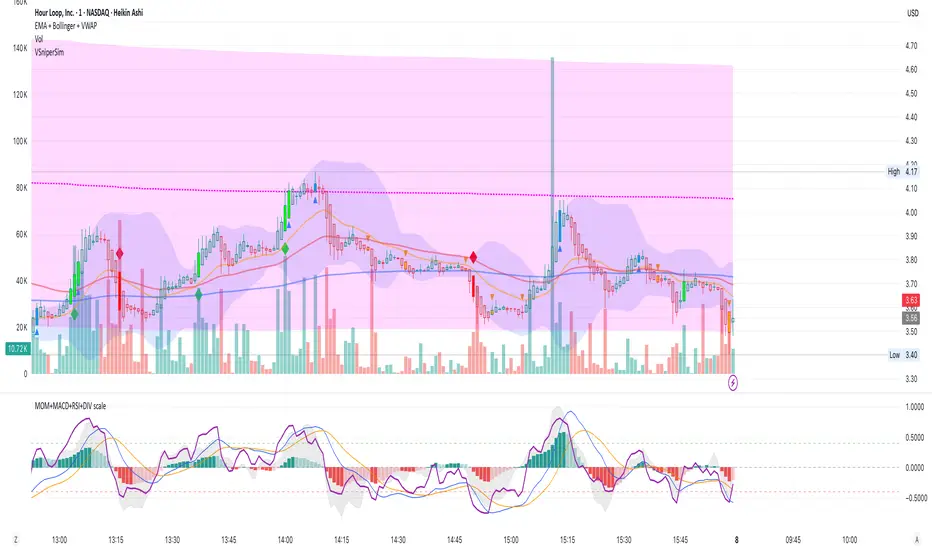
EMA + Bollinger + VWAP bySaMAll in one
EMA 20/50/200
BOLLINGER
VWAP
All in one for perfect market watching

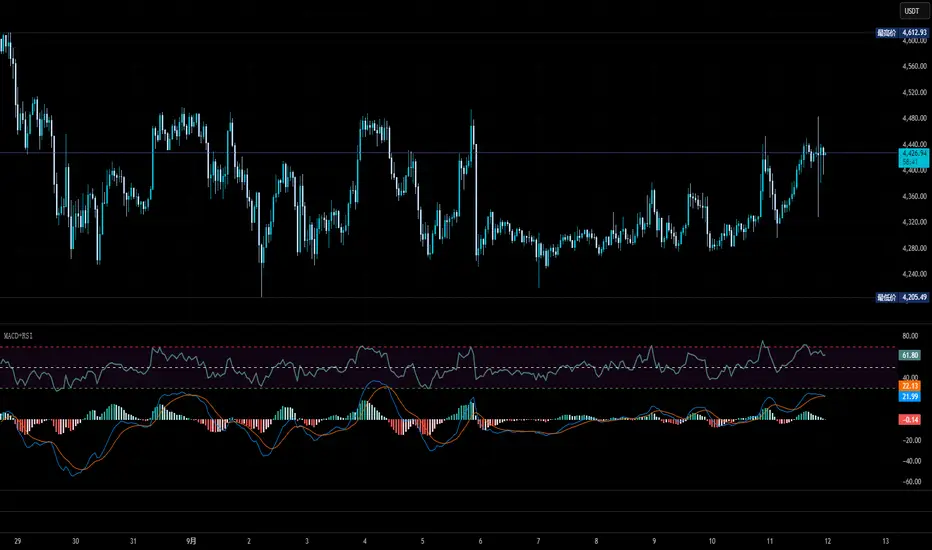
MOM + MACD + RSI + DIV bySaMAll indicators in ONE
MOMENTUM
MACD
RSI
DIVERGENCE
All in one scaled for perfect market watching
Ark FCI OscillatorFinancial Conditions Index Oscillator
This indicator tracks week-over-week changes in the National Financial Conditions Index (NFCI), providing a dynamic view of evolving financial conditions in the United States.
Overview
The National Financial Conditions Index (NFCI) is a comprehensive weekly composite index published by the Federal Reserve Bank of Chicago. It measures financial conditions across U.S. money markets, debt and equity markets, and the traditional and shadow banking systems.
Interpretation
Positive values indicate improving financial conditions
Negative values signal deteriorating financial conditions
Risk assets demonstrate particular sensitivity to changes in financial conditions, making this oscillator valuable for market timing and risk assessment.
Alternative Data Source
Users can modify the source to FRED:NFCIRISK to focus specifically on risk dynamics. The NFCIRISK subindex isolates volatility and funding risk measures within the financial sector, capturing market volatility indicators and liquidity shortage probabilities while excluding broader credit and leverage conditions.

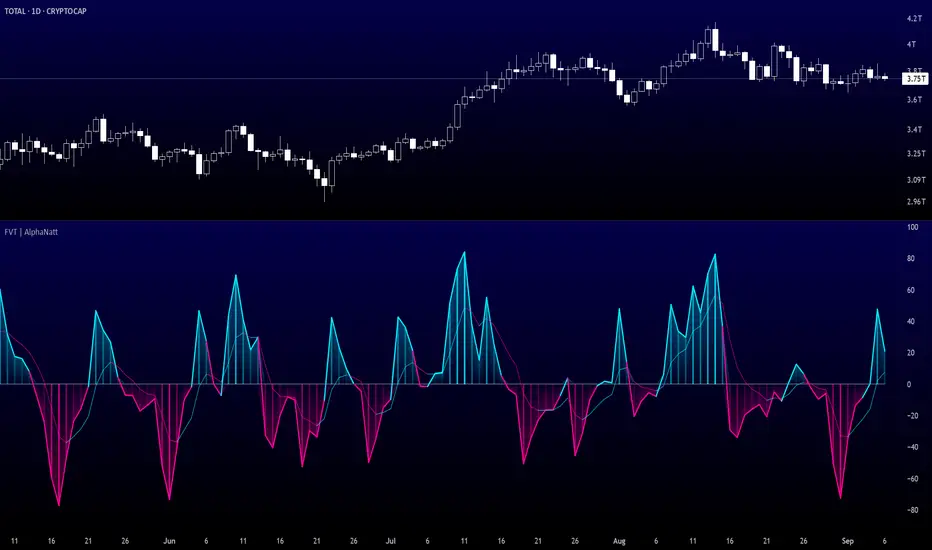
Fisher Volume Transform | AlphaNattFisher Volume Transform | AlphaNatt
A powerful oscillator that applies the Fisher Transform - converting price into a Gaussian normal distribution - while incorporating volume weighting to identify high-probability reversal points with institutional participation.
"The Fisher Transform reveals what statistics professors have known for decades: when you transform market data into a normal distribution, turning points become crystal clear."
━━━━━━━━━━━━━━━━━━━━━━━━━━━━━━━━━━━━━━━━
🎲 THE MATHEMATICS
Fisher Transform Formula:
The Fisher Transform converts any bounded dataset into a Gaussian distribution:
y = 0.5 × ln((1 + x) / (1 - x))
Where x is normalized price (-1 to 1 range)
Why This Matters:
Market extremes become statistically identifiable
Turning points are amplified and clarified
Removes the skew from price distributions
Creates nearly instantaneous signals at reversals
Volume Integration:
Unlike standard Fisher Transform, this version weights price by relative volume:
High volume moves get more weight
Low volume moves get filtered out
Identifies institutional participation
Reduces false signals from retail chop
━━━━━━━━━━━━━━━━━━━━━━━━━━━━━━━━━━━━━━━━
💎 KEY ADVANTAGES
Statistical Edge: Transforms price into normal distribution where extremes are mathematically defined
Volume Confirmation: Only signals with volume support
Early Reversal Detection: Fisher Transform amplifies turning points
Clean Signals: Gaussian distribution reduces noise
No Lag: Mathematical transformation, not averaging
━━━━━━━━━━━━━━━━━━━━━━━━━━━━━━━━━━━━━━━━
⚙️ SETTINGS OPTIMIZATION
Fisher Period (5-30):
5-9: Very sensitive, many signals
10: Default - balanced sensitivity
15-20: Moderate smoothing
25-30: Major reversals only
Volume Weight (0.1-1.0):
0.1-0.3: Minimal volume influence
0.5-0.7: Balanced price/volume
0.7: Default - strong volume weight
0.8-1.0: Volume dominant
━━━━━━━━━━━━━━━━━━━━━━━━━━━━━━━━━━━━━━━━
📊 TRADING SIGNALS
Primary Signals:
Zero Cross Up: Bullish momentum shift
Zero Cross Down: Bearish momentum shift
Signal Line Cross: Early reversal warning
Extreme Readings (±75): Potential reversal zones
Visual Interpretation:
Cyan zones: Bullish momentum
Magenta zones: Bearish momentum
Gradient intensity: Strength of move
Histogram: Raw momentum power
━━━━━━━━━━━━━━━━━━━━━━━━━━━━━━━━━━━━━━━━
🎯 OPTIMAL USAGE
Best Market Conditions:
Range-bound markets (reversals clear)
High volume periods
Major support/resistance levels
Divergence hunting
Trading Strategies:
1. Extreme Reversal:
Enter when oscillator exceeds ±75 and reverses
2. Zero Line Momentum:
Trade crosses of zero line with volume confirmation
3. Signal Line Strategy:
Early entry on signal line crosses
4. Divergence Trading:
Price makes new high/low but Fisher doesn't
━━━━━━━━━━━━━━━━━━━━━━━━━━━━━━━━━━━━━━━━
Developed by AlphaNatt | Quantitative Trading Systems
Version: 1.0
Classification: Statistical Transform Oscillator
Not financial advice. Always DYOR.