15m ORB Breakout NAS100 (5m Mgmt) v6 - OptimizedOpening Range Breakout Strategy
Buy and sell signals are given upon break of market session opening range. Best utilized for 30 minute NY opening range, managed on 5 min timeframe on NAS100. Tweak the settings for higher win rate on backtesting dashboard before implementing strategy.
Average True Range (ATR)

BB SPY Mean Reversion Investment StrategySummary
Mean reversion first, continuation second. This strategy targets equities and ETFs on daily timeframes. It waits for price to revert from a Bollinger location with candle and EMA agreement, then manages risk with ATR based exits. Uniqueness comes from two elements working together. One, an adaptive band multiplier driven by volatility of volatility that expands or contracts the envelope as conditions change. Two, a bias memory that re arms the same direction after any stop, target, or time exit until a true opposite signal appears. Add it to a clean chart, use the markers and levels, and select on bar close for conservative alerts. Shapes can move while the bar is open and settle on close.
Scope and intent
• Markets. Currently adapted for SPY, needs to be optimized for other assets
• Timeframes. Daily primary. Other frames are possible but not the default
• Default demo. SPY on daily
• Purpose. Trade mean reversion entries that can chain into a longer swing by splitting holds into ATR or time segments
Originality and usefulness
• Novelty. Adaptive band width from volatility of volatility plus a persistent bias array that keeps the original direction alive across sequential entries until an opposite setup is confirmed
• Failure modes mitigated. False starts in chop are reduced by candle color and EMA location. Missed continuation after a take profit or stop is addressed by the re arm engine. Oversized envelopes during quiet regimes are avoided by the adaptive multiplier
• Testability. Every module has Inputs and visible levels so users can see why a suggestion appears
• Portable yardstick. All risk and targets are expressed in ATR units
Method overview in plain language
The engine measures where price sits relative to Bollinger bands, confirms with candle color and EMA location, requires ADX for shorts(in our case long close since we use it currently as long only), and optionally requires a trend or mean reversion regime using band width percent rank and basis slope. Risk uses ATR for stop, target, and optional breakeven. A small array stores the last confirmed direction. While flat, the engine keeps a pending order in that direction. The array flips only when a true opposite setup appears.
Base measures
• Range basis. True Range smoothed over a user defined ATR Length
• Return basis. Not required
Components
• Bollinger envelope. SMA length and standard deviation multiplier. Entry is based on cross of close through the band with location bias
• Candle and EMA filter. Close relative to open and close relative to EMA align direction
• ADX gate for shorts. Requires minimum trend strength for short trades
• Adaptive multiplier. Band width scales using volatility of volatility so envelopes breathe with conditions
• Regime gate optional. Band width percent rank and basis slope identify trend or mean reversion regimes
• Risk manager. ATR stop, ATR target, optional breakeven, optional time exit
• Bias memory. Array stores last confirmed direction and re arms entries while flat
Fusion rule
Minimum satisfied gates count style. All required gates must be true. Optional gates are controlled in Inputs. Bias memory never overrides an opposite confirmed setup.
Signal rule
• Long setup when close crosses up through the lower band, the bar closes green, and close is above the long EMA
• Short setup when close crosses down through the upper band, the bar closes red, close is below the short EMA, and ADX is above the minimum
• While flat the model keeps a pending order in the stored direction until a true opposite setup appears
• IN LONG or IN SHORT describes states between entry and exit
What you will see on the chart
• Markers for Long and Short setups
• Exit markers from ATR or time rules
• Reference levels for entry, stop, and target
• Bollinger bands and optional adaptive bands
Inputs with guidance
Setup
• Signal timeframe. Uses the chart timeframe
• Invert direction optional. Flips long and short
Logic
• BB Length. Typical 10 to 50. Higher smooths more
• BB Mult. Typical 1.0 to 2.5. Higher widens entries
• EMA Length long. Typical 10 to 50
• EMA Length short. Typical 5 to 30
• ADX Minimum for short. Typical 15 to 35
Filters
• Regime Type. none or trend or mean reversion
• Rank Lookback. Typical 100 to 300
• Basis Slope Length and Threshold. Larger values reduce false trends
Risk
• ATR Length. Typical 10 to 21
• ATR Stop Mult. Typical 1.0 to 3.0
• ATR Take Profit Mult. Typical 2.0 to 5.0
• Breakeven Trigger R. Move stop to entry after the chosen multiple
• Time Exit. Minimum bars and extension when profit exceeds a fraction of ATR
Bias and rearm
• Bias flips kept. Array depth
• Keep rearm when flat. Maintain a pending order while flat
UI
• Show markers and levels. Clean defaults
Usage recipes
Alerts update in real time and can change while the bar forms. Select on bar close for conservative workflows.
Properties visible in this publication
• Initial capital 25000
• Base currency USD
• If any higher timeframe calls are enabled, request.security uses lookahead off
• Commission 0.03 percent
• Slippage 3 ticks
• Default order size method Percent of equity with value 5
• Pyramiding 0
• Process orders on close On
• Bar magnifier Off
• Recalculate after order is filled Off
• Calc on every tick Off
Realism and responsible publication
No performance claims. Costs and fills vary by venue. Shapes can move intrabar and settle on close. Strategies use standard candles only.
Honest limitations and failure modes
High impact releases and thin liquidity can break assumptions. Gap heavy symbols may require larger ATR. Very quiet regimes can reduce contrast in the mean reversion signal. If stop and target can both be touched inside one bar, outcome follows the TradingView order model for that bar path.
Regimes with extreme one sided trend and very low volatility can reduce mean reversion edges. Results vary by symbol and venue. Past results never guarantee future outcomes.
Open source reuse and credits
None.
Backtest realism
Costs are realistic for liquid equities. Sizing does not exceed five percent per trade by default. Any departure should be justified by the user.
If you got any questions please le me know

PSAR with ATR Trailing Stop + SMA Filter📈 Strategy Overview: PSAR + 6×ATR Trailing Stop with SMA Filter
This strategy is built around the principle of “Cut the losers, let the winners run” — a disciplined, trend-following approach that combines the Parabolic SAR indicator with dynamic risk management and a Simple Moving Average (SMA) trend filter.
🔍 Strategy Logic
Trend Filter Trades are only taken in the direction of the prevailing trend, defined by a user-selected SMA (default: 100).
✅ Long trades only when price is above the SMA
✅ Short trades only when price is below the SMA
Entry Signal: A trade is triggered when the Parabolic SAR flips to the opposite side of the price bars, signaling a potential trend reversal.
Stop Loss: The stop loss is dynamically set at 6×ATR from the entry price. This adapts to market volatility and is recalculated every bar — effectively acting as a trailing stop.
Exit Logic: There is no fixed take profit. The trade remains open until the trailing stop is hit — allowing winners to run and losers to be cut quickly.
Risk Management: Each trade risks 0.5% of total equity, ensuring consistent position sizing and capital preservation.
📊 Visual Elements
PSAR dots mark trend direction changes
SMA line shows the broader trend filter
Trailing stop crosses (with 50% opacity) indicate the current stop level without cluttering the chart
⚙️ Customizable Inputs
PSAR parameters: Start, Increment, Maximum
ATR length and multiplier
SMA length
Risk percentage per trade
This strategy is ideal for traders who want to stay aligned with the trend, automate disciplined exits, and avoid emotional decision-making. Clean, simple, and powerful.
Wishing you calm and successful trades!

Hyper SAR Reactor Trend StrategyHyperSAR Reactor Adaptive PSAR Strategy
Summary
Adaptive Parabolic SAR strategy for liquid stocks, ETFs, futures, and crypto across intraday to daily timeframes. It acts only when an adaptive trail flips and confirmation gates agree. Originality comes from a logistic boost of the SAR acceleration using drift versus ATR, plus ATR hysteresis, inertia on the trail, and a bear-only gate for shorts. Add to a clean chart and run on bar close for conservative alerts.
Scope and intent
• Markets: large cap equities and ETFs, index futures, major FX, liquid crypto
• Timeframes: one minute to daily
• Default demo: BTC on 60 minute
• Purpose: faster yet calmer PSAR that resists chop and improves short discipline
• Limits: this is a strategy that places simulated orders on standard candles
Originality and usefulness
• Novel fusion: PSAR AF is boosted by a logistic function of normalized drift, trail is monotone with inertia, entries use ATR buffers and optional cooldown, shorts are allowed only in a bear bias
• Addresses false flips in low volatility and weak downtrends
• All controls are exposed in Inputs for testability
• Yardstick: ATR normalizes drift so settings port across symbols
• Open source. No links. No solicitation
Method overview
Components
• Adaptive AF: base step plus boost factor times logistic strength
• Trail inertia: one sided blend that keeps the SAR monotone
• Flip hysteresis: price must clear SAR by a buffer times ATR
• Volatility gate: ATR over its mean must exceed a ratio
• Bear bias for shorts: price below EMA of length 91 with negative slope window 54
• Cooldown bars optional after any entry
• Visual SAR smoothing is cosmetic and does not drive orders
Fusion rule
Entry requires the internal flip plus all enabled gates. No weighted scores.
Signal rule
• Long when trend flips up and close is above SAR plus buffer times ATR and gates pass
• Short when trend flips down and close is below SAR minus buffer times ATR and gates pass
• Exit uses SAR as stop and optional ATR take profit per side
Inputs with guidance
Reactor Engine
• Start AF 0.02. Lower slows new trends. Higher reacts quicker
• Max AF 1. Typical 0.2 to 1. Caps acceleration
• Base step 0.04. Typical 0.01 to 0.08. Raises speed in trends
• Strength window 18. Typical 10 to 40. Drift estimation window
• ATR length 16. Typical 10 to 30. Volatility unit
• Strength gain 4.5. Typical 2 to 6. Steepness of logistic
• Strength center 0.45. Typical 0.3 to 0.8. Midpoint of logistic
• Boost factor 0.03. Typical 0.01 to 0.08. Adds to step when strength rises
• AF smoothing 0.50. Typical 0.2 to 0.7. Adds inertia to AF growth
• Trail smoothing 0.35. Typical 0.15 to 0.45. Adds inertia to the trail
• Allow Long, Allow Short toggles
Trade Filters
• Flip confirm buffer ATR 0.50. Typical 0.2 to 0.8. Raise to cut flips
• Cooldown bars after entry 0. Typical 0 to 8. Blocks re entry for N bars
• Vol gate length 30 and Vol gate ratio 1. Raise ratio to trade only in active regimes
• Gate shorts by bear regime ON. Bear bias window 54 and Bias MA length 91 tune strictness
Risk
• TP long ATR 1.0. Set to zero to disable
• TP short ATR 0.0. Set to 0.8 to 1.2 for quicker shorts
Usage recipes
Intraday trend focus
Confirm buffer 0.35 to 0.5. Cooldown 2 to 4. Vol gate ratio 1.1. Shorts gated by bear regime.
Intraday mean reversion focus
Confirm buffer 0.6 to 0.8. Cooldown 4 to 6. Lower boost factor. Leave shorts gated.
Swing continuation
Strength window 24 to 34. ATR length 20 to 30. Confirm buffer 0.4 to 0.6. Use daily or four hour charts.
Properties visible in this publication
Initial capital 10000. Base currency USD. Order size Percent of equity 3. Pyramiding 0. Commission 0.05 percent. Slippage 5 ticks. Process orders on close OFF. Bar magnifier OFF. Recalculate after order filled OFF. Calc on every tick OFF. No security calls.
Realism and responsible publication
No performance claims. Past results never guarantee future outcomes. Shapes can move while a bar forms and settle on close. Strategies execute only on standard candles.
Honest limitations and failure modes
High impact events and thin books can void assumptions. Gap heavy symbols may prefer longer ATR. Very quiet regimes can reduce contrast and invite false flips.
Open source reuse and credits
Public domain building blocks used: PSAR concept and ATR. Implementation and fusion are original. No borrowed code from other authors.
Strategy notice
Orders are simulated on standard candles. No lookahead.
Entries and exits
Long: flip up plus ATR buffer and all gates true
Short: flip down plus ATR buffer and gates true with bear bias when enabled
Exit: SAR stop per side, optional ATR take profit, optional cooldown after entry
Tie handling: stop first if both stop and target could fill in one bar

Turtle Strategy - Triple EMA Trend with ADX and ATRDescription
The Triple EMA Trend strategy is a directional momentum system built on the alignment of three exponential moving averages and a strong ADX confirmation filter. It is designed to capture established trends while maintaining disciplined risk management through ATR-based stops and targets.
Core Logic
The system activates only under high-trend conditions, defined by the Average Directional Index (ADX) exceeding a configurable threshold (default: 43).
A bullish setup occurs when the short-term EMA is above the mid-term EMA, which in turn is above the long-term EMA, and price trades above the fastest EMA.
A bearish setup is the mirror condition.
Execution Rules
Entry:
• Long when ADX confirms trend strength and EMA alignment is bullish.
• Short when ADX confirms trend strength and EMA alignment is bearish.
Exit:
• Stop Loss: 1.8 × ATR below (for longs) or above (for shorts) the entry price.
• Take Profit: 3.3 × ATR in the direction of the trade.
Both parameters are configurable.
Additional Features
• Start/end date inputs for controlled backtesting.
• Selective activation of long or short trades.
• Built-in commission and position sizing (percent of equity).
• Full visual representation of EMAs, ADX, stop-loss, and target levels.
This strategy emphasizes clean trend participation, strict entry qualification, and consistent reward-to-risk structure. Ideal for swing or medium-term testing across trending assets.

VWAP Trend Strategy (Intraday) [KedarArc Quant]Description:
An intraday strategy that anchors to VWAP and only trades when a local EMA trend gate and a volume participation gate are both open. It offers two entry templates—Cross and Cross-and-Retest—with an optional Momentum Exception for impulsive moves. Exits combine a TrendBreak (structure flips) with an ATR emergency stop (risk cap).
Updates will be published under this script.
Why this merits a new script
This is not a simple “VWAP + EMA + ATR” overlay. The components are sequenced as gates and branches that *change the trade set* in ways a visual mashup cannot:
1. Trend Gate first (EMA fast vs. slow on the entry timeframe)
Counter-trend VWAP crosses are suppressed. Many VWAP scripts fire on every cross; here, no entry logic even evaluates unless the trend gate is open.
2. Participation Gate second (Volume SMA × multiplier)
This gate filters thin liquidity moves around VWAP. Without it, the same visuals would produce materially more false triggers.
3. Branching entries with structure awareness
* Cross: Immediate VWAP cross in the trend direction.
* Cross-and-Retest: Requires a revisit to VWAP vicinity within a lookback window (recent low near VWAP for longs; recent high for shorts). This explicitly removes first-touch fakeouts that a plain cross takes.
* Momentum Exception (optional): A quantified body% + volume condition can bypass the retest when flow is impulsive—intentional risk-timing, not “just another indicator.”
4. Dual exits that reference both anchor and structure
* TrendBreak: Close only when price loses VWAP and EMA alignment flips.
* ATR stop: Placed at entry to cap tail risk.
These exits complement the entry structure rather than being generic stop/target add-ons.
What it does
* Trades the session’s fair value anchor (VWAP), but only with local-trend agreement (EMA fast vs. slow) and sufficient participation (volume filter).
* Lets you pick Cross or Cross-and-Retest entries; optionally allow a fast Momentum Exception when candles expand with volume.
* Manages positions with a structure exit (TrendBreak) and an emergency ATR stop from entry.
How it works (concepts & calculations)
* VWAP (session anchor):
Standard VWAP of the active session; entries reference the cross and the retest proximity to VWAP.
* Trend gate:
Long context only if `EMA(fast) > EMA(slow)`; short only if `EMA(fast) < EMA(slow)`.
A *gate*, not a trigger—entries aren’t considered unless this is true.
* Participation (volume) gate:
Require `volume > SMA(volume, volLen) × volMult`.
Screens out low-participation wiggles around VWAP.
Entries:
* Cross: Price crosses VWAP in the trend direction while volume gate is open.
* Cross-and-Retest: After crossing, price revisits VWAP vicinity within `lookback` (recent *low near VWAP* for longs; recent *high near VWAP* for shorts).
* Momentum Exception (optional): If body% (|close−open| / range) and volume exceed thresholds, enter without waiting for the retest.
Exits:
* TrendBreak (structure):
* Longs close when `price < VWAP` and `EMA(fast) < EMA(slow)` (mirror for shorts).
* ATR stop (risk):
* From entry: `stop = entry ± ATR(atrLen) × atrMult`.
How to use it ?
1. Select market & timeframe: Intraday on liquid symbols (equities, futures, crypto).
2. Pick entry mode:
* Start with Cross-and-Retest for fewer, more selective signals.
* Enable Momentum Exception if strong moves leave without retesting.
3. Tune guards:
* Raise `volMult` to ignore thin periods; lower it for more activity.
* Adjust `lookback` if retests come late/early on your symbol.
4. Risk:
* `atrLen` and `atrMult` set the emergency stop distance.
5. Read results per session: Optional panel (if enabled) summarizes Net-R, Win%, and PF for today’s session to evaluate
behavior regime by regime.
⚠️ Disclaimer
This script is provided for educational purposes only.
Past performance does not guarantee future results.
Trading involves risk, and users should exercise caution and use proper risk management when applying this strategy.

Gann Fan Strategy [KedarArc Quant]Description
A single-concept, rule-based strategy that trades around a programmatic Gann Fan.
It anchors to a swing (or a manual point), builds 1×1 and related fan lines numerically, and triggers entries when price interacts with the 1×1 (breakout or bounce). Management is done entirely with the fan structure (next/previous line) plus optional ATR trailing.
What TV indicators are used
* Pivots: `ta.pivothigh/ta.pivotlow` to confirm swing highs/lows for anchor selection.
* ATR: `ta.atr` only to scale the 1×1 slope (optional) and for an optional trailing stop.
* EMA: `ta.ema` as a trend filter (e.g., only long above the EMA, short below).
No RSI/MACD/Stoch/Heikin/etc. The logic is one coherent framework: Gann price–time geometry, with ATR as a scale and EMA as a risk filter.
How it works
1. Anchor
* Auto: chooses the most recent *confirmed* pivot (you control Left/Right).
* Manual: set a price and bar index and the fan will hold that point (no re-anchoring).
* Optional Re-anchor when a newer pivot confirms.
2. 1×1 Slope (numeric, not cosmetic)
* ATR mode: `1×1 = ATR(Length) × Multiplier` (adapts to volatility).
* Fixed mode: `ticks per bar` (constant slope).
Because slope is numeric, it doesn’t change with chart zoom, unlike the drawing tool.
3. Fan Lines
Builds classic ratios around the 1×1: 1/8, 1/4, 1/3, 1/2, 1/1, 2/1, 3/1, 4/1, 8/1.
4. Signals
* Breakout: cross of price over/under the 1×1 in the EMA-aligned direction.
* Bounce (optional): touch + reversal across the 1×1 to reduce whipsaw.
5. Exits & Risk
* Take-profit at the next fan line; Stop at the previous fan line.
* If a level is missing (right after re-anchor), a fallback Risk-Reward (RR) is used.
* Optional ATR trailing stop.
Why this is unique
* True numeric fan: The 1×1 slope is calculated from ATR or fixed ticks—not from screen geometry—so it is scale-invariant and reproducible across users/timeframes.
* Deterministic anchor logic: Uses confirmed pivots (with your L/R settings). No look-ahead; anchors update only when the right bars complete.
* Fan-native trade management: Both entries and exits come from the fan structure itself (with a minimal ATR/EMA assist), keeping the method pure.
* Two entry archetypes: Breakout for momentum days; Bounce for range days—switchable without changing the core model.
* Manual mode: Lock a session’s bias by anchoring to a chosen swing (e.g., day’s first major low/high) and keep the fan constant all day.
Inputs (quick guide)
* Auto Anchor (Left/Right): pivot sensitivity. Higher values = fewer, stronger anchors.
* Re-anchor: refresh to newer pivots as they confirm.
* Manual Anchor Price / Bar Index: fixes the fan (turn Auto off).
* Scale 1×1 by ATR: on = adaptive; off = use ticks per bar.
* ATR Length / ATR Multiplier: controls adaptive slope; start around 14 / 0.25–0.35.
* Ticks per bar: exact fixed slope (match a hand-drawn fan by computing slope ÷ mintick).
* EMA Trend Filter: e.g., 50–100; trades only in EMA direction.
* Use Bounce: require touch + reverse across 1×1 (helps in chop).
* TP/SL at fan lines; Fallback RR for missing levels; ATR Trailing Stop optional.
* Transparency/Plot EMA: visual preferences.
Tips
* Range days: larger pivots (L/R 8–12), Bounce ON, ATR Multiplier \~0.30–0.40, EMA 100.
* Trend days: L/R 5–6, Breakout, Multiplier \~0.20–0.30, EMA 50, ATR trail 1.0–1.5.
* Match the TV Gann Fan drawing: turn ATR scale OFF, set ticks per bar = `(Δprice between anchor and 1×1 target) / (bars) / mintick`.
Repainting & testing notes
* Pivots require Right bars to confirm; anchors are set after confirmation (no look-ahead).
* Signals use the current bar close with TradingView strategy mechanics; real-time vs. bar-close can differ slightly, as with any strategy.
* Re-anchoring legitimately moves the structure when new pivots confirm—by design.
⚠️ Disclaimer
This script is provided for educational purposes only.
Past performance does not guarantee future results.
Trading involves risk, and users should exercise caution and use proper risk management when applying this strategy.

Instant Breakout Strategy with RSI & VWAPInstant Breakout Strategy with RSI & VWAP
This TradingView strategy (Pine Script v6) trades breakouts using pivot points, with optional filters for volume, momentum, RSI, and VWAP. It’s optimized for the 1-second timeframe.
Overview
The strategy identifies breakouts when price crosses above resistance (pivot highs) or below support (pivot lows). It can use basic pivot breakouts or add filters for stronger signals. Take-profit and stop-loss levels are set using ATR, and signals are shown on the chart.
Inputs
Left/Right Pivot Bars: Bars to detect pivots (default: 3). Lower values increase sensitivity.
Volume Surge Multiplier: Volume threshold vs. 20-period average (default: 1.5).
Momentum Threshold: Minimum % price change from bar open (default: 1%).
Take-Profit ATR Multiplier: ATR multiplier for take-profit (default: 9.0).
Stop-Loss ATR Multiplier: ATR multiplier for stop-loss (default: 1.0).
Use Filters: Enable/disable volume, momentum, RSI, and VWAP filters (default: off).
How It Works
1. Pivot Detection
Finds pivot highs (resistance) and lows (support) using ta.pivothigh and ta.pivotlow.
Tracks the latest pivot levels.
2. Volume Surge
Compares current volume to a 20-period volume average.
A surge occurs if volume exceeds the average times the multiplier.
3. Momentum
Measures price change from the bar’s open.
Bullish: Price rises >1% from open.
Bearish: Price falls >1% from open.
4. RSI and VWAP
RSI: 3-period RSI. Above 50 is bullish; below 50 is bearish.
VWAP: Price above VWAP is bullish; below is bearish.
5. ATR
14-period ATR sets take-profit (close ± atr * 9.0) and stop-loss (close ± atr * 1.0).
Trading Rules
Breakout Conditions
Bullish Breakout:
Price crosses above the latest pivot high.
With filters: Volume surge, bullish momentum, RSI > 50, price > VWAP.
Without filters: Only the crossover is needed.
Bearish Breakout:
Price crosses below the latest pivot low.
With filters: Volume surge, bearish momentum, RSI < 50, price < VWAP.
Without filters: Only the crossunder is needed.
Entries and Exits
Long: Enter on bullish breakout. Set take-profit and stop-loss. Close any short position.
Short: Enter on bearish breakout. Set take-profit and stop-loss. Close any long position.
Visuals
Signals: Green triangles (bullish) below bars, red triangles (bearish) above bars.
Pivot Levels: Green line (resistance), red line (support).
Indicators: RSI (blue, separate pane), VWAP (purple, on chart).
How to Use
Apply to a 1-second chart in TradingView for best results.
Adjust inputs (e.g., pivot bars, multipliers). Enable filters for stricter signals.
Watch for buy/sell triangles and monitor RSI/VWAP.
Use ATR-based take-profit/stop-loss for risk management.
Notes
Best on 1-second timeframe due to fast RSI and responsiveness.
Disable filters for more signals (less confirmation).
Backtest before live trading to check performance.
This strategy uses pivots, volume, momentum, RSI, and VWAP for clear breakout trades on the 1-second timeframe.

Market Open Impulse [LuciTech]Market Open Impulse Strategy
The Market Open Impulse Strategy is designed to capture significant price movements that occur at market open (2:30 PM UK time). This strategy identifies impulsive candles with high volatility and enters trades based on the direction and strength of the initial market reaction.
How It Works:
The strategy activates exclusively at 2:30 PM UK time during market open sessions. It uses ATR-based volatility filtering to identify impulsive candles that exceed a configurable multiplier (default 1.5x ATR). Long entries are triggered when an impulsive candle closes above its midpoint and above the opening price, while short entries occur when an impulsive candle closes below its midpoint and below the opening price.
Risk management is handled through precise stop loss placement at the opposite extreme of the impulse candle (high for short positions, low for long positions). Take profit levels are calculated using a configurable risk-reward ratio with a default setting of 3:1. Position sizing is automatically calculated based on the percentage risk per trade, and an optional breakeven feature can move the stop loss to the entry price at specified profit levels.
The strategy incorporates time-based filtering to ensure trades only occur during the specified market open window. Visual indicators highlight qualifying impulsive candles and plot all entry and exit levels for clear trade management. The system offers flexible risk management with customizable risk percentage, risk-reward ratios, and breakeven settings, along with multiple stop loss calculation methods including both ATR-based and candle-based options.
Key Parameters:
Market open timing is fully configurable through hour and minute settings for strategy activation. The impulse ATR multiple sets the minimum volatility threshold required for trade qualification, with visual highlighting available for qualifying setups. Risk management parameters include the percentage of account equity to risk per trade, target profit multiples relative to initial risk, and the profit level threshold for breakeven stop loss adjustment. Users can choose between ATR-based or candle-based stop loss calculation methods and adjust technical parameters for volatility calculation including ATR length and smoothing methods.
Applications:
This strategy is particularly effective for trading market open volatility and momentum, capturing institutional order flow during key timing windows, executing short-term swing trades on significant price impulses, and trading markets with predictable opening patterns and consistent volatility characteristics.

Options Strategy V2.0📈 Options Strategy V2.0 – Intraday Reversal-Resilient Momentum System
Overview:
This strategy is designed specifically for intraday SPY, TSLA, MSFT, etc. options trading (0DTE or 1DTE), using high-probability signals derived from a confluence of technical indicators: EMA crossovers, RSI thresholds, ATR-based risk control, and volume spikes. The strategy aims to capture strong directional moves while avoiding overtrading, thanks to a built-in cooldown logic and optional time/session filters.
⚙️ Core Concept
The strategy executes trades only in the direction of the prevailing trend, determined by short- and long-term Exponential Moving Averages (EMA). Entry signals are generated when the Relative Strength Index (RSI) confirms momentum in the direction of the trend, and volume spikes suggest institutional activity.
To increase adaptability and user control, it includes a highly customizable parameter set for both long and short entries independently.
📌 Key Features
✅ Trend-Following Logic
Long entries are only allowed when EMA(short) > EMA(long)
Short entries are only allowed when EMA(short) < EMA(long)
✅ RSI Confirmation
Long: Requires RSI crossover above a configurable threshold
Short: Requires RSI crossunder below a configurable threshold
Optional rejection filters: Entry blocked above/below specific RSI extremes
✅ Volume Spike Filter
Confirms institutional participation by comparing current volume to an average multiplied by a user-defined factor.
✅ ATR-Based Risk Management
Both Stop Loss (SL) and Take Profit (TP) are dynamically calculated using ATR × a multiplier.
TP/SL ratio is fully configurable.
✅ Cooldown Control
After every trade, the system waits for a set number of bars before allowing new entries.
This prevents overtrading and increases signal quality.
Optionally, cooldown is ignored for reversal trades, ensuring the system can react immediately to a confirmed trend change.
✅ Candle Body Filter (Noise Control)
Avoids trades on candles with too small bodies relative to wicks (often noise or indecision candles).
✅ VWAP Confirmation (Optional)
Ensures price is trading above VWAP for long entries, or below for short entries.
✅ Time & Session Filters
Trades only during regular market hours (09:30–16:00 EST).
No-trade zone (e.g., 14:15–15:45 EST) to avoid low-liquidity traps or late-day whipsaws.
✅ End-of-Day Auto Close
All open positions are force-closed at 15:55 EST, protecting against overnight risk (especially relevant for 0DTE options).
📊 Visual Aids
EMA plots show trend direction
VWAP line provides real-time mean-reversion context
Stop Loss and Take Profit lines appear dynamically with each trade
Alerts notify of entry signals and exit triggers
🔧 Customization Panel
Nearly every element of the strategy can be tailored:
EMA lengths (short and long, for both sides)
RSI thresholds and length
ATR length, SL multiplier, and TP/SL ratio
Volume spike sensitivity
Minimum EMA distance filter
Candle body ratio filter
Session restrictions
Cooldown logic (duration + reversal exception)
This makes the strategy extremely versatile, allowing both conservative and aggressive configurations depending on the trader’s profile and the market context.
📌 Example Use Case: SPY Options (0DTE or 1DTE)
This system was designed and tested specifically for SPY and other intraday options trading, where:
Delta is around 0.50 or higher
Trades are short-lived (often 1–5 candles)
You aim to trade 1–3 signals per day, filtering out weak entries
🚫 Important Notes
It is not a scalping strategy; it relies on confirmed breakouts with trend support
No pyramiding or re-entries without cooldown to preserve risk integrity
Should be used with real-time alerts and manual broker execution
📈 Alerts Included
📈 Long Entry Signal
📉 Short Entry Signal
⚠️ Auto-closed all positions at 15:55 EST
✅ Proven Settings – Real Trades + Backtest Results
The current version of the strategy includes the optimal settings I’ve arrived at through extensive backtesting, as well as 3 months of real trading with consistent profitability. These results reflect real-world execution under live market conditions using 0DTE SPY options, with disciplined trade management and risk control.
🧠 Final Thoughts
Options Strategy V2.0 is a robust, highly tunable intraday strategy that blends momentum, trend-following, and volume confirmation. It is ideal for disciplined traders focused on SPY or other 0DTE/1DTE options, and it includes guardrails to reduce false signals and improve execution timing.
Perfect for those who seek precision, flexibility, and risk-defined setups—not blind automation.

SuperTrend Strategy with Trend-Based Exits🟩 SuperTrend Strategy with Trend-Based Exits
This is a fully automated trend-following strategy based on the popular SuperTrend indicator, enhanced with a position sizing algorithm tied to stop-loss distance and dynamic entry/exit rules. The strategy is designed for futures trading with an emphasis on sustainable risk, realistic backtesting, and transparent logic.
🧠 Concept and Methodology
The strategy uses the SuperTrend indicator, which is derived from ATR (Average True Range) and is widely used to capture medium- to long-term market trends.
Key features:
✅ Entries are triggered only when the SuperTrend direction changes (trend reversal).
✅ Exits are performed using a dynamic stop-loss placed at the SuperTrend line.
✅ Position size is automatically calculated based on the trader’s fixed dollar risk per trade and the current distance to the stop-loss.
✅ Rounding logic is included to ensure quantity is valid for the exchange’s lot size.
This strategy does not use any take-profit or classic trailing stop — the position is only closed when the trend reverses or the stop is hit by touching the SuperTrend line.
⚙️ Default Parameters
ATR Length: 300
Factor: 7.5
Risk per trade: $90 (3% of the default $3,000 capital)
Lot step: 10
Commission: 0.05%
These default parameters are not universal. They were optimized specifically for STXUSDT swap at 15M timeframe at Bybit and may not produce viable results on other pairs and timeframes.
Users are encouraged to customize the settings according to specific asset’s volatility, timeframe and other characteristics.
❗ These default settings yield meaningful backtesting results on STXUSDT with a reasonable number of trades (105+) over 7-month period. If applied to other assets, results may vary significantly.
📈 Position Sizing Logic
The strategy uses a dynamic position sizing formula:
Pine Script®
position_size = floor((risk_per_trade / stop_loss_distance) / lot_step) * lot_step
This ensures the trader always risks a fixed dollar amount per trade and never exceeds a sustainable equity exposure (recommended 2% or less).
✅ Realism in Backtesting
To ensure realistic and non-misleading backtest results, this strategy includes:
— Slippage and commission settings matching average exchange conditions (commission = 0.05%, slippage 5 ticks).
— Position sizing based on stop-loss distance (not fixed contract quantity).*
— A fixed risk-per-trade model that adheres to responsible capital management principles.
— This is in compliance with TradingView's Script publishing rules and House Rules.
📌 How to Use
Apply the strategy to a clean chart (preferably 15M for STXUSDT by default).
If using another asset, adjust:
- ATR Length
- Factor
- Risk per trade
- Qty step (lot precision for the symbol)
Avoid using with other indicators unless you understand their purpose.
Use the Strategy Tester to evaluate performance and optimize parameters.
⚠️ Disclaimer
This is not financial advice. Always perform forward testing and assess risk before deploying any strategy on live capital. The strategy is designed for educational and experimental use.

Ultimate Scalping Strategy v2Strategy Overview
This is a versatile scalping strategy designed primarily for low timeframes (like 1-min, 3-min, or 5-min charts). Its core logic is based on a classic EMA (Exponential Moving Average) crossover system, which is then filtered by the VWAP (Volume-Weighted Average Price) to confirm the trade's direction in alignment with the market's current intraday sentiment.
The strategy is highly customizable, allowing traders to add layers of confirmation, control trade direction, and manage exits with precision.
Core Strategy Logic
The strategy's entry signals are generated when two primary conditions are met simultaneously:
Momentum Shift (EMA Crossover): It looks for a crossover between a fast EMA (default length 9) and a slow EMA (default length 21).
Buy Signal: The fast EMA crosses above the slow EMA, indicating a potential shift to bullish momentum.
Sell Signal: The fast EMA crosses below the slow EMA, indicating a potential shift to bearish momentum.
Trend/Sentiment Filter (VWAP): The crossover signal is only considered valid if the price is on the "correct" side of the VWAP.
For a Buy Signal: The price must be trading above the VWAP. This confirms that, on average, buyers are in control for the day.
For a Sell Signal: The price must be trading below the VWAP. This confirms that sellers are generally in control.
Confirmation Filters (Optional)
To increase the reliability of the signals and reduce false entries, the strategy includes two optional confirmation filters:
Price Action Filter (Engulfing Candle): If enabled (Use Price Action), the entry signal is only valid if the crossover candle is also an "engulfing" candle.
A Bullish Engulfing candle is a large green candle that completely "engulfs" the body of the previous smaller red candle, signaling strong buying pressure.
A Bearish Engulfing candle is a large red candle that engulfs the previous smaller green candle, signaling strong selling pressure.
Volume Filter (Volume Spike): If enabled (Use Volume Confirmation), the entry signal must be accompanied by a surge in volume. This is confirmed if the volume of the entry candle is greater than its recent moving average (default 20 periods). This ensures the move has strong participation behind it.
Exit Strategy
A position can be closed in one of three ways, creating a comprehensive exit plan:
Stop Loss (SL): A fixed stop loss is set at a level determined by a multiple of the Average True Range (ATR). For example, a 1.5 multiplier places the stop 1.5 times the current ATR value away from the entry price. This makes the stop dynamic, adapting to market volatility.
Take Profit (TP): A fixed take profit is also set using an ATR multiplier. By setting the TP multiplier higher than the SL multiplier (e.g., 2.0 for TP vs. 1.5 for SL), the strategy aims for a positive risk-to-reward ratio on each trade.
Exit on Opposite Signal (Reversal): If enabled, an open position will be closed automatically if a valid entry signal in the opposite direction appears. For example, if you are in a long trade and a valid short signal occurs, the strategy will exit the long position immediately. This feature turns the strategy into more of a reversal system.
Key Features & Customization
Trade Direction Control: You can enable or disable long and short trades independently using the Allow Longs and Allow Shorts toggles. This is useful for trading in harmony with a higher-timeframe trend (e.g., only allowing longs in a bull market).
Visual Plots: The strategy plots the Fast EMA, Slow EMA, and VWAP on the chart for easy visualization of the setup. It also plots up/down arrows to mark where valid buy and sell signals occurred.
Dynamic SL/TP Line Plotting: A standout feature is that the strategy automatically draws the exact Stop Loss and Take Profit price lines on the chart for every active trade. These lines appear when a trade is entered and disappear as soon as it is closed, providing a clear visual of your risk and reward targets.
Alerts: The script includes built-in alertcondition calls. This allows you to create alerts in TradingView that can notify you on your phone or execute trades automatically via a webhook when a long or short signal is generated.

Advanced Supertrend StrategyA comprehensive Pine Script v5 strategy featuring an enhanced Supertrend indicator with multiple technical filters, risk management, and advanced signal confirmation for automated trading on TradingView.
## Features
- **Enhanced Supertrend**: Configurable ATR-based trend following with improved accuracy
- **RSI Filter**: Optional RSI-based signal filtering to avoid overbought/oversold conditions
- **Moving Average Filter**: Trend confirmation using SMA/EMA/WMA with customizable periods
- **Risk Management**: Built-in stop-loss and take-profit based on ATR multiples
- **Trend Strength Analysis**: Filters weak signals by requiring minimum trend duration
- **Breakout Confirmation**: Optional price breakout validation for stronger signals
- **Visual Interface**: Comprehensive chart plotting with multiple indicator overlays
- **Advanced Alerts**: Multiple alert conditions with detailed signal information
- **Backtesting**: Full strategy backtesting with commission and realistic execution

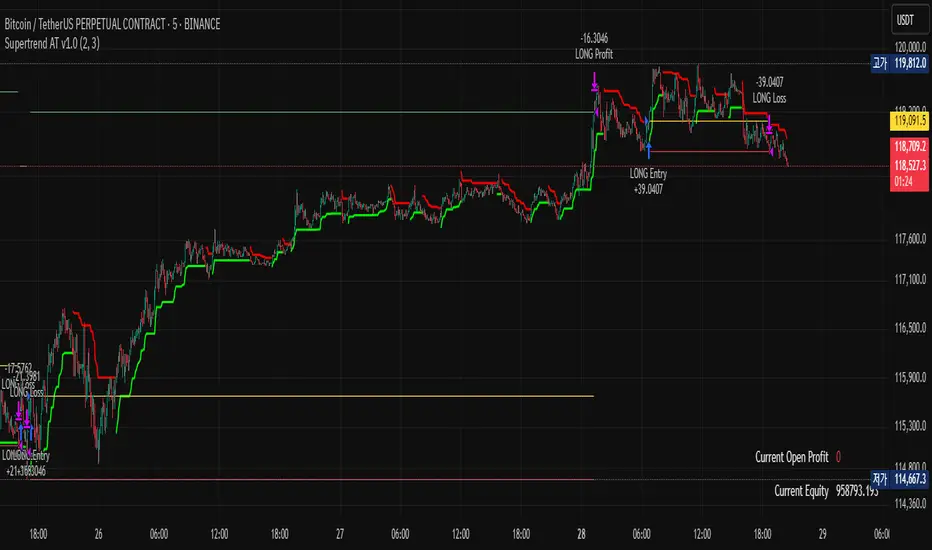
Supertrend AT v1.0### Overview
"Supertrend AT v1.0" is an automated trading strategy based on the Supertrend indicator, designed to detect trend reversals and execute entries accordingly. This script supports both **long and short** positions and includes customizable risk management features such as **RPT (Risk Per Trade)** and **RR (Risk/Reward ratio)**.
### Key Features
- 📈 **Supertrend-based Entry Logic**:
- Enters a **long position** when the Supertrend flips from red to green (downtrend → uptrend).
- Enters a **short position** when the Supertrend flips from green to red (uptrend → downtrend).
- 💰 **Auto-Calculated Position Sizing**:
- Quantity is automatically calculated to ensure that loss per trade (including commission) matches the specified risk percentage (RPT).
- 🎯 **Take-Profit and Stop-Loss**:
- Both targets are dynamically computed using the RR ratio and account for commission fees.
- 📊 **Visual Elements**:
- Entry, stop, and target prices are plotted on the chart.
- Real-time PnL and account equity are shown in a dashboard.
- Optional on-screen README guide explains the strategy and key terms.
### Inputs
- **RPT (%)**: Risk per transaction (based on account equity).
- **RR**: Reward-to-risk ratio.
- **Commission (%)**: Used in all calculations (must match the Properties tab).
- **Supertrend Settings**: Adjustable factor and length.
- **Market Decimal Places**: For accurate quantity rounding according to exchange rules.
- **Time Filter**: Set start and end time for trading logic activation.
### Risk Management Logic
This strategy calculates trade size and targets using a formula that considers both the price distance between entry and stop-loss and the effect of commission fees. This ensures:
- Consistent risk across trades
- Realistic take-profit levels
- Exchange-compliant order quantities
### Notes
- ⚠️ Be sure to set the **correct commission rate** and **decimal precision** for your exchange.
- ⚠️ If trade quantity is smaller than your exchange’s minimum unit, orders may be rejected.
- 🔧 For strategy to behave as intended in automation, double-check both **input tab** and **Properties tab** settings.
### Disclaimer
This strategy is for educational and research purposes only. It does not constitute financial advice. Always test on paper before using in a live environment.
Options Strategy V1.3📈 Options Strategy V1.3 — EMA Crossover + RSI + ATR + Opening Range
Overview:
This strategy is designed for short-term directional trades on large-cap stocks or ETFs, especially when trading options. It combines classic trend-following signals with momentum confirmation, volatility-based risk management, and session timing filters to help identify high-probability entries with predefined stop-loss and profit targets.
🔍 Strategy Components:
EMA Crossover (Fast/Slow)
Entry signals are triggered by the crossover of a short EMA above or below a long EMA — a traditional trend-following method to detect shifts in momentum.
RSI Filter
RSI confirms the signal by avoiding entries in overbought/oversold zones unless certain momentum conditions are met.
Long entry requires RSI ≥ Long Threshold
Short entry requires RSI ≤ Short Threshold
ATR-Based SL & TP
Stop-loss is set dynamically as a multiple of ATR below (long) or above (short) the entry price.
Take-profit is placed as a ratio (TP/SL) of the stop distance, ensuring consistent reward/risk structure.
Opening Range Filter (Optional)
If enabled, the strategy only triggers trades after price breaks out of the 09:30–09:45 EST range, ensuring participation in directional moves.
Session Filters
No trades from 04:00 to 09:30 and from 16:00 to 20:00 EST, avoiding low-liquidity periods.
All open trades are closed at 15:55 EST, to avoid overnight risk or expiration issues for options.
⚙️ Built-in Presets:
You can choose one of the built-in ticker-specific presets for optimal conditions:
Ticker EMAs RSI (Long/Short) ATR SL×ATR TP/SL
SPY 8/28 56 / 26 14 1.4× 4.0×
TSLA 23/27 56 / 33 13 1.4× 3.6×
AAPL 6/13 61 / 26 23 1.4× 2.1×
MSFT 25/32 54 / 26 14 1.2× 2.2×
META 25/32 53 / 26 17 1.8× 2.3×
AMZN 28/32 55 / 25 16 1.8× 2.3×
You can also choose "Custom" to fully configure all parameters to your own market and strategy preferences.
📌 Best Use Case:
This strategy is especially suited for intraday options trading, where timing and risk control are critical. It works best on liquid tickers with strong trends or clear breakout behavior.

KST Strategy [Skyrexio]Overview
KST Strategy leverages Know Sure Thing (KST) indicator in conjunction with the Williams Alligator and Moving average to obtain the high probability setups. KST is used for for having the high probability to enter in the direction of a current trend when momentum is rising, Alligator is used as a short term trend filter, while Moving average approximates the long term trend and allows trades only in its direction. Also strategy has the additional optional filter on Choppiness Index which does not allow trades if market is choppy, above the user-specified threshold. Strategy has the user specified take profit and stop-loss numbers, but multiplied by Average True Range (ATR) value on the moment when trade is open. The strategy opens only long trades.
Unique Features
ATR based stop-loss and take profit. Instead of fixed take profit and stop-loss percentage strategy utilizes user chosen numbers multiplied by ATR for its calculation.
Configurable Trading Periods. Users can tailor the strategy to specific market windows, adapting to different market conditions.
Optional Choppiness Index filter. Strategy allows to choose if it will use the filter trades with Choppiness Index and set up its threshold.
Methodology
The strategy opens long trade when the following price met the conditions:
Close price is above the Alligator's jaw line
Close price is above the filtering Moving average
KST line of Know Sure Thing indicator shall cross over its signal line (details in justification of methodology)
If the Choppiness Index filter is enabled its value shall be less than user defined threshold
When the long trade is executed algorithm defines the stop-loss level as the low minus user defined number, multiplied by ATR at the trade open candle. Also it defines take profit with close price plus user defined number, multiplied by ATR at the trade open candle. While trade is in progress, if high price on any candle above the calculated take profit level or low price is below the calculated stop loss level, trade is closed.
Strategy settings
In the inputs window user can setup the following strategy settings:
ATR Stop Loss (by default = 1.5, number of ATRs to calculate stop-loss level)
ATR Take Profit (by default = 3.5, number of ATRs to calculate take profit level)
Filter MA Type (by default = Least Squares MA, type of moving average which is used for filter MA)
Filter MA Length (by default = 200, length for filter MA calculation)
Enable Choppiness Index Filter (by default = true, setting to choose the optional filtering using Choppiness index)
Choppiness Index Threshold (by default = 50, Choppiness Index threshold, its value shall be below it to allow trades execution)
Choppiness Index Length (by default = 14, length used in Choppiness index calculation)
KST ROC Length #1 (by default = 10, value used in KST indicator calculation, more information in Justification of Methodology)
KST ROC Length #2 (by default = 15, value used in KST indicator calculation, more information in Justification of Methodology)
KST ROC Length #3 (by default = 20, value used in KST indicator calculation, more information in Justification of Methodology)
KST ROC Length #4 (by default = 30, value used in KST indicator calculation, more information in Justification of Methodology)
KST SMA Length #1 (by default = 10, value used in KST indicator calculation, more information in Justification of Methodology)
KST SMA Length #2 (by default = 10, value used in KST indicator calculation, more information in Justification of Methodology)
KST SMA Length #3 (by default = 10, value used in KST indicator calculation, more information in Justification of Methodology)
KST SMA Length #4 (by default = 15, value used in KST indicator calculation, more information in Justification of Methodology)
KST Signal Line Length (by default = 10, value used in KST indicator calculation, more information in Justification of Methodology)
User can choose the optimal parameters during backtesting on certain price chart.
Justification of Methodology
Before understanding why this particular combination of indicator has been chosen let's briefly explain what is KST, Williams Alligator, Moving Average, ATR and Choppiness Index.
The KST (Know Sure Thing) is a momentum oscillator developed by Martin Pring. It combines multiple Rate of Change (ROC) values, smoothed over different timeframes, to identify trend direction and momentum strength. First of all, what is ROC? ROC (Rate of Change) is a momentum indicator that measures the percentage change in price between the current price and the price a set number of periods ago.
ROC = 100 * (Current Price - Price N Periods Ago) / Price N Periods Ago
In our case N is the KST ROC Length inputs from settings, here we will calculate 4 different ROCs to obtain KST value:
KST = ROC1_smooth × 1 + ROC2_smooth × 2 + ROC3_smooth × 3 + ROC4_smooth × 4
ROC1 = ROC(close, KST ROC Length #1), smoothed by KST SMA Length #1,
ROC2 = ROC(close, KST ROC Length #2), smoothed by KST SMA Length #2,
ROC3 = ROC(close, KST ROC Length #3), smoothed by KST SMA Length #3,
ROC4 = ROC(close, KST ROC Length #4), smoothed by KST SMA Length #4
Also for this indicator the signal line is calculated:
Signal = SMA(KST, KST Signal Line Length)
When the KST line rises, it indicates increasing momentum and suggests that an upward trend may be developing. Conversely, when the KST line declines, it reflects weakening momentum and a potential downward trend. A crossover of the KST line above its signal line is considered a buy signal, while a crossover below the signal line is viewed as a sell signal. If the KST stays above zero, it indicates overall bullish momentum; if it remains below zero, it points to bearish momentum. The KST indicator smooths momentum across multiple timeframes, helping to reduce noise and provide clearer signals for medium- to long-term trends.
Next, let’s discuss the short-term trend filter, which combines the Williams Alligator and Williams Fractals. Williams Alligator
Developed by Bill Williams, the Alligator is a technical indicator that identifies trends and potential market reversals. It consists of three smoothed moving averages:
Jaw (Blue Line): The slowest of the three, based on a 13-period smoothed moving average shifted 8 bars ahead.
Teeth (Red Line): The medium-speed line, derived from an 8-period smoothed moving average shifted 5 bars forward.
Lips (Green Line): The fastest line, calculated using a 5-period smoothed moving average shifted 3 bars forward.
When the lines diverge and align in order, the "Alligator" is "awake," signaling a strong trend. When the lines overlap or intertwine, the "Alligator" is "asleep," indicating a range-bound or sideways market. This indicator helps traders determine when to enter or avoid trades.
The next indicator is Moving Average. It has a lot of different types which can be chosen to filter trades and the Least Squares MA is used by default settings. Let's briefly explain what is it.
The Least Squares Moving Average (LSMA) — also known as Linear Regression Moving Average — is a trend-following indicator that uses the least squares method to fit a straight line to the price data over a given period, then plots the value of that line at the most recent point. It draws the best-fitting straight line through the past N prices (using linear regression), and then takes the endpoint of that line as the value of the moving average for that bar. The LSMA aims to reduce lag and highlight the current trend more accurately than traditional moving averages like SMA or EMA.
Key Features:
It reacts faster to price changes than most moving averages.
It is smoother and less noisy than short-term EMAs.
It can be used to identify trend direction, momentum, and potential reversal points.
ATR (Average True Range) is a volatility indicator that measures how much an asset typically moves during a given period. It was introduced by J. Welles Wilder and is widely used to assess market volatility, not direction.
To calculate it first of all we need to get True Range (TR), this is the greatest value among:
High - Low
abs(High - Previous Close)
abs(Low - Previous Close)
ATR = MA(TR, n) , where n is number of periods for moving average, in our case equals 14.
ATR shows how much an asset moves on average per candle/bar. A higher ATR means more volatility; a lower ATR means a calmer market.
The Choppiness Index is a technical indicator that quantifies whether the market is trending or choppy (sideways). It doesn't indicate trend direction — only the strength or weakness of a trend. Higher Choppiness Index usually approximates the sideways market, while its low value tells us that there is a high probability of a trend.
Choppiness Index = 100 × log10(ΣATR(n) / (MaxHigh(n) - MinLow(n))) / log10(n)
where:
ΣATR(n) = sum of the Average True Range over n periods
MaxHigh(n) = highest high over n periods
MinLow(n) = lowest low over n periods
log10 = base-10 logarithm
Now let's understand how these indicators work in conjunction and why they were chosen for this strategy. KST indicator approximates current momentum, when it is rising and KST line crosses over the signal line there is high probability that short term trend is reversing to the upside and strategy allows to take part in this potential move. Alligator's jaw (blue) line is used as an approximation of a short term trend, taking trades only above it we want to avoid trading against trend to increase probability that long trade is going to be winning.
Almost the same for Moving Average, but it approximates the long term trend, this is just the additional filter. If we trade in the direction of the long term trend we increase probability that higher risk to reward trade will hit the take profit. Choppiness index is the optional filter, but if it turned on it is used for approximating if now market is in sideways or in trend. On the range bounded market the potential moves are restricted. We want to decrease probability opening trades in such condition avoiding trades if this index is above threshold value.
When trade is open script sets the stop loss and take profit targets. ATR approximates the current volatility, so we can make a decision when to exit a trade based on current market condition, it can increase the probability that strategy will avoid the excessive stop loss hits, but anyway user can setup how many ATRs to use as a stop loss and take profit target. As was said in the Methodology stop loss level is obtained by subtracting number of ATRs from trade opening candle low, while take profit by adding to this candle's close.
Backtest Results
Operating window: Date range of backtests is 2023.01.01 - 2025.05.01. It is chosen to let the strategy to close all opened positions.
Commission and Slippage: Includes a standard Binance commission of 0.1% and accounts for possible slippage over 5 ticks.
Initial capital: 10000 USDT
Percent of capital used in every trade: 60%
Maximum Single Position Loss: -5.53%
Maximum Single Profit: +8.35%
Net Profit: +5175.20 USDT (+51.75%)
Total Trades: 120 (56.67% win rate)
Profit Factor: 1.747
Maximum Accumulated Loss: 1039.89 USDT (-9.1%)
Average Profit per Trade: 43.13 USDT (+0.6%)
Average Trade Duration: 27 hours
These results are obtained with realistic parameters representing trading conditions observed at major exchanges such as Binance and with realistic trading portfolio usage parameters.
How to Use
Add the script to favorites for easy access.
Apply to the desired timeframe and chart (optimal performance observed on 1h BTC/USDT).
Configure settings using the dropdown choice list in the built-in menu.
Set up alerts to automate strategy positions through web hook with the text: {{strategy.order.alert_message}}
Disclaimer:
Educational and informational tool reflecting Skyrexio commitment to informed trading. Past performance does not guarantee future results. Test strategies in a simulated environment before live implementation.

System 0530 - Stoch RSI Strategy with ATR filterStrategy Description: System 0530 - Multi-Timeframe Stochastic RSI with ATR Filter
Overview:
This strategy, "System 0530," is designed to identify trading opportunities by leveraging the Stochastic RSI indicator across two different timeframes: a shorter timeframe for initial signal triggers (assumed to be the chart's current timeframe, e.g., 5-minute) and a longer timeframe (15-minute) for signal confirmation. It incorporates an ATR (Average True Range) filter to help ensure trades are taken during periods of adequate market volatility and includes a cooldown mechanism to prevent rapid, successive signals in the same direction. Trade exits are primarily handled by reversing signals.
How It Works:
1. Signal Initiation (e.g., 5-Minute Timeframe):
Long Signal Wait: A potential long entry is considered when the 5-minute Stochastic RSI %K line crosses above its %D line, AND the %K value at the time of the cross is at or below a user-defined oversold level (default: 30).
Short Signal Wait: A potential short entry is considered when the 5-minute Stochastic RSI %K line crosses below its %D line, AND the %K value at the time of the cross is at or above a user-defined overbought level (default: 70). When these conditions are met, the strategy enters a "waiting state" for confirmation from the 15-minute timeframe.
2. Signal Confirmation (15-Minute Timeframe):
Once in a waiting state, the strategy looks for confirmation on the 15-minute Stochastic RSI within a user-defined number of 5-minute bars (wait_window_5min_bars, default: 5 bars).
Long Confirmation:
The 15-minute Stochastic RSI %K must be greater than or equal to its %D line.
The 15-minute Stochastic RSI %K value must be below a user-defined threshold (stoch_15min_long_entry_level, default: 40).
Short Confirmation:
The 15-minute Stochastic RSI %K must be less than or equal to its %D line.
The 15-minute Stochastic RSI %K value must be above a user-defined threshold (stoch_15min_short_entry_level, default: 60).
3. Filters:
ATR Volatility Filter: If enabled, trades are only confirmed if the current ATR value (converted to ticks) is above a user-defined minimum threshold (min_atr_value_ticks). This helps to avoid taking signals during periods of very low market volatility. If the ATR condition is not met, the strategy continues to wait for the condition to be met within the confirmation window, provided other conditions still hold.
Signal Cooldown Filter: If enabled, after a signal is generated, the strategy will wait for a minimum number of bars (min_bars_between_signals) before allowing another signal in the same direction. This aims to reduce overtrading.
4. Entry and Exit Logic:
Entry: A strategy.entry() order is placed when all trigger, confirmation, and filter conditions are met.
Exit: This strategy primarily uses reversing signals for exits. For example, if a long position is open, a confirmed short signal will close the long position and open a new short position. There are no explicit take profit or stop loss orders programmed into this version of the script.
Key User-Adjustable Parameters:
Stochastic RSI Parameters: RSI Length, Stochastic RSI Length, %K Smoothing, %D Smoothing.
Signal Trigger & Confirmation:
5-minute %K trigger levels for long and short.
15-minute %K confirmation thresholds for long and short.
Wait window (in 5-minute bars) for 15-minute confirmation.
Filters:
Enable/disable and configure the Signal Cooldown filter (minimum bars between signals).
Enable/disable and configure the ATR Volatility filter (ATR period, minimum ATR value in ticks).
Strategy Parameters:
Leverage Multiplier (Note: This primarily affects theoretical position sizing for backtesting calculations in TradingView and does not simulate actual leveraged trading risks).
Recommendations for Users:
Thorough Backtesting: Test this strategy extensively on historical data for the instruments and timeframes you intend to trade.
Parameter Optimization: Experiment with different parameter settings to find what works best for your trading style and chosen markets. The default values are starting points and may not be optimal for all conditions.
Understand the Logic: Ensure you understand how each component (Stochastic RSI on different timeframes, ATR filter, cooldown) interacts to generate signals.
Risk Management: Since this version does not include explicit stop-loss orders, ensure you have a clear risk management plan in place if trading this strategy live. You might consider manually adding stop-loss orders through your broker or using TradingView's separate strategy order settings for stop-loss if applicable.
Disclaimer:
This strategy description is for informational purposes only and does not constitute financial advice. Past performance is not indicative of future results. Trading involves significant risk of loss. Always do your own research and understand the risks before trading.

RSI SwingRadar🧠 Strategy Overview
This long-only strategy combines RSI/MA crossovers with ATR-based risk management, designed for cleaner entries during potential bounce phases — especially tuned for assets like XMR/USDT.
🔍 Core Logic:
- RSI Crossover: Entry occurs when the 14-period RSI crosses above its 14-period SMA, signaling a potential shift in momentum.
- Oversold Filter: The RSI must have been below a user-defined oversold threshold (default: 35) on the previous candle, filtering for bounce setups after a pullback.
- ATR-Based Stop/Target: Stop-loss is placed below the low by a user-adjustable ATR multiplier (default: 0.5×). Take-profit is calculated with a Risk:Reward multiplier (default: 4×).
These elements work in tandem — RSI crossovers give momentum confirmation, oversold filtering adds context, and ATR-based exits adapt to volatility, creating a compact yet responsive strategy.
📉 Visuals:
- Dynamic Bands: The chart displays the active stop-loss, entry price, and take-profit as colored bands for easy visual tracking.
- Clean Overlay: Designed with simplicity — only confirmed setups are shown, keeping noise low.
✅ Suggested Use:
- Works best on XMR/USDT or similarly trending assets.
- Best suited for pullback entries during broader uptrends.
- Adjustable for different volatility conditions and asset behaviors.
⚠️ Disclaimer
- This strategy is for educational and research purposes only.
- It does not guarantee profitability in any market.
- Always backtest, forward-test, and understand your own risk tolerance before using any
strategy in a live environment.
- Past performance is not indicative of future results.
- This script is not financial advice.

Trend Surge with Pullback FilterTrend Surge with Pullback Filter
Overview
Trend Surge with Pullback Filter is a price action-based strategy designed to enter strong trends not at the breakout, but at the first controlled pullback after a surge. It filters out noise by requiring momentum confirmation and low volatility conditions, aiming for better entry prices and reduced risk exposure.
How It Works
A strong upward trend is identified when the Rate of Change (ROC) exceeds a defined percentage (e.g., 2%).
Instead of jumping into the trend immediately, the strategy waits for a pullback: the price must drop at least 1% below its recent high (over the past 3 candles).
A low volatility environment is also required for entry — measured using ATR being below its 20-period average multiplied by a safety factor.
If all three conditions are met (trend + pullback + quiet volatility), the system enters a long position.
The trade is managed using a dynamic ATR-based stop-loss and a take-profit at 2x ATR.
An automatic exit occurs after 30 bars if neither SL nor TP is hit.
Key Features
- Momentum-triggered trend detection via ROC
- Smart pullback filter avoids overbought entries
- Volatility-based filter to eliminate noise and choppy conditions
- Dynamic risk-reward ratio with ATR-driven exit logic
- Time-limited exposure using bar-based exit
Parameter Explanation
ROC Length (10): Looks for short-term price surges
ROC Threshold (2.0%): Trend is considered valid if price increased more than 2%
Pullback Lookback (3): Checks last 3 candles for price retracement
Minimum Pullback % (1.0%): Entry only if price pulled back at least 1%
ATR Length (14): Measures current volatility
Low Volatility Multiplier (1.2): ATR must be below this multiple of its 20-period average
Risk-Reward (2.0): Target is set at 2x the stop-loss distance
Max Bars (30): Trade is closed automatically after 30 bars
Originality Statement
This strategy doesn’t enter at the trend start, unlike many momentum bots. Instead, it waits for the first market hesitation — a minor pullback under low volatility — before entering. This logic mimics how real traders often wait for a better entry after a breakout, avoiding emotional overbought buys. The combined use of ROC, dynamic pullback detection, and ATR-based environment filters makes it both practical and original for real-world trading.
Disclaimer
This strategy is intended for educational and research purposes. Backtest thoroughly and understand the logic before using with real capital.

Volatility Pulse with Dynamic ExitVolatility Pulse with Dynamic Exit
Overview
This strategy, Volatility Pulse with Dynamic Exit, is designed to capture impulsive price moves following volatility expansions, while ensuring risk is managed dynamically. It avoids trades during low-volatility periods and uses momentum confirmation to enter positions. Additionally, it features a time-based forced exit system to limit overexposure.
How It Works
A position is opened when the current ATR (Average True Range) significantly exceeds its 20-period average, signaling a volatility expansion.
To confirm the move is directional and not random noise, the strategy checks for momentum: the close must be above/below the close of 20 bars ago.
Low volatility zones are filtered out to avoid chop and poor trade entries.
Upon entry, a dynamic stop-loss is set at 1x ATR, while take-profit is set at 2x ATR, offering a 2:1 reward-to-risk ratio.
If the position remains open for more than 42 bars, it is forcefully closed, even if targets are not hit. This prevents long-lasting, stagnant trades.
Key Features
✅ Volatility-based breakout detection
✅ Momentum confirmation filter
✅ Dynamic stop-loss and take-profit based on real-time ATR
✅ Time-based forced exit (42 bars max holding)
✅ Low-volatility environment filter
✅ Realistic settings with 0.05% commission and slippage included
Parameters Explanation
ATR Length (14): Captures recent volatility over ~2 weeks (14 candles).
Momentum Lookback (20): Ensures meaningful price move confirmation.
Volatility Expansion Threshold (0.5x): Strategy activates only when ATR is at least 50% above its average.
Minimum ATR Filter (1.0x): Avoids entries in tight, compressed market ranges.
Max Holding (42 bars): Trades are closed after 42 bars if no exit signal is triggered.
Risk-Reward (2.0x): Aiming for 2x ATR as profit for every 1x ATR risk.
Originality Note
While volatility and momentum have been used separately in many strategies, this script combines both with a time-based dynamic exit system. This exit rule, combined with an ATR-based filter to exclude low-activity periods, gives the system a practical edge in real-world use. It avoids classic rehashes and integrates real trading constraints for better applicability.
Disclaimer
This is a research-focused trading strategy meant for backtesting and educational purposes. Always use proper risk management and perform due diligence before applying to real funds.

Momentum Long + Short Strategy (BTC 3H)Momentum Long + Short Strategy (BTC 3H)
🔍 How It Works, Step by Step
Detect the Trend (📈/📉)
Calculate two moving averages (100-period and 500-period), either EMA or SMA.
For longs, we require MA100 > MA500 (uptrend).
For shorts, we block entries if MA100 exceeds MA500 by more than a set percentage (to avoid fading a powerful uptrend).
Apply Momentum Filters (⚡️)
RSI Filter: Measures recent strength—only allow longs when RSI crosses above its smoothed average, and shorts when RSI dips below the oversold threshold.
ADX Filter: Gauges trend strength—ensures we only enter when a meaningful trend exists (optional).
ATR Filter: Confirms volatility—avoids choppy, low-volatility conditions by requiring ATR to exceed its smoothed value (optional).
Confirm Entry Conditions (✅)
Long Entry:
Price is above both MAs
Trend alignment & optional filters pass ✅
Short Entry:
Price is below both MAs and below the lower Bollinger Band
RSI is sufficiently oversold
Trend-blocker & ATR filter pass ✅
Position Sizing & Risk (💰)
Each trade uses 100 % of account equity by default.
One pyramid addition allowed, so you can scale in if the move continues.
Commission and slippage assumptions built in for realistic backtests.
Stops & Exits (🛑)
Long Stop-Loss: e.g. 3 % below entry.
Long Auto-Exit: If price falls back under the 500-period MA.
Short Stop-Loss: e.g. 3 % above entry.
Short Take-Profit: e.g. 4 % below entry.
🎨 Why It’s Powerful & Customizable
Modular Filters: Turn on/off RSI, ADX, ATR filters to suit different market regimes.
Adjustable Thresholds: Fine-tune stop-loss %, take-profit %, RSI lengths, MA gaps and more.
Multi-Timeframe Potential: Although coded for 3 h BTC, you can adapt it to stocks, forex or other cryptos—just recalibrate!
Backtest Fine-Tuned: Default settings were optimized via backtesting on historical BTC data—but they’re not guarantees of future performance.
⚠️ Warning & Disclaimer
This strategy is for educational purposes only and designed for a toy fund. Crypto markets are highly volatile—you can lose 100 % of your capital. It is not a predictive “holy grail” but a rules-based framework using past data. The parameters have been fine-tuned on historical data and are not valid for future trades without fresh calibration. Always practice with paper-trading first, use proper risk management, and do your own research before risking real money. 🚨🔒
Good luck exploring and experimenting! 🚀📊

Big Mover Catcher BTC 4h🧠 Big Mover Catcher (BTC 4H Strategy) — Educational Tool
⚠️ Disclaimer: I am not a financial advisor. This script is for educational and testing purposes only. Cryptocurrency trading is highly volatile and involves significant risk. You can lose all of your invested capital.
📌 Overview
The Big Mover Catcher strategy is a work-in-progress trading system designed for Bitcoin (BTC) on the 4-hour chart. It aims to identify strong breakout moves by combining multiple technical indicators and conditions, allowing for high customization and filter-based confirmations.
This script is part of a personal project to learn Pine Script and backtesting on TradingView. It is currently in the testing and research phase.
🎯 Strategy Objective
Catch large, high-momentum breakout moves in the BTC market using:
Bollinger Band breakouts for entry signals
Momentum, volatility, and trend filters for trade confirmation
🧰 Features & Filters
The script provides a flexible set of filters that can be turned ON/OFF and adjusted directly from the settings panel:
✅ Entry Conditions
Price must break above or below Bollinger Bands
All selected filters must align before entry
🧪 Available Filters:
Relative Strength Index (RSI) with EMA/SMA smoothing
Average Directional Index (ADX) with EMA/SMA smoothing
Average True Range (ATR) with EMA/SMA smoothing
MACD Signal above or below zero
EMA 350 trend filter
ATR / ADX / RSI Threshold toggles for added control
🔥 Additional Feature:
Force Take Profit: Optionally closes the trade immediately if a candle closes with more than a defined % movement (default: 5%). This can help lock in quick profits during high volatility moves.
⚙️ Customizable Inputs
You can configure:
Stop loss percentage
All indicator lengths
Smoothing types (EMA/SMA)
Threshold activation toggles
Individual filter ON/OFF switches
This makes the strategy highly adaptable for educational exploration and optimization.
📊 Best Used For
Learning Pine Script and strategy structure
Testing filter combinations for BTC on the 4H timeframe
Understanding how different indicators interact in live markets
⚠️ Note: ❌ Short trades are currently disabled by default, as short-side logic is still under development.
❗ Final Reminder
This script is not financial advice. It is an educational tool. Use it to learn and explore trading logic. Trading cryptocurrencies carries high risk — only invest what you can afford to lose.

EMA Pullback Speed Strategy 📌 **Overview**
The **EMA Pullback Speed Strategy** is a trend-following approach that combines **price momentum** and **Exponential Moving Averages (EMA)**.
It aims to identify high-probability entry points during brief pullbacks within ongoing uptrends or downtrends.
The strategy evaluates **speed of price movement**, **relative position to dynamic EMA**, and **candlestick patterns** to determine ideal timing for entries.
One of the key concepts is checking whether the price has **“not pulled back too much”**, helping focus only on situations where the trend is likely to continue.
⚠️ This strategy is designed for educational and research purposes only. It does not guarantee future profits.
🧭 **Purpose**
This strategy addresses the common issue of **"jumping in too late during trends and taking unnecessary losses."**
By waiting for a healthy pullback and confirming signs of **trend resumption**, traders can enter with greater confidence and reduce false entries.
🎯 **Strategy Objectives**
* Enter in the direction of the prevailing trend to increase win rate
* Filter out false signals using pullback depth, speed, and candlestick confirmations
* Predefine Take-Profit (TP) and Stop-Loss (SL) levels for safer, rule-based trading
✨ **Key Features**
* **Dynamic EMA**: Reacts faster when price moves quickly, slower when market is calm – adapting to current momentum
* **Pullback Filter**: Avoids trades when price pulls back too far (e.g., more than 5%), indicating a trend may be weakening
* **Speed Check**: Measures how strongly the price returns to the trend using candlestick body speed (open-to-close range in ticks)
📊 **Trading Rules**
**■ Long Entry Conditions:**
* Current price is above the dynamic EMA (indicating uptrend)
* Price has pulled back toward the EMA (a "buy the dip" situation)
* Pullback depth is within the threshold (not excessive)
* Candlesticks show consecutive bullish closes and break the previous high
* Price speed is strong (positive movement with momentum)
**■ Short Entry Conditions:**
* Current price is below the dynamic EMA (indicating downtrend)
* Price has pulled back up toward the EMA (a "sell the rally" setup)
* Pullback is within range (not too deep)
* Candlesticks show consecutive bearish closes and break the previous low
* Price speed is negative (downward momentum confirmed)
**■ Exit Conditions (TP/SL):**
* **Take-Profit (TP):** Fixed 1.5% target above/below entry price
* **Stop-Loss (SL):** Based on recent price volatility, calculated using ATR × 4
💰 **Risk Management Parameters**
* Symbol & Timeframe: BTCUSD on 1-hour chart (H1)
* Test Capital: \$3000 (simulated account)
* Commission: 0.02%
* Slippage: 2 ticks (minimal execution lag)
* Max risk per trade: 5% of account balance
* Backtest Period: Aug 30, 2023 – May 9, 2025
* Profit Factor (PF): 1.965 (Net profit ÷ Net loss, including spreads & fees)
⚙️ **Trading Parameters & Indicator Settings**
* Maximum EMA Length: 50
* Accelerator Multiplier: 3.0
* Pullback Threshold: 5.0%
* ATR Period: 14
* ATR Multiplier (SL distance): 4.0
* Fixed TP: 1.5%
* Short-term EMA: 21
* Long-term EMA: 50
* Long Speed Threshold: ≥ 1000.0 (ticks)
* Short Speed Threshold: ≤ -1000.0 (ticks)
⚠️Adjustments are based on BTCUSD.
⚠️Forex and other currency pairs require separate adjustments.
🔧 **Strategy Improvements & Uniqueness**
Unlike basic moving average crossovers or RSI triggers, this strategy emphasizes **"momentum-supported pullbacks"**.
By combining dynamic EMA, speed checks, and candlestick signals, it captures trades **as if surfing the wave of a trend.**
Its built-in filters help **avoid overextended pullbacks**, which often signal the trend is ending – making it more robust than traditional trend-following systems.
✅ **Summary**
The **EMA Pullback Speed Strategy** is easy to understand, rule-based, and highly reproducible – ideal for both beginners and intermediate traders.
Because it shows **clear visual entry/exit points** on the chart, it’s also a great tool for practicing discretionary trading decisions.
⚠️ Past performance is not a guarantee of future results.
Always respect your Stop-Loss levels and manage your position size according to your risk tolerance.
