OPEN-SOURCE SCRIPT
ที่อัปเดต: Relative Strength Index (RSI) + Stochastic RSI

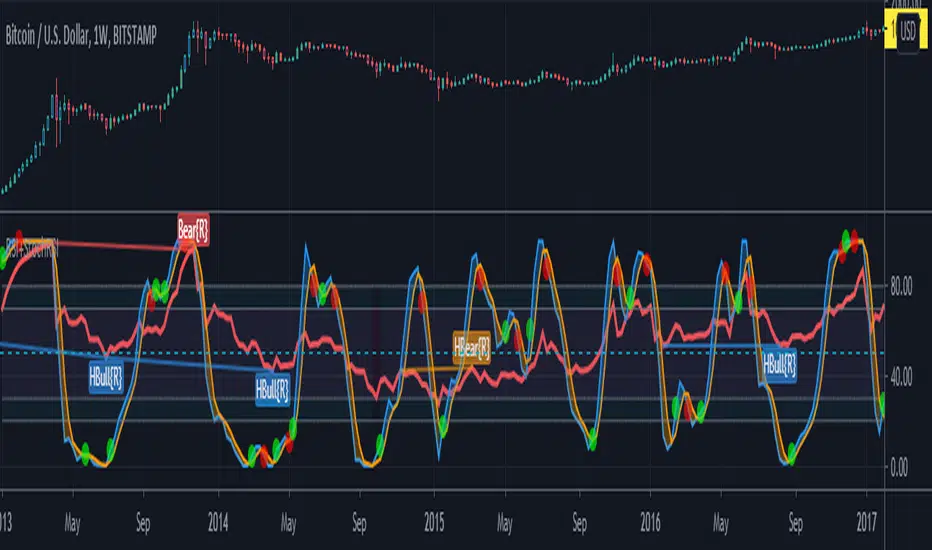
Combined plot of RSI and StochRSI
เอกสารเผยแพร่
Please check out my other indicators sets and series, e.g. - LIVIDITIUM (dynamic levels),
- AEONDRIFT (standard deviation bands),
- FUSIONGAPS (MA based oscillators),
- MAJESTIC (Momentum/Acceleration/Jerk Oscillators),
- PRISM (PSAR based oscillator, with RSI/StochRSI as well as Momentum/Acceleration/Jerk indicators),
- and more to come.
Constructive feedback and suggestions are welcome.
เอกสารเผยแพร่
Introduced a number of new features: i.e. plots rescaling options & auto-normalisation, and a couple of tweaks.เอกสารเผยแพร่
Introduced bar color indicator of oscillator states (can be Enabled/Disabled).เอกสารเผยแพร่
Swapped bullish/bearish candles color-tint (blue<>yellow) such that now:- Yellow tint = Bullish
- Blue tint = Bearish
เอกสารเผยแพร่
Allows Custom Stochs Source.เอกสารเผยแพร่
Added volume weighted options.เอกสารเผยแพร่
- Allows selection of resolution.
เอกสารเผยแพร่
- Introduced divergence for both RSI and STOCHs (can be manually enabled/disabled).
- Note: Stochs can be modulated by RSI, candle closing, or other user selectable inputs.
เอกสารเผยแพร่
Fixed typos.เอกสารเผยแพร่
Introduced k-d crossover indicator (can be Enabled in the settings).สคริปต์โอเพนซอร์ซ
ด้วยเจตนารมณ์หลักของ TradingView ผู้สร้างสคริปต์นี้ได้ทำให้เป็นโอเพนซอร์ส เพื่อให้เทรดเดอร์สามารถตรวจสอบและยืนยันฟังก์ชันการทำงานของมันได้ ขอชื่นชมผู้เขียน! แม้ว่าคุณจะใช้งานได้ฟรี แต่โปรดจำไว้ว่าการเผยแพร่โค้ดซ้ำจะต้องเป็นไปตาม กฎระเบียบการใช้งาน ของเรา
คำจำกัดสิทธิ์ความรับผิดชอบ
ข้อมูลและบทความไม่ได้มีวัตถุประสงค์เพื่อก่อให้เกิดกิจกรรมทางการเงิน, การลงทุน, การซื้อขาย, ข้อเสนอแนะ หรือคำแนะนำประเภทอื่น ๆ ที่ให้หรือรับรองโดย TradingView อ่านเพิ่มเติมใน ข้อกำหนดการใช้งาน
สคริปต์โอเพนซอร์ซ
ด้วยเจตนารมณ์หลักของ TradingView ผู้สร้างสคริปต์นี้ได้ทำให้เป็นโอเพนซอร์ส เพื่อให้เทรดเดอร์สามารถตรวจสอบและยืนยันฟังก์ชันการทำงานของมันได้ ขอชื่นชมผู้เขียน! แม้ว่าคุณจะใช้งานได้ฟรี แต่โปรดจำไว้ว่าการเผยแพร่โค้ดซ้ำจะต้องเป็นไปตาม กฎระเบียบการใช้งาน ของเรา
คำจำกัดสิทธิ์ความรับผิดชอบ
ข้อมูลและบทความไม่ได้มีวัตถุประสงค์เพื่อก่อให้เกิดกิจกรรมทางการเงิน, การลงทุน, การซื้อขาย, ข้อเสนอแนะ หรือคำแนะนำประเภทอื่น ๆ ที่ให้หรือรับรองโดย TradingView อ่านเพิ่มเติมใน ข้อกำหนดการใช้งาน