📉 Technical Chart Overview
Metric Value/Zone
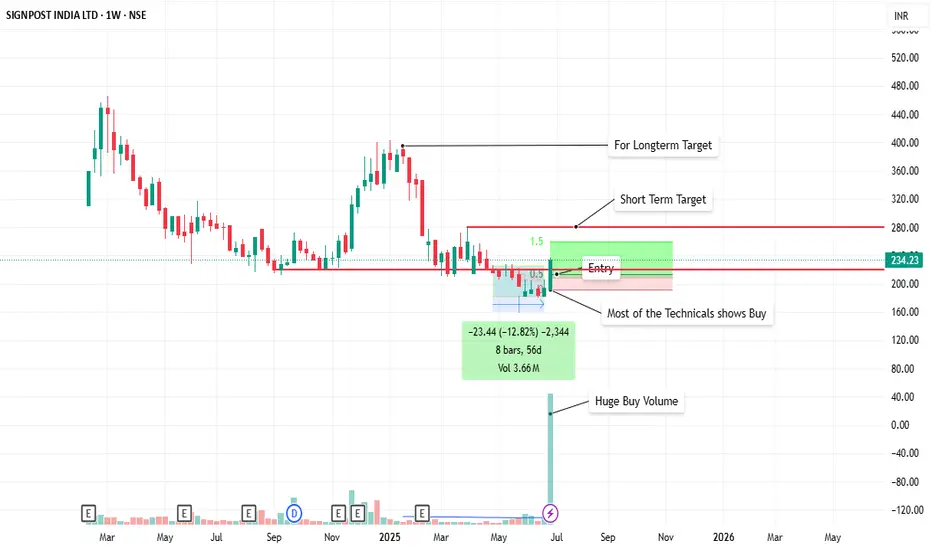
📆 Time Frame Weekly Chart (W1)
📈 Current Price ₹234.23
🟩 Entry Zone Around ₹200–210
🟥 Stop Loss Below ₹190 (recent support base)
🎯 Short-Term Target ₹280 (approx +20%)
🎯 Long-Term Target ₹360–400 (approx +50%–70%)
🔊 Volume Signal Huge Buy Volume spike
✅ Bullish Signals
📊 Volume Breakout: Last weekly candle has massive volume, indicating strong institutional or smart money interest.
🟢 Break from Consolidation Zone: Price broke out of a narrow range with a strong green candle.
📈 Bollinger Band Expansion: Price broke upper band after tight squeeze = volatility breakout
📉 Prior Downtrend Exhaustion: 56-day (8-week) accumulation range shows possible base formation
🔁 Buy zone confluence with previous support area (₹190–210)
📋 Trade Setup Summary
Category Details
📥 Entry ₹200–210
🛡️ Stop Loss Below ₹190 (weekly close)
🎯 Target 1 ₹280 (Short-Term)
🎯 Target 2 ₹360–400 (Positional / Long-Term)
⚖️ RRR ~1:2 or 1:3 based on targets
🚨 Caution Points
⚠️ Illiquidity Risk: This is a smallcap/low-float stock, so large positions may not be ideal.
📉 If breakout fails and price closes below ₹190, trend reversal invalidates.
🕰️ Patience required — this is a weekly timeframe trade; may take weeks to play out.
🧠 Strategy Recommendation
Type View
📦 Positional Strong setup — can be trailed weekly
💼 Swing Trade Good for 20–30% return in 3–5 weeks
🚨 Risk Averse Consider booking 50% near ₹270–280
🔚 Final Thoughts
Volume + Base Formation + Breakout on a weekly chart is a powerful combination. If broader market support continues, SIGNPOST could be a multi-week runner.
Metric Value/Zone
📆 Time Frame Weekly Chart (W1)
📈 Current Price ₹234.23
🟩 Entry Zone Around ₹200–210
🟥 Stop Loss Below ₹190 (recent support base)
🎯 Short-Term Target ₹280 (approx +20%)
🎯 Long-Term Target ₹360–400 (approx +50%–70%)
🔊 Volume Signal Huge Buy Volume spike
✅ Bullish Signals
📊 Volume Breakout: Last weekly candle has massive volume, indicating strong institutional or smart money interest.
🟢 Break from Consolidation Zone: Price broke out of a narrow range with a strong green candle.
📈 Bollinger Band Expansion: Price broke upper band after tight squeeze = volatility breakout
📉 Prior Downtrend Exhaustion: 56-day (8-week) accumulation range shows possible base formation
🔁 Buy zone confluence with previous support area (₹190–210)
📋 Trade Setup Summary
Category Details
📥 Entry ₹200–210
🛡️ Stop Loss Below ₹190 (weekly close)
🎯 Target 1 ₹280 (Short-Term)
🎯 Target 2 ₹360–400 (Positional / Long-Term)
⚖️ RRR ~1:2 or 1:3 based on targets
🚨 Caution Points
⚠️ Illiquidity Risk: This is a smallcap/low-float stock, so large positions may not be ideal.
📉 If breakout fails and price closes below ₹190, trend reversal invalidates.
🕰️ Patience required — this is a weekly timeframe trade; may take weeks to play out.
🧠 Strategy Recommendation
Type View
📦 Positional Strong setup — can be trailed weekly
💼 Swing Trade Good for 20–30% return in 3–5 weeks
🚨 Risk Averse Consider booking 50% near ₹270–280
🔚 Final Thoughts
Volume + Base Formation + Breakout on a weekly chart is a powerful combination. If broader market support continues, SIGNPOST could be a multi-week runner.
การนำเสนอที่เกี่ยวข้อง
คำจำกัดสิทธิ์ความรับผิดชอบ
ข้อมูลและบทความไม่ได้มีวัตถุประสงค์เพื่อก่อให้เกิดกิจกรรมทางการเงิน, การลงทุน, การซื้อขาย, ข้อเสนอแนะ หรือคำแนะนำประเภทอื่น ๆ ที่ให้หรือรับรองโดย TradingView อ่านเพิ่มเติมที่ ข้อกำหนดการใช้งาน
การนำเสนอที่เกี่ยวข้อง
คำจำกัดสิทธิ์ความรับผิดชอบ
ข้อมูลและบทความไม่ได้มีวัตถุประสงค์เพื่อก่อให้เกิดกิจกรรมทางการเงิน, การลงทุน, การซื้อขาย, ข้อเสนอแนะ หรือคำแนะนำประเภทอื่น ๆ ที่ให้หรือรับรองโดย TradingView อ่านเพิ่มเติมที่ ข้อกำหนดการใช้งาน