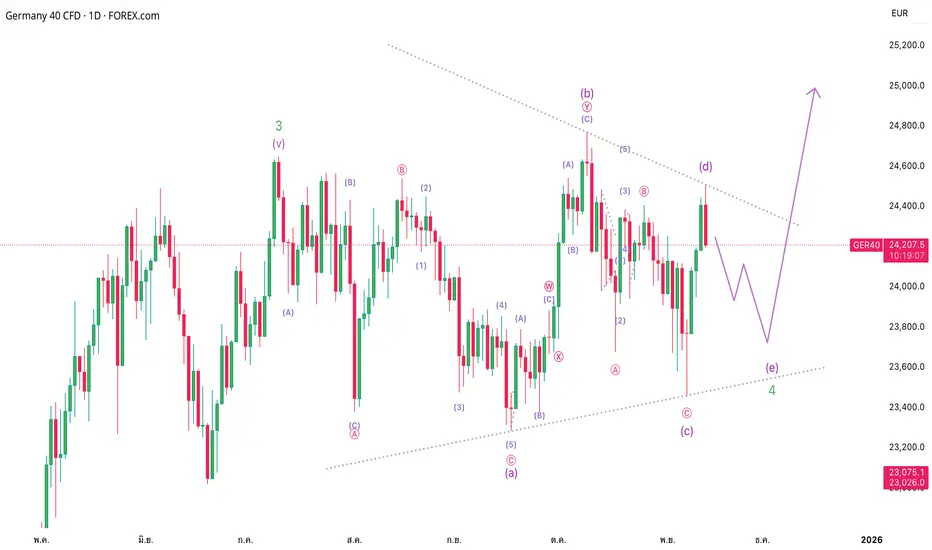
ติดตามการปรับตัวลงมาของคลื่น c of E Quick Idea Update #GER40🐳
ติดตามต่อจากมุมมองเมื่อวานนี้ กราฟยังมาตามรูปแบบคลื่นที่เรามอง
...วันนี้ ผมย่อลงมาติดตามในชุดคลื่นย่อย ...
ปัจจุบัน ผมมองว่าเราอยู่ในชุดคลื่น c of E
ผมจะติดตามการปรับตัวลงมาให้ครบ 5 คลื่น โดยมีระดับฟิโบที่สำคัญ ได้แก่ Zigzag C = 100 , 123.6% และ Triangle E=61.8% เป็นค่าสำคัญที่เราจะใช้ดูประกอบกัน
.
.
.
#WAVE #EakWAVE #EakElliottWave #EakCEWA #CEWA
#ElliottWave #DE40 #DAX
ไอเดียการซื้อขาย

Wave 4 TriangleQuick Idea Update #GER40🐳
ภาพรวมมีโอกาสพักตัวในรูปแบบของ Triangle
... โดยเราอยู่ในชุดคลื่น E เพื่อจบชุดคลื่น 4(สีเขียว) ...
.
.
.
#WAVE #EakWAVE #EakElliottWave #EakCEWA #CEWA
#ElliottWave #DE40 #DAX
วิธีใช้ Sentiment Indicator อารมณ์ในตลาด วิธีใช้ Sentiment Indicator อารมณ์ในตลาด
👰กลับมาพบกันอีกเช่นเคยกับการเทรดวิเคราะห์กราฟและการแชร์เทคนิคคอลแจ่มๆที่ใช้ดีและบอกต่อ วันนี้แอดมาไขข้อข้องใจเกี่ยวกับอารมณ์การเทรดในตลาด อารมณ์ที่เป็นอารมณ์ร่วมจริงๆนะ เอ๊ะแล้วมันดียังไง มันเริ่มจากตรงไหน มาครับ บทความนี้มีคำตอบ
หลังจากที่เราๆเทรดเดอร์มือใหม่ทั้งหลายเริ่มเข้าสู่วงการเทรดแบบเต็มตัวแล้ว หลายๆคนน่าจะเริ่มรู้จัก รูปแบบในการวิเคราะห์ข้อมูลของตลาดมาบ้าง ไม่มากก็น้อย แต่ที่งงๆเยอะหน่อย น่าจะเป็นอารมณ์ในตลาด Sentimental Analysis หรือความอ่อนไหวของตลาดว่ามันคืออะไร ทำไมขึ้นๆลงๆ เดาทางไม่ถูกเลย
Market Sentiment คืออะไร
Sentiment หมายถึงแนวทางความคิด และความรู้สึกของนักลงทุนในตลาด ซึ่งมีอิทธิพลต่อการตัดสินใจซื้อหรือขายสินทรัพย์ทางการเงิน โดยใช้ความรู้สึกหรืออารมณ์โดยรวมที่นักลงทุนและเทรดเดอร์มีต่อตลาดนั้น ๆ ซึ่งในแต่ละตลาดการลงทุนก็จะมีมุมมองที่แตกต่างออกไป
Market Sentiment แบ่งมุมมองของตลาดออกเป็น 3 เทรนด์
1. ตลาดอยู่ในสภาวะขาขึ้น (Uptrend)
2. ตลาดอยู่ในสภาวะขาลง (Downtrend)
3. ตลาดยังหาทิศทางไม่ได้ (Sideway)
การวิเคราะห์อารมณ์ของตลาด (Sentiment Analysis) คืออะไร?
ระบบเทรด Sentiment Analysis (การวิเคราะห์ความรู้สึก) เป็นระบบที่อาศัยการประเมินความรู้สึกหรืออารมณ์ของตลาดจากแหล่งข้อมูลต่างๆ
เช่น ข่าวสาร, โซเชียลมีเดีย, ฟอรัม, หรือความคิดเห็นของผู้คน เพื่อทำนายทิศทางราคาของสินทรัพย์ (เช่น หุ้น, สกุลเงิน, หรือคริปโตเคอร์เรนซี)
โดยหากข้อมูลข่าวสารในตลาดส่อแววเป็นปัจจัยบวก (Positive Sentiment)
ก็ถือเป็นสัญญาณขาขึ้น ให้ BUY
ในขณะเดียวกัน หากมีข่าวสารที่เป็นปัจจัยลบ (Negative Sentiment)
ก็จะถือเป็นสัญญาณขาลงนั่นเอง ให้ SELL
อย่างไรก็ตาม บางครั้งข้อมูลที่ถูกรวบรวมมาก็อาจไม่ได้บอกสัญญาณเทรดที่ถูกต้องเสมอไป เทรดเดอร์ก็ควรพิจารณาข้อมูลข่าวสารทางการเงินทั้งที่เป็นปัจจัยบวกและลบร่วมด้วยในระหว่างการเทรด ซึ่งมีโอกาสสูงที่ข้อมูลเหล่านั้นจะส่งผลต่อราคาสินทรัพย์ที่เรากำลังเทรดอยู่ แต่หากรารู้จักใช้ sentiment indicator ให้เป็นประโยชน์ ก็หมดห่วงได้เลย! มันจะช่วยให้เราตัดสินใจได้ง่ายขึ้น
อินดิเคเตอร์ Sentiment กำลังบอกอะไร?
การตีความหมายของ sentiment indicator !
1. การอ่านตัวชี้วัดตามตัวเลขจริง (เหมาะสำหรับเทรดระยะยาว)
- หากตัวเลขอยู่ในระดับสูงๆ หมายความว่าผู้บริโภคกำลังมองตลาดอยู่ในเกณฑ์บวก และเราก็เดิมพันในทิศทางตลาดตามความเป็นจริง โดยมองฝั่ง BUY และคิดว่าราคาจะขึ้นไปอีกเรื่อยๆ
- หากตัวเลขดังกล่าวอยู่ในระดับต่ำๆ หมายความว่าผู้บริโภคกำลังได้รับแรงกดดันจากสภาวะเชิงลบของตลาด ซึ่งอาจส่งผลให้ตลาดมีการปรับตัวลงไปอีก โดยมองฝั่ง SELL
2. การอ่านตัวชี้วัดแล้วมองในทิศทางตรงกันข้าม(เหมาะสำหรับเทรดระยะสั้น)
- หากตัวเลขอยู่ในระดับต่ำๆ หมายความว่าผู้บริโภคกำลังได้รับแรงกดดันจากสภาวะเชิงลบของตลาด ซึ่งอาจส่งผลให้ตลาดมีการปรับตัวบวก และราคาก็อาจกลับตัวขึ้นหลังจากนั้น
- ในขณะเดียวกัน หากอินดิเคเตอร์ดังกล่าวอยู่ในระดับสูงๆ ก็หมายความว่าผู้บริโภคกำลังมองตลาดอยู่ในเกณฑ์บวก ซึ่งเทรดเดอร์มืออาชีพโดยส่วนใหญ่จะมองว่า indicator นั้นอาจปรับตัวลงพร้อมๆ กับตลาดในไม่ช้า
อินดิเคเตอร์ Sentiment ของตลาด vs. อินดิเคเตอร์เชิงเทคนิค
Indicator บางตัวอาจใช้วิเคราะห์ได้ทั้งในเชิงเทคนิคและสภาวะอารมณ์ของตลาด อย่างไรก็ตาม อินดิเคเตอร์ทั้ง 2 ประเภทก็ยังมีความแตกต่างกันอยู่บ้าง ดังนี้:
1. อินดิเคเตอร์ Sentiment ใช้บอกพฤติกรรมของทั้งผู้บริโภคและนักลงทุน รวมถึงอารมณ์ความรู้สึกของบุคคลที่เกี่ยวข้องในตลาดดังกล่าว
2.อินดิเคเตอร์เชิงเทคนิค บ่งบอกภาพรวมของตลาด ไม่ว่าจะเป็นราคา (Price), ปริมาณการซื้อขาย (Volume), และข้อมูลอื่นๆ ในเชิงเทคนิคที่ปรากฎใน กราฟเทรด
👽👽👽เป็นอย่างไรกันบ้างครับ จริงๆแล้วมันก็ไม่ได้ซับซ้อนอะไรขนาดนั้น ถ้าเราอ่านแบบง่ายๆเข้าใจง่ายๆ ทุกอย่างจะดูง่ายเอง แค่อย่าไปคิดเยอะครับ ไม่ต้องไปคิดแทนเขา เราคิดแค่ว่ามันบอกขึ้นลง แค่นั้นก็พอ เห็นมั้ยครับ ง่ายนิดเดียว และที่สำคัญต้องหมั่นฝึกฝนและทดสอบระบบเทรดและกลยุทธ์อย่างสม่ำเสมอนะ เพื่อเพิ่มประสิทธิภาพและลดข้อผิดพลาดในการเทรดเสมอ แล้วเราจะเก่งและกำไรเรื่อยๆครับ

What is a trading system? ระบบเทรคืออะไร?
What is a trading system?ระบบเทรด คืออะไร?
👰กลับมาพบกันอีกเช่นเคยกับการเทรดวิเคราะห์กราฟและการแชร์เทคนิคคอลแจ่มๆที่ใช้ดีและบอกต่อ วันนี้แอดมาไขข้อข้องใจเกี่ยวกับระบบเทรด เพราะหลาคนยังไม่รู้ว่าระบบเทรดคือะไร แล้วมันเริ่มยังไง มาครับ บทความนี้มีคำตอบ
ระบบเทรด ช่วยให้การเทรดเพื่อทำกำไรนั้นมีประสิทธิภาพสูง และมักจะประกอบด้วยหลายปัจจัยที่ทำให้มันโดดเด่นและน่าเชื่อถือ ขึ้นอยู่กับประเภทของการเทรดและขึ้นอยู่กับตัวบุคคลของคนนั้นด้วย ว่าชอบแนวไหน (เช่น หุ้น, Forex, Cryptocurrency) เพราะสไตล์การเทรดของแต่ละคนไม่เหมือนกัน (เช่น Scalping, Day Trading, Swing Trading)
ระบบเทรดที่ดีมักจะมีลักษณะดังนี้
1. ระบบเทรดอัตโนมัติ (Algorithmic Trading)
👀 Bot Trading: ใช้โปรแกรมหรือบอทเพื่อเทรดอัตโนมัติตามเงื่อนไขที่กำหนด เช่น RSI, MACD, Moving Average
👀 High-Frequency Trading (HFT): เทรดด้วยความเร็วสูง ใช้ประโยชน์จากความได้เปรียบทางเวลาและข้อมูล
2. ระบบเทรดแบบ Manual (มือถือ)
👀 Price Action: วิเคราะห์กราฟแท่งเทียนหรือรูปแบบราคาโดยไม่ใช้ Indicator
👀 Indicators-Based: ใช้ Indicator ต่างๆ เช่น Moving Average, Bollinger Bands, Fibonacci Retracement
3. ระบบเทรดที่ใช้ Machine Learning/AI
👀 ใช้ AI ในการวิเคราะห์ข้อมูลมหาศาลและทำนายแนวโน้มราคา
👀 ปรับตัวได้ตามสภาวะตลาดที่เปลี่ยนแปลง
4. ระบบเทรดที่ใช้ Risk Management ที่ดี
👀 Stop Loss/Take Profit: กำหนดจุดตัดขาดทุนและกำไรล่วงหน้า
👀 Position Sizing: จัดการขนาดการเทรดให้เหมาะสมกับพอร์ต
5. ระบบเทรดที่ใช้ Backtesting
👀 ทดสอบระบบกับข้อมูลในอดีตเพื่อประเมินประสิทธิภาพ
👀 ช่วยให้มั่นใจว่าระบบทำงานได้ดีในสภาวะตลาดต่างๆ
6. ระบบเทรดที่ใช้ Sentiment Analysis
👀 วิเคราะห์ความรู้สึกของตลาดจากข่าวสารหรือโซเชียลมีเดีย
👀 ช่วยทำนายทิศทางราคาจากปัจจัยทางจิตวิทยา
ตัวอย่างระบบเทรดยอดนิยม:
👉Moving Average Crossover: ใช้เส้น Moving Average สองเส้นตัดกันเพื่อหาจุดเข้า-ออก
👉 Breakout Trading: เทรดเมื่อราคา breakout จากระดับสำคัญ
👉Trend Following: เทรดตามแนวโน้มหลักของตลาด
เครื่องมือที่นิยมใช้:
👉 MetaTrader 4/5 (MT4/MT5): แพลตฟอร์มเทรด Forex และ CFD
👉TradingView: สำหรับวิเคราะห์กราฟและสร้างระบบเทรด
👉Python/R: สำหรับเขียน Algorithmic Trading
ข้อควรระวัง:
👋ไม่มีระบบเทรดใดที่ทำกำไรได้ 100% เสมอไป
👋 การจัดการความเสี่ยงเป็นสิ่งสำคัญที่สุด
👋 ควรทดสอบระบบกับบัญชีทดลองก่อนใช้จริง
👽👽👽เป็นอย่างไรกันบ้างครับ ถึงบางอ้อกันหรือยังฮะ จริงๆแล้วมันก็คือกลุทธิ์การเทรดนั่นแหละ แต่จัดวาและทำให้เป็นแบบแผน แล้วเราจะเทรดได้อย่างราบรื่น และกำไรมั่นคงฮะ และที่สำคัญต้องหมั่นฝึกฝนและทดสอบระบบเทรดและกลยุทธ์อย่างสม่ำเสมอนะ เพื่อเพิ่มประสิทธิภาพและลดข้อผิดพลาดในการเทรดเสมอ แล้วเราจะเก่งและกำไรเรื่อยๆครับ

How to Find the Entry Points for Beginner วิธีหาจุดเข้าของเทรดเด
How to Find the Entry Points for Beginner
วิธีหาจุดเข้าของเทรดเดอร์มือใหม่
👾 กลับมากันอีกเช่นเคยกับการเทรดวิเคราะห์กราฟและการแชร์เทคนิคคอลแจ่มๆที่ใช้ดีและบอกต่อ วันนี้แอดเอาใจคนชอบ Sell กับรูปแบบการเทรดสวนเทรนด์และการซอยไม้สั้นๆมาฝากฮะ มาครับตามมาอ่านกันได้เลย
หาจุดเข้าเทรดใครว่าง่าย?
ไม่ง่าย และก็ไม่ยากครับ ถ้าเราเริ่มสังเกตุและจดจำแพทเทรินง่ายๆสัก 2-3 ตัว มาครับมีแบบไหนบ้างมาดูกัน
1. ตีเทรนไลน์ก่อน
เทรนไลน์นั้นสำคัญจริงๆนะ เพราะมันช่วยให้เราอ่านเทรนด์ออกครับ ง่ายๆเลยแค่หาจุด ไฮ- โลว์ (High - Low) ให้เจอ ก็พอแล้ว เน้นเก็บสั้นScalping ในรอบสวิงเทรน เทรดได้ใน TF 1H ขึ้นไป
2. เข็มปลายไส้
หากลองสังเกตดีๆ เราจะเริ่มเข้าใจว่าสัญญาณหมี bear ที่เจ้ามือชอบตบลงนั้น คือการทำเข็มยาวๆหรือไส้แท่งเทียนยาวๆ ไว้ทำกำไรในการเทรด เทรดได้ใน เน้นเล่นสั้นฮะ หรือเน้นจบรายวัน
TF M5 , M15 ขึ้นไป
3. หลุดกรอบเส้นเทรนไลน์
เมื่อราคาอยู่ในกรอบเส้นเทรนไลน์ แล้วเกิดการกลับตัว จากการชนเส้นแนวต้านที่ High สูงสุดนั่นแหละฮะ สังเกตุกรอบเส้นเทรนไลน์เราให้ดี ถ้าหลุดลง โอกาสลงย่อมมีสูงครับ เทรดได้ใน TF 1H 4H ขึ้นไป
4. price pattern คือไวที่สุด
แน่นอนว่าแท่งเทียนเป็นสัญญาณการเทรดที่เร็วที่สุดครับ เครื่องมืออินดิเคเตอร์ ส่วนใหญ่ ไม่ไวเท่าแท่งเทียน ทำให้เราเข้าออเดอร์ได้ไวกว่า กำไรก่อนแน่นอน เทรดได้ใน TF M5 , M15 ขึ้นไป
👽👽👽เป็นอย่างไรกันบ้างครับ ทริคง่ายๆในการหาจุดเข้าเทรด ที่ดี๊ดี เทรดแล้วได้กำไรแน่นอน แต่หากผิดทางก็อย่าลืมที่จะตัดใจปิดออเดอร์นะครับ วันพระไม่ได้มีหนเดียว จังหวะกราฟก็ไม่ได้มีแค่รอบเดียวเช่นกัน
จริงๆยังมีทริคอีกเยอะเลยนะฮะ แต่นี่เป็นรูปแบบที่คนส่วนใหญ่ใช้เทรดกัน ลองเอาไปปรับใช้ให้เหมาะกับเราได้นะฮะ ไม่แน่ว่าการถือออเดอร์แป๊บเดียว หรือจบในวัน อาจทำให้เรามีความสุขมากกว่าการถือออเดอร์นานๆหลายวันก็เป็นได้และที่สำคัญ ฝึกฝนการเทรดให้ได้ทุกวัน รับรองว่ากำไรไม่ไกลเกินฝันแน่นอนฮะ แอดเอาใจช่วย แล้วอย่าลืม MM กันด้วยนะ ชีวิตการเทรดของเราจะยืนยาวและมั่นคง แอดฟันธงให้เลย

5 กฎเหล็กในการเทรด Scalping 5 กฎเหล็กในการเทรด Scalping
👺👺👺 กลับมาพบเจอกันอีกแล้วกับบทความดีๆ รวมไปถึงทริคและเทคนิคการเทรดดีๆ ที่แอดพร้อมมาแชร์ให้ได้รู้กัน โดยวันนี้เอาใจสายScalping ที่ชอบเก็บกำไรสั้นๆ การเทรดที่มาพร้อมกฎเห็กในการทำกำไร มาครับมาตามอ่านกันได้เลย
ในยุคสมัยที่โลกหมุนไวไปไวนี่เอง การเทรดก็ย่อมมาเร็วเคลมเร็วไม่ต่างกัน หากเราชื่นชอบการเทรด Scalping เราก็ควรต้องมีกฎเหล็กในการเข้าทำกำไรด้วย เพราะความเสี่ยงในการเทรดรูปแบบนี้จัดว่ามีความเสี่ยงค่อนข้างสูงมากครับ การวางแผนการเทรดที่ดีจึงช่วยให้เรามีกำไรที่สม่ำเสมอและชนะได้ง่ายขึ้นนั่นเอง
5 กฎในการเทรด Scalping
1. ยิ่งแพ้ยิ่งเป็นประสบการณ์
เพราะการเทรดไม่ได้มีคำว่าชนะอย่างเดียว เราจะมีแพ้ชนะ สลับกันไป แต่ที่ต้องจำให้ขึ้นใจคือ แพ้น้อยกว่าชนะได้ แต่กำไรต้องมากกว่า ไม้ที่แพ้เสมอ
2. ห้ามยอมแพ้เด็ดขาด
คุณต้องอยู่ในตลาดให้ได้นานมากที่สุด แม้ว่าออเดอร์ที่เข้าไปจะแพ้ก็ตาม ให้ยืนดูอยู่ข้างตลาดเอาไว้ก่อน แล้วมองหาโอกาสในการเทรดใหม่ (ที่ยืนอยู่บน Mindsetที่ดีด้วยนะ) เพราะโอกาสที่ดี มักมาในช่วงที่คนส่วนใหญ่เริ่มยอมแพ้กันหมดแล้ว
3.เริ่มจากทุนน้อยๆไปหาทุนมากๆ
อย่าเพิ่งเริ่มต้นด้วยทุนก้อนโต การค่อยเป็นค่อยไปช่วยให้เราคุ้นชินและมีประสบการณ์ที่ดีและไม่ดีร่วมกัน และทำให้เราแก้ปัญหา และหลบเลี่ยงเหตุการณ์เฉพาะหน้าได้ดียิ่งขึ้น
4. หมั่นตรวจสอบกลยุทธ์และประเมินผลลัพธ์บ่อยๆ
คล้ายกับการติดตามผลลัพธ์การเทรดนั่นแหละครับ แต่เราทำมากกว่านั้นด้วยการประเมินและวิเคราะห์กลยุทธ์ของเราตลอดเวลา อาจจะเป็นทุก3 เดือน 6 เดือน หรือปีละครั้ง ครับ
5. อย่าแหกกฎของตัวเอง
เชื่อว่าข้อสุดท้ายนี้ใครๆก็พูดได้แต่ทำยากมากที่สุด แต่จำไว้เถอะฮะ ถ้าคุณทำตามกฎการเทรดของตัวเองได้ เรื่องยากๆในชีวิตนี้จะดูง่ายขึ้นเยอะเลย จริงๆ
👽👽👽เป็นอย่างไรกันบ้างครับ หมั่นสำรวจและลองผิดลองถูกในกลยุทธ์ของตัวเอง แล้วพยายามสร้างกฎการเทรดให้ตัวเองที่ไม่ยากจนเกินไปจะทำให้เราไม่เครียด และทำตามกฎได้ง่ายขึ้น นะฮะ ว่าแล้วก็ลองไปลองเริ่มทำกันดูฮะ วางแผนดี มีชัยไปกว่าครึ่ง
และที่สำคัญ ฝึกฝนการเทรดให้ได้ทุกวัน รับรองว่ากำไรไม่ไกลเกินฝันแน่นอนฮะ แอดเอาใจช่วย แล้วอย่าลืม MM กันด้วยนะ ชีวิตการเทรดของเราจะยืนยาวและมั่นคง แอดฟันธงให้เลย

DE40 H4| แนวโน้มกลับตัวขาลงวิเคราะห์ DE40 กรอบเวลา H4 ราคากำลังมุ่งหน้าสู่ระดับ Pivot ที่ 19,323.1 ซึ่งเป็นแนวต้านในช่วง pullback ใกล้กับ Fibonacci retracement 50% หากเกิดการกลับตัว ราคามีแนวโน้มลดลงสู่แนวรับแรกที่ 19,050.8 แต่หากราคาทะลุระดับ Pivot ขึ้นไปได้ มีโอกาสปรับตัวขึ้นสู่แนวต้านที่ 19,503.8 ซึ่งเป็นแนวต้านจากจุดสูงสุดเดิม


DE30 ยังมีลุ้นยกตัวระยะสั้นทางด้านของดัชนีของเยอรมนีหรือเรียกว่า DE30 ดูเหมือนว่ายังคงมีความผันผวนในระยะสั้นหลังจากที่ดัชนีดาวโจนส์ฟิวเจอร์ยังคงมีความผันผวนระยะสั้นดังนั้นจับตาดูการประกาศประกาศ PPI วันนี้
ดังนั้นติดตามว่าทางด้านของการประกาศตัวเลขสำคัญนี้จะส่งผลทำให้ดัชนีนี้เป็นอย่างไรต้องติดตามกรอบแนวต้านสำคัญที่ 12,396
โดยที่กรอบแนวต้านสำคัญนี้อาจจะส่งผลทำให้ดัชนีนี้มีความผันผวนทั้งในระยะสั้นและระยะกลาง
ติดตามการประกาศเงินเฟ้อภาคการผลิตอย่างต่อเนื่องในวันที่ 19:30 น. ตามเวลาประเทศไทย

📢วางแผนเทรดGER40ด้วย Advance QM Demand Supply 20 กันยายน 2565GER40, DE30 BUY QM H1
เป็นการเทรดสวนเทรนขาลงของ Day, H4
รอ confirm QM m15 ขึ้นไปครับ
**ลดความเสี่ยงเนื่องจากสวนเทรน
SL ที่เหมาะสม คือโครงสร้างของชุด confirm ครับ
ซึ่ง Trade Setup QM ใน H1 มีปัจจัยทางเทคนิคดังนี้
1 Trend down Day, H4 (สวนเทรนใหญ่)
2 Demand Zone ( RBR, KINK )
3 QML
4 Sipport Day
5 Fibo Retracement 50-61.8
ช่วย Like Comment และกดติดตาม เพื่อเป็นกำลังใจให้ด้วยนะครับ
รายการตัวย่อ
RBR = Rally Base Rally
DBD = Drop Base Drop
SBR = Support Become Resistance
RBS = Resistance Become Support
R= Resistance
S= Support
TF= Time Frame
QM = Quasimodo Pattern
QMR = Quasimodo Reversal
QML = Quasimodo Level
QMC = Quasimodo Continuous
QMM = Quasimodo Manipulation
MPL = Maximum Pain Level
FRT = Fast Return
$$$ = Liquidity
TB = Throw Back
PB = Pull Back
CHoCH = Change of Character
**บทความนี้เป็นเพียงการวางแผนเทรดส่วนบุคคล ไม่ได้มีเจตนาชักชวนให้ลงทุนแต่อย่างใด การลงทุนมีความเสี่ยง ผู้ลงทุนควรศึกษาข้อมูลก่อนการตัดสินใจลงทุน

มุมมองการเทรด DE30EUR สำหนับอาทิตย์นี้ 8-12 ส.ค. 65 อาทิตย์นี้ DE30EUR หน้า BUY ได้เปรียบ หลังจากเดือนที่แล้วมีแรงซื้อเข้ามา มีการจบรอบ จึงวิ่งลงมา สามารถเข้าซื้อได้ตรงแนวรับ 13506.3 แต่เนื่องจากโมเมนตัมใน 4H เริ่มมีการอ่อนตัวอาจจะลงมาทำ Quasimodo pattern ข้างล่างที่ 12954.8 ควรเช็คสัญญาณเมื่อราคามาถึง
#Day trade #demand supply

Late Qmเกิด late QM
ราคาไปสร้าง fake outzone
ถ้าราคา ลงมาTest zone แบบ Quick retest เข้าได้เลย
แต่ถ้าราคาลงมาใช้ แบบ DownTrend รอเกิด Smart Entry


Dax [Short Plan] Head & Shoulder Short
หลังจากสัปดาห์ที่แล้วมี QE Tapering ประกาศออกมา
ทำให้เหล่า Index ในแต่ละชาติมีการปรับตัวขึ้นมามากมาย
จนในปัจจุบัน DAX Nasdaq ได้มีสัญญาณการปรับตัวลงที่ชัดเจน
จึงก่อให้เกิดสัญญาณ Short ออกมา โดยมี Condition ดังนี้
TF H4
- Head & Shoulder Structure
- Break Neckline
- Divergence H4
เล็งเป้า TP ไว้ที่ 15930 และ 15845 ตามลำดับ
มาดูกันว่าเราจะทำได้หรือไม่
Last week after Fed has been spoke about QE Tapering
This effect many indexes went up.
But this week we has been noticed that we got short signal on Nas , Dax.
So, We're decided to open short position by this factor.
TF H4
- Head & Shoulder Structure
- Break Neckline
- Divergence H4
Aimed to TP at 15930 and 15845
Let's see if we can do it

Dax [H4 Short Idea]
Dax Spring from last flip line and expects to reach new high.
After I've thinking properly,I plan to put short limit at 15898.1 by following reason
- Fibonacci extension Confluence 1.414 + 1.618
- Supply Zone H4
- Regular Divergence H4
Let's see if we can do it!
Dax ได้ทำการปรับตัวขึ้นจำนวนมากจากแนวต้าน และ คาดหวังว่าจะขึ้นทำจุดสูงสุดที่สูงขึ้นจากรอบล่าสุด
หลังจากผมได้ทำการ TP ขาขึ้นรอบล่าสุด และ ทำการทบทวนแล้ว จึงได้ทำการวางแผนทื่จะ Short Dax ที่ราคา 15898 ด้วยเหตุผลดังนี้
- Fibonacci extension Confluence 1.414 + 1.618
- Supply Zone H4
- Regular Divergence H4
มาดูกันว่าเราจะชนะกันอีกอบนึงมั้ย !

📣📣สัญญาณเทรด DE30 เทคนิค QM ที่น่าสนใจวันจันทร์ที่ 27-09-2021รายละเอียดแผน
ถึงแม้ว่าราคาจะขึ้นมาอีกครั้ง
แต่ผมยังมองว่าราคาขึ้นเพื่อลงต่อ
แค่ถ้าราคาขึ้นไปหลุด Hight ที่ราคา 15796.2
จะเปลี่ยนฝั่งเป็นเล่นหน้า Buy แทน
สัญญาณทางเทคนิคที่มีหลายปัจจัย Confluence กันดังนี้
1 QML TF H1
2 QML อยู่ใกล้ค่า Fibo 61.8
3 มี DBD ใน TF M30 อยู่ใกล้เส้น QML
4 RSI Divergence ใน TF M30
สรุป รอเด้ง Sell ตามราคากรอบ Zone ที่ให้ไว้ หรือ Follow Sell ณ เวลานี้ได้เลย
MM ด้วยนะครับใกล้สิ้นเดือนเจ้าจะทำอะไรก็ได้
ใครได้กำไรหรือไอเดียในการเทรด
ช่วย Like Comment และกดติดตาม เพื่อเป็นกำลังใจให้ด้วยนะครับ
Korn Trade For Live
ทำกำไรแล้วใช้ชีวิต
รายการตัวย่อ
RBR = Rally Base Rally
DBD = Drop Base Drop
SBR = Support Become Resistance
RBS = Resistance Become Support
R= Resistance
S= Support
TF= Time Frame
QM = Quasimodo Pattern
QMR = Quasimodo Reversal
QML = Quasimodo Level
QMC = Quasimodo Continuous
QMM = Quasimodo Manipulation

อธิบายเทคนิคเทรด DE30 Demand Supply ที่น่าสนใจวันที่ 24-09-2021อธิบายเทคนิคที่ใช้เข้าเทรด
รอบที่แล้วแผนนี้ SL แต่เมื่อดูลักษณะราคาวิ่ง ณ เวลาตลาดเปิด
คือ การวิ่งมาเคลีย์ SL ของคนที่เปิดสถานะ Sell
ซึ่งส่วนตัวมองว่าราคาขึ้นเพื่อลงต่อ
ดังนั้น ผมจะ Sell ลงไปต่อ
แต่ทั้งนี้จะรอสัญญาณ Price Action Pin Bar ที่ TF H1 สร้างเสร็จก่อน
หรือไม่ก็รอเกิด QM ใน TF M30
แต่ถ้าราคาทำ Higher Height ก็ยอม
และจะเปลี่ยนหน้าเทรดเป็น Buy แทน
สัญญาณเทรด DE30 ที่มีหลายปัจจัย Confluence กัน
- Supply Zone DBD TF H1
- SBR แนวต้าน R1,2 TF H1
- Supply Zone อยู่ใกล้กับ Fibo 61.8
- Price Pattern Rising Wedge
- Price Action Pin Bar
สรุป
1 รอ Sell เมื่อราคาเข้า Zone แต่ต้องรอ Price Action Pin Bar TF H1
2 รอ Price Pattern QM
ถ้าราคา Action อย่างไร เด๋วจะอัพเดทแผนให้นะครับ
Korn Trade For Live
ทำกำไรแล้วใช้ชีวิต
สมการความสำเรํจในการเทรด
Technical 10%
Money Management 10%
Mindset 80%
รายการตัวย่อ
RBR = Rally Base Rally
DBD = Drop Base Drop
SBR = Support Become Resistance
RBS = Resistance Become Support
R= Resistance
S= Support
TF= Time Frame
QM = Quasimodo Pattern

DE30 สัญญาณเทรดเทคนิค Demand Supply ที่น่าสนใจวันที่ 24-09-2021รอบที่แล้วแผนนี้ SL แต่เมื่อดูลักษณะราคาวิ่ง ณ เวลาตลาดเปิด
คือ การวิ่งมาเคลีย์ SL ของคนที่เปิดสถานะ Sell
ซึ่งส่วนตัวมองว่าราคาขึ้นเพื่อลงต่อ
ดังนั้น ผมจะ Sell ลงไปต่อ
แต่ทั้งนี้จะรอสัญญาณ Price Action Pin Bar ที่ TF H1 สร้างเสร็จก่อน
หรือไม่ก็รอเกิด QM ใน TF M30
แต่ถ้าราคาทำ Higher Height ก็ยอม
และจะเปลี่ยนหน้าเทรดเป็น Buy แทน
สัญญาณเทรด DE30 ที่มีหลายปัจจัย Confluence กัน
- Supply Zone DBD TF H1
- SBR แนวต้าน R1,2 TF H1
- Supply Zone อยู่ใกล้กับ Fibo 61.8
- Price Pattern Rising Wedge
- Price Action Pin Bar
สรุป
1 รอ Sell เมื่อราคาเข้า Zone แต่ต้องรอ Price Action Pin Bar TF H1
2 รอ Price Pattern QM
ถ้าราคา Action อย่างไร เด๋วจะอัพเดทแผนให้นะครับ
Korn Trade For Live
ทำกำไรแล้วใช้ชีวิต
สมการความสำเรํจในการเทรด
Technical 10%
Money Management 10%
Mindset 80%
รายการตัวย่อ
RBR = Rally Base Rally
DBD = Drop Base Drop
SBR = Support Become Resistance
RBS = Resistance Become Support
R= Resistance
S= Support
TF= Time Frame
QM = Quasimodo Pattern

สัญญาณเทรด DE30 เทคนิค Demand Supply ที่น่าสนใจวันที่ 23-09-2021สัญญาณเทรด DE30 ที่มีหลายปัจจัย Confluence กัน
- Supply Zone DBD TF H1
- SBR แนวต้าน R1,2 TF H1
- Supply Zone อยู่ใกล้กับ Fibo 61.8
- Price Pattern Rising Wedge
*** Awesome Oscillator ยังไม่เกิด Divergence ***
สรุป รอ Sell เมื่อราคาเข้า Zone แต่ต้องรอ Awesome Oscillator เกิด Divergence เพื่อ Confirm ก่อนเข้าเทรด
แต่ถ้าราคาลงก่อนไม่ถึง Zone ให้รอจังหวะราคาขึ้นมา Retest แล้วค่อย Sell
ถ้าราคา Action อย่างไร เด๋วจะอัพเดทแผนให้นะครับ
ผมรอเทรดอยู่เหมือนกัน
Korn Trade For Live
ทำกำไรแล้วใช้ชีวิต
สมการความสำเรํจในการเทรด
Technical 10%
Money Management 10%
Mindset 80%
รายการตัวย่อ
RBR = Rally Base Rally
DBD = Drop Base Drop
SBR = Support Become Resistance
RBS = Resistance Become Support
R= Resistance
S= Support
TF= Time Frame


DAX - Thursday 1 MAR 2018DAX ยังคงอยู่ภายใต้แรงกดดันเช่นกัน เมื่อวันพฤหัสบดีที่ผ่านมา ขณะที่ผู้ขายดึงดัชนีออกห่างจาก 12400 ในตอนเช้า แล้วทำราคาลงตลอดช่วงเซสชั่นยุโรป และทดสอบที่ระดับ 12200 แนวต้านอยู่ที่ 12300 ส่วนแนวรับอยู่ที่ 12200
หากฝั่งผู้ขายสามารถผ่านระดับ 12200 ไปได้ ดัชนี DAX จะลงอย่างต่อเนื่องไปยัง 12100

DAX - Friday 23 FEB 2018ดัชนี DAX ขึ้นไปแตะระดับ 12500 ในตอนเช้า ฝั่งผู้ซื้อไม่สามารถรักษาระดับนี้ไว้ได้ และดัชนีก็หล่นลงจากระดับสูงสุดของวัน แนวต้านอยู่ที่ 12500 จุด ส่วนแนวรับอยู่ที่ 12400 จุด
แรงกดดันด้านลบดูเหมือนยังคงมีอยู่ต่อไป เว้นแต่ว่าดัชนี DAX จะสามารถอยู่เหนือ 12400 จุดได้ DAX เป็นไปได้ว่าจะลงต่อ และเคลื่อนที่อยู่บริเวณแนวรับที่ 12400 ซึ่งมีเส้น EMA50 อยู่ ถ้าหากหลุดไปได้จะลงไปยังแนวรับกัดไปที่ 12300 จุด
