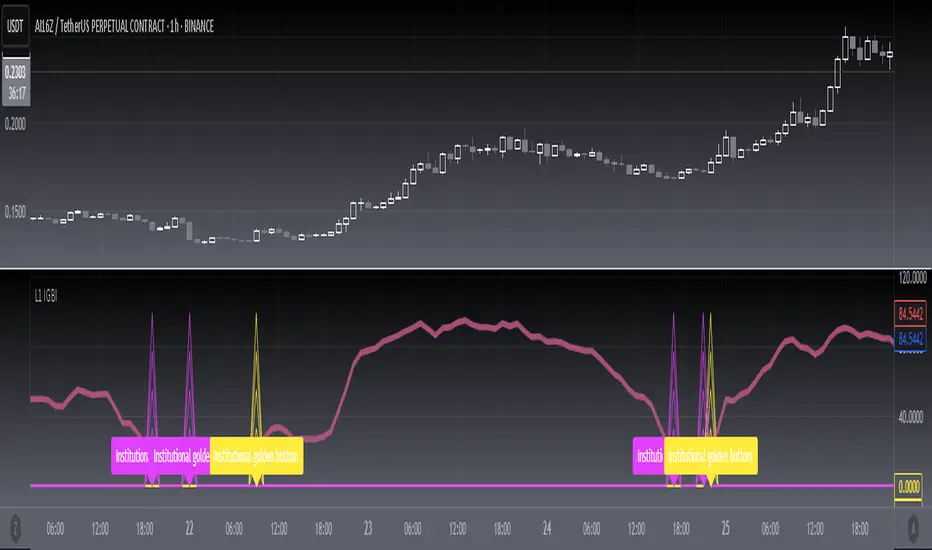
[blackcat] L1 Institutional Golden Bottom Indicator█ OVERVIEW
The script " L1 Institutional Golden Bottom Indicator" is an indicator designed to identify potential institutional buying interest or a "golden bottom" in the market. It calculates a series of values based on price movements and plots them on a chart to help traders make informed decisions.
█ LOGICAL FRAMEWORK
The script is structured into several main sections:
1 — Function Definitions: Custom functions xsa and calculate_institutional_golden_bottom are defined.
2 — Input Parameters: The user can set a threshold value for institutional interest.
3 — Calculations: The script calculates various indicators and conditions, including the institutional buy signal.
4 — Plotting: The results of the calculations are plotted on the chart.
5 — Labeling: When a golden bottom is detected, a label is placed on the chart.
The flow of data starts with the input parameters, proceeds through the calculation functions, and finally results in plotted outputs and labels.
█ CUSTOM FUNCTIONS
1 — xsa(src, len, wei)
• Purpose: To calculate a weighted moving average.
• Parameters:
– src: Source data (e.g., price).
– len: Length of the moving average.
– wei: Weighting factor.
• Return Value: The calculated weighted moving average.
2 — calculate_institutional_golden_bottom(close, high, low, threshold)
• Purpose: To determine the institutional golden bottom indicator.
• Parameters:
– close: Closing price.
– high: Highest price.
– low: Lowest price.
– threshold: User-defined threshold for institutional interest. By tuning the threshold value the user can properly identify the institutional golden bottom of the instrument. So, I can say this parameter is used to tune the "sensitivity" of this indicator.
• Return Value: An array containing the institutional indicator, golden bottom signal, and additional values (a1, b1, c1, d1).
█ KEY POINTS AND TECHNIQUES
• Weighted Moving Average (WMA): The xsa function implements a weighted moving average, which is useful for smoothing price data.
• Crossover Detection: The script uses a crossover condition to detect when the institutional indicator crosses above the threshold, indicating a potential buying opportunity.
• Conditional Logic: The script includes conditional statements to control the output of certain values only when specific conditions are met.
• Plotting and Labeling: The script uses plot and label.new functions to visualize the indicator and highlight significant events on the chart.
█ EXTENDED KNOWLEDGE AND APPLICATIONS
• Modifications: The script could be enhanced by adding more customizable parameters, such as different lengths for the moving averages or additional conditions for the golden bottom signal.
• Extensions: Similar techniques could be applied to other types of indicators, such as momentum oscillators or trend-following systems to identify market turning points.
• Related Concepts: Understanding weighted moving averages, crossover signals, and conditional plotting in Pine Script would be beneficial for enhancing this script and applying similar logic to other trading strategies.
การวิเคราะห์คลื่น
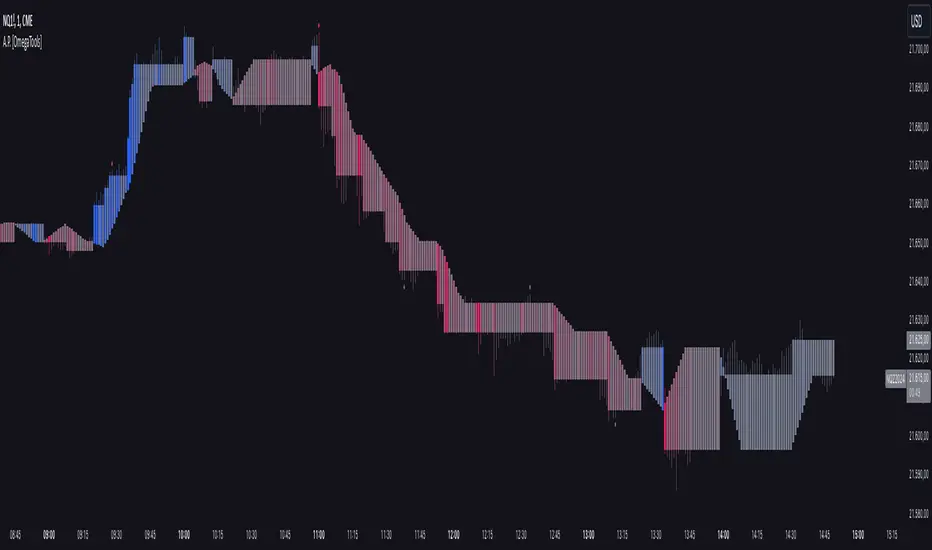
Alternative Price [OmegaTools]The Alternative Price script is a sophisticated and flexible indicator designed to redefine how traders visualize and interpret price data. By offering multiple unique charting modes, robust customization options, and advanced features, this tool provides a comprehensive alternative to traditional price charts. It is particularly useful for identifying market trends, detecting patterns, and simplifying complex data into actionable insights.
This script is highly versatile, allowing users to choose from five distinct charting modes: Candles, Line, Channel, Renko, and Bubbles. Each mode serves a unique purpose and presents price information in an innovative way. When using this script, it is strongly recommended to hide the platform’s default price candles or chart data. Doing so will eliminate redundancy and provide a clearer and more focused view of the alternative price visualization.
The Candles mode offers a traditional candlestick charting style but with added flexibility. Users can choose to enable smoothed opens or smoothed closes, which adjust the way the open and close prices are calculated. When smoothed opens are enabled, the opening price is computed as the average of the actual open price and the closing prices of the previous two bars. This creates a more gradual representation of price transitions, particularly useful in markets prone to sudden spikes or irregularities. Similarly, smoothed closes modify the closing price by averaging it with the previous close, the high-low midpoint, and an exponential moving average of the high-low-close mean. This technique filters out noise, making trends and price momentum easier to identify.
In the Line mode, the script displays a simple line chart that connects the smoothed closing prices. This mode is ideal for traders who prefer minimalism or need to focus on the overall trend without the distraction of individual bar details. The Channel mode builds upon this by plotting additional lines representing the highs and lows of each bar. The resulting visualization resembles a price corridor that helps identify support and resistance zones or price compression areas.
The Renko mode introduces a more advanced and noise-filtering method of visualizing price movements. Renko charts, constructed using the ATR (Average True Range) as a baseline, display blocks that represent a specific price range. The script dynamically calculates the size of these blocks based on ATR, with separate thresholds for upward and downward movements. This makes Renko mode particularly effective for identifying sustained trends while ignoring minor price fluctuations. Additionally, the open and close values of Renko blocks can be smoothed to further refine the visualization.
The Bubbles mode represents price activity using circles or bubbles whose size corresponds to relative volume. This mode provides a quick and intuitive way to assess market participation at different price levels. Larger bubbles indicate higher trading volumes, while smaller bubbles highlight periods of lower activity. This visualization is particularly valuable in understanding the relationship between price movements and market liquidity.
The coloring of candles and other chart elements is a core feature of this script. Users can select between two color modes: Normal and Volume. In Normal mode, bullish candles are displayed in the user-defined bullish color, while bearish candles use the bearish color. Neutral elements, such as midpoints or undecided price movements, are shaded with a neutral color. In Volume mode, the candle colors are dynamically adjusted based on trading volume. A gradient color scale is applied, where the intensity of the bullish or bearish colors reflects the volume for that particular bar. This feature allows traders to visually identify periods of heightened activity and associate them with specific price movements.
Engulfing patterns, a popular technical analysis tool, are automatically detected and marked on the chart when the corresponding setting is enabled. The script identifies long engulfing patterns, where the current bar's range completely encompasses the previous bar’s range and indicates a potential bullish reversal. Similarly, short engulfing patterns are identified where the current bar fully engulfs the previous bar in the opposite direction, suggesting a bearish reversal. These patterns are visually highlighted with circular markers to draw the trader’s attention.
Each feature and mode is highly customizable. The colors for bullish, bearish, and neutral movements can be personalized, and the thresholds for patterns or smoothing can be fine-tuned to match specific trading strategies. The script's ability to toggle between various modes makes it adaptable to different market conditions and analysis preferences.
In summary, the Alternative Price script is a comprehensive tool that redefines the way traders view price charts. By offering multiple visualization modes, customizable features, and advanced detection algorithms, it provides a powerful way to uncover market trends, volume relationships, and significant patterns. The recommendation to hide default chart elements ensures that the focus remains on this innovative tool, enhancing its usability and clarity. This script empowers traders to gain deeper insights into market behavior and make informed trading decisions, all while maintaining a clean and visually appealing chart layout.
Keep in mind that some of the modes of this indicator might not reflect the actual closing price of the underlying asset, before opening a trade, check carefully the actual price!
CDV Momentum WaveDescription:
This indicator visualizes the Cumulative Delta Volume (CDV) as waves, providing traders with insights into the momentum and strength of buying and selling activity. By tracking the cumulative difference between buying and selling pressure, it highlights shifts in market sentiment with color-coded wave patterns.
How to Use:
Spot Momentum:
Green waves signify strong buying pressure, while red waves indicate dominant selling pressure. Blue and orange waves mark transitions or weaker momentum.
Trend Analysis:
Persistent color and direction in waves reflect a strong trend, while frequent shifts may signal reversals or consolidation.
Sensitivity Adjustment:
Use the mul2 setting to fine-tune wave responsiveness for short-term or long-term analysis.
Wave Position Adjustment:
The osx setting adjusts the visual placement of the waves on the chart.
By default (osx = 0), the waves are aligned directly with the candle data they are calculated from.
Increasing osx shifts the waves forward.
Decreasing osx shifts the waves backward.
This tool helps traders detect momentum shifts, confirm trends, and understand volume dynamics in various market conditions.

Total Volume for Custom PeriodIndicator Description: Total Volume for Custom Period
This indicator calculates the total trading volume for a specified time period and displays the result in the top-right corner of the chart. It is designed for traders and analysts who want to see the cumulative volume over a defined range of time without needing to calculate it manually.
Features:
Customizable Time Period:
Define the start and end times of the calculation using the easy-to-use settings panel.
The indicator dynamically updates as you adjust the dates.
Accurate Volume Calculation:
Calculates the total trading volume for all candlesticks between the selected start and end dates.
Works on all assets and timeframes supported by TradingView (stocks, crypto, forex, etc.).
Fixed Display:
The result is displayed in the top-right corner of the chart inside a clear and simple table.
The value remains visible regardless of chart movement or zoom level.
Real-time Updates:
Automatically recalculates the volume when new data is added or the selected time period changes.
Customizable Design:
Black text with a transparent background ensures the display is clear and non-intrusive.
Large text size for easy readability.
Use Cases:
Volume Analysis: Quickly assess the total trading activity over a specific time period.
Historical Data Analysis: Compare volume data across different time intervals.
Custom Strategies: Use the total volume metric as part of a broader trading strategy or analysis.
How It Works:
Open the settings panel of the indicator and input the desired Start Date and End Date.
The indicator calculates the total trading volume for all candles within the selected range.
The result is displayed in the top-right corner of the chart.
This indicator is a simple yet powerful tool for traders who rely on volume analysis to make informed decisions. It enhances your ability to study market behavior during specific periods and provides insights into trading activity with ease.

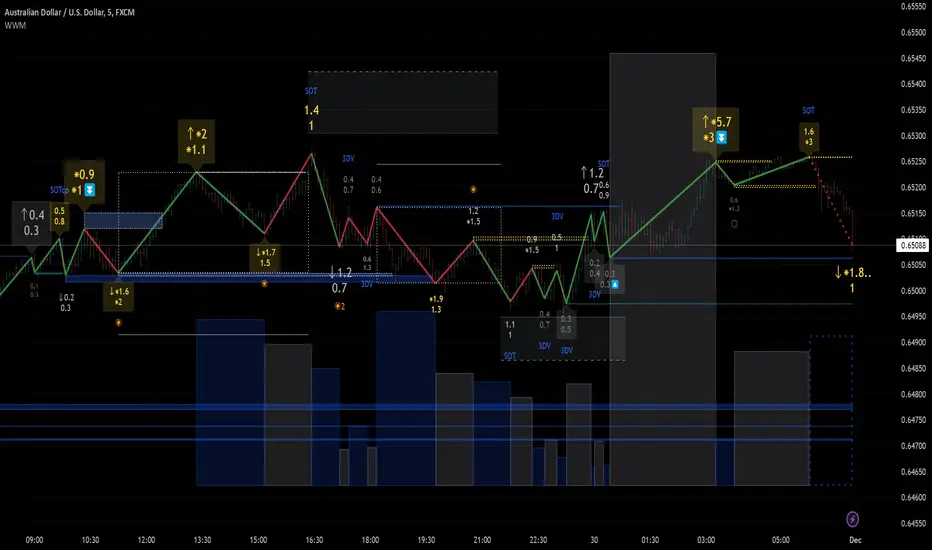
Weis Wave Max█ Overview
Weis Wave Max is the result of my weis wave study.
David Weis said,
"Trading with the Weis Wave involves changes in behavior associated with springs, upthrusts, tests of breakouts/breakdowns, and effort vs reward. The most common setup is the low-volume pullback after a bullish/bearish change in behavior."
THE STOCK MARKET UPDATE (February 24, 2013)
I inspired from his sentences and made this script.
Its Main feature is to identify the largest wave in Weis wave and advantageous trading opportunities.
█ Features
This indicator includes several features related to the Weis Wave Method.
They help you analyze which is more bullish or bearish.
Highlight Max Wave Value (single direction)
Highlight Abnormal Max Wave Value (both directions)
Support and Resistance zone
Signals and Setups
█ Usage
Weis wave indicator displays cumulative volume for each wave.
Wave volume is effective when analyzing volume from VSA (Volume Spread Analysis) perspective.
The basic idea of Weis wave is large wave volume hint trend direction. This helps identify proper entry point.
This indicator highlights max wave volume and displays the signal and then proper Risk Reward Ratio entry frame.
I defined Change in Behavior as max wave volume (single direction).
Pullback is next wave that does not exceed the starting point of CiB wave (LH sell entry, HL buy entry).
Change in Behavior Signal ○ appears when pullback is determined.
Change in Behavior Setup (Entry frame) appears when condition of Min/Max Pullback is met and follow through wave breaks end point of CiB wave.
This indicator has many other features and they can also help a user identify potential levels of trade entry and which is more bullish or bearish.
In the screenshot below we can see wave volume zones as support and resistance levels. SOT and large wave volume /delta price (yellow colored wave text frame) hint stopping action.
█ Settings
Explains the main settings.
-- General --
Wave size : Allows the User to select wave size from ① Fixed or ② ATR. ② ATR is Factor x ATR(Length).
Display : Allows the User to select how many wave text and zigzag appear.
-- Wave Type --
Wave type : Allows the User to select from Volume or Volume and Time.
Wave Volume / delta price : Displays Wave Volume / delta price.
Simplified value : Allows the User to select wave text display style from ① Divisor or ② Normalized. Normalized use SMA.
Decimal : Allows the User to select the decimal point in the Wave text.
-- Highlight Abnormal Wave --
Highlight Max Wave value (single direction) : Adds marks to the Wave text to highlight the max wave value.
Lookback : Allows the User to select how many waves search for the max wave value.
Highlight Abnormal Wave value (both directions) : Changes wave text size, color or frame color to highlight the abnormal wave value.
Lookback : Allows the User to select SMA length to decide average wave value.
Large/Small factor : Allows the User to select the threshold large wave value and small wave value. Average wave value is 1.
delta price : Highlights large delta price by large wave text size, small by small text size.
Wave Volume : Highlights large wave volume by yellow colored wave text, small by gray colored.
Wave Volume / delta price : highlights large Wave Volume / delta price by yellow colored wave text frame, small by gray colored.
-- Support and Resistance --
Single side Max Wave Volume / delta price : Draws dashed border box from end point of Max wave volume / delta price level.
Single side Max Wave Volume : Draws solid border box from start point of Max wave volume level.
Bias Wave Volume : Draws solid border box from start point of bias wave volume level.
-- Signals --
Bias (Wave Volume / delta price) : Displays Bias mark when large difference in wave volume / delta price before and after.
Ratio : Decides the threshold of become large difference.
3Decrease : Displays 3D mark when a continuous decrease in wave volume.
Shortening Of the Thrust : Displays SOT mark when a continuous decrease in delta price.
Change in Behavior and Pullback : Displays CiB mark when single side max wave volume and pullback.
-- Setups --
Change in Behavior and Pullback and Breakout : Displays entry frame when change in behavior and pullback and then breakout.
Min / Max Pullback : Decides the threshold of min / max pullback.
If you need more information, please read the indicator's tooltip.
█ Conclusion
Weis Wave is powerful interpretation of volume and its tell us potential trend change and entry point which can't find without weis wave.
It's not the holy grail, but improve your chart reading skills and help you trade rationally (at least from VSA perspective).
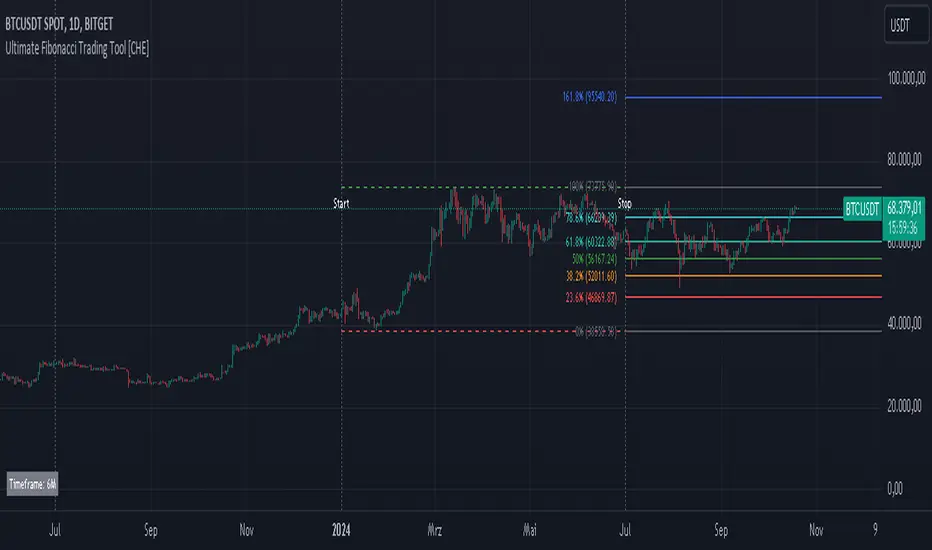
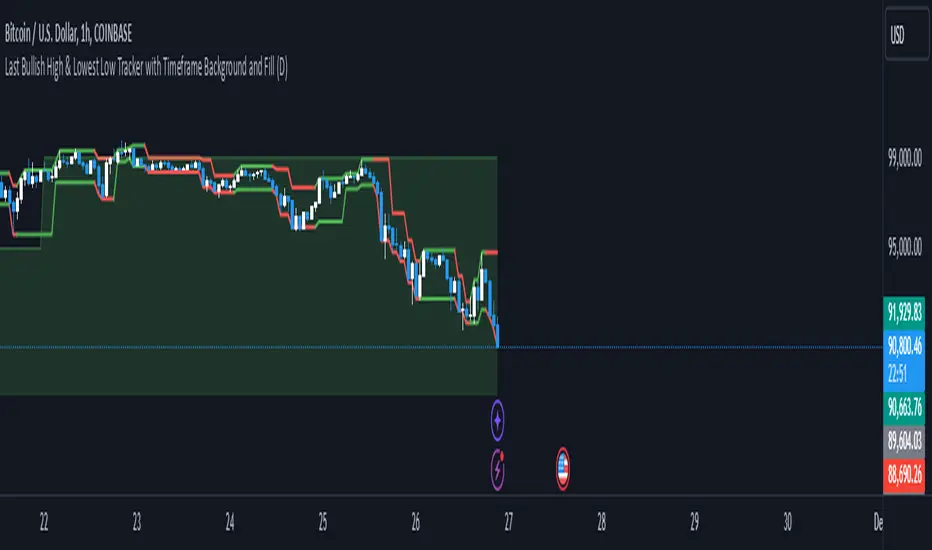
Richs Market StructureThis Pine Script indicator, "Last Bullish High & Lowest Low Tracker with Timeframe Background and Fill", is designed to visually track bullish and bearish trends based on price action on the current chart and a user-defined timeframe. It provides dynamic line plotting, area fills, and background coloring to represent trend alignment between the current chart and the selected timeframe.
Features and Functionalities
Tracks Bullish Highs and Bearish Lows:
The script identifies:
Bullish High: The highest price reached after a bullish (green) candle.
Bearish Low: The lowest price reached after a bearish (red) candle.
It dynamically updates these levels based on the price movements.
Line Plotting:
Current Chart Lines:
The Plotted Bullish High line (green/red) indicates the last bullish high.
The Lowest Low line (green/red) indicates the last bearish low.
Selected Timeframe Lines:
A separate set of lines is plotted for the user-defined timeframe (e.g., daily, weekly):
A Bullish High Line for the selected timeframe (lighter green).
A Lowest Low Line for the selected timeframe (lighter red).
Dynamic Area Fills:
The area between the Plotted Bullish High and Lowest Low is filled:
Green Fill: When both lines are green (indicating a bullish alignment).
Red Fill: When both lines are red (indicating a bearish alignment).
For the selected timeframe:
The area between the timeframe-specific Bullish High and Lowest Low is similarly filled with lighter colors.
Background Color Based on Timeframe Alignment:
The background color represents the trend alignment on the selected timeframe:
Green Background: When the timeframe’s Bullish High is rising and Lowest Low is rising (bullish trend).
Red Background: When the timeframe’s Bullish High is falling and Lowest Low is falling (bearish trend).
What It’s For
This indicator is designed for traders who want to:
Visualize Trends Across Timeframes:
It helps identify when the current chart’s trend aligns with a higher timeframe trend (e.g., daily, weekly).
Useful for multi-timeframe analysis.
Spot Bullish and Bearish Trends:
The color-coded lines and fills clearly show the dominant trend on both the current chart and the selected timeframe.
Plan Trades Based on Trend Alignment:
When the current chart and selected timeframe show the same trend:
Both lines and fills turn green (bullish).
Both lines and fills turn red (bearish).
This alignment is a potential signal for entering long or short trades.
Identify Reversals and Divergences:
Divergence between the current chart and timeframe trends (e.g., green on one, red on the other) may indicate trend weakening or reversal.
Visual Elements
Lines:
Solid lines (current chart): Represent the Plotted Bullish High and Lowest Low.
Dashed/lighter lines (selected timeframe): Represent the timeframe-specific Bullish High and Lowest Low.
Fills:
Green/Red fills highlight trend zones:
On the current chart (darker).
On the selected timeframe (lighter).
Background:
The entire chart background turns green or red based on the selected timeframe’s trend alignment.
Summary
This indicator is ideal for traders who want a clear visual representation of price trends and multi-timeframe alignment. It simplifies trend-following strategies by providing:
Easy-to-interpret fills and background colors.
Clear bullish and bearish zones.
Multi-timeframe trend confirmation.
High and Retracement Finder
This Pine Script indicator, titled "High and Retracement Finder," is designed to identify significant highs and lows on a price chart based on a user-defined starting point and retracement threshold. It begins analysis from a manually set bar index and tracks the highest high until the price retraces by a specified percentage (retracement threshold). Once this retracement occurs, it switches focus to finding the lowest low. If the price surpasses the previous high during this phase, the cycle resets, and the script resumes tracking a new highest high. The script visually marks these significant highs and lows with arrows on the chart, helping traders identify potential turning points or retracements in the market.

Trend Speed Analyzer (Zeiierman)█ Overview
The Trend Speed Analyzer by Zeiierman is designed to measure the strength and speed of market trends, providing traders with actionable insights into momentum dynamics. By combining a dynamic moving average with wave and speed analysis, it visually highlights shifts in trend direction, market strength, and potential reversals. This tool is ideal for identifying breakout opportunities, gauging trend consistency, and understanding the dominance of bullish or bearish forces over various timeframes.
█ How It Works
The indicator employs a Dynamic Moving Average (DMA) enhanced with an Accelerator Factor, allowing it to adapt dynamically to market conditions. The DMA is responsive to price changes, making it suitable for both long-term trends and short-term momentum analysis.
Key components include:
Trend Speed Analysis: Measures the speed of market movements, highlighting momentum shifts with visual cues.
Wave Analysis: Tracks bullish and bearish wave sizes to determine market strength and bias.
Normalized Speed Values: Ensures consistency across different market conditions by adjusting for volatility.
⚪ Average Wave and Max Wave
These metrics analyze the size of bullish and bearish waves over a specified Lookback Period:
Average Wave: This represents the mean size of bullish and bearish movements, helping traders gauge overall market strength.
Max Wave: Highlights the largest movements within the period, identifying peak momentum during trend surges.
⚪ Current Wave Ratio
This feature compares the current wave's size against historical data:
Average Wave Ratio: Indicates if the current momentum exceeds historical averages. A value above 1 suggests the trend is gaining strength.
Max Wave Ratio: Shows whether the current wave surpasses previous peak movements, signaling potential breakouts or trend accelerations.
⚪ Dominance
Dominance metrics reveal whether bulls or bears have controlled the market during the Lookback Period:
Average Dominance: Compares the net difference between average bullish and bearish wave sizes.
Max Dominance: Highlights which side had the stronger individual waves, indicating key power shifts in market dynamics.
Positive values suggest bullish dominance, while negative values point to bearish control. This helps traders confirm trend direction or anticipate reversals.
█ How to Use
Identify Trends: Leverage the color-coded candlesticks and dynamic trend line to assess the overall market direction with clarity.
Monitor Momentum: Use the Trend Speed histogram to track changes in momentum, identifying periods of acceleration or deceleration.
Analyze Waves: Compare the sizes of bullish and bearish waves to identify the prevailing market bias and detect potential shifts in sentiment. Additionally, fluctuations in Current Wave ratio values should be monitored as early indicators of possible trend reversals.
Evaluate Dominance: Utilize dominance metrics to confirm the strength and direction of the current trend.
█ Settings
Maximum Length: Sets the smoothing of the trend line.
Accelerator Multiplier: Adjusts sensitivity to price changes.
Lookback Period: Defines the range for wave calculations.
Enable Table: Displays statistical metrics for in-depth analysis.
Enable Candles: Activates color-coded candlesticks.
Collection Period: Normalizes trend speed values for better accuracy.
Start Date: Limits calculations to a specific timeframe.
Timer Option: Choose between using all available data or starting from a custom date.
-----------------
Disclaimer
The information contained in my Scripts/Indicators/Ideas/Algos/Systems does not constitute financial advice or a solicitation to buy or sell any securities of any type. I will not accept liability for any loss or damage, including without limitation any loss of profit, which may arise directly or indirectly from the use of or reliance on such information.
All investments involve risk, and the past performance of a security, industry, sector, market, financial product, trading strategy, backtest, or individual's trading does not guarantee future results or returns. Investors are fully responsible for any investment decisions they make. Such decisions should be based solely on an evaluation of their financial circumstances, investment objectives, risk tolerance, and liquidity needs.
My Scripts/Indicators/Ideas/Algos/Systems are only for educational purposes!

3 Drive Harmonic Pattern [TradingFinder] Three Drive Reversal🔵 Introduction
The Three Drive harmonic pattern closely resembles other price structures such as Wedge Pattern and Three Push Pattern, yet it stands out due to its precise use of Fibonacci ratios and symmetrical price movements.
This pattern comprises three consecutive and symmetrical price drives, each validated by key Fibonacci ratios (1.27 and 1.618), which help identify critical Potential Reversal Zones (PRZ).
Unlike the Wedge, which relies on converging trend lines and can indicate either continuation or reversal, and the Three Push, which lacks defined Fibonacci ratios and symmetry, the Three Drive pattern defines PRZ with greater accuracy, providing traders with high-probability trading opportunities.
This pattern appears in both bullish and bearish trends. After the completion of the third drive (Drive 3), it signals the market's readiness to reverse direction. The PRZ in this pattern serves as a crucial zone where price is highly likely to reverse, offering a strategic point for entering or exiting trades. Professional traders utilize the Three Drive pattern and PRZ as essential tools for analyzing and capitalizing on potential market reversals.
Bullish Pattern :
Bearish Pattern :
🔵 How to Use
The Three Drive harmonic pattern is an effective tool for identifying potential reversal points in the market. By utilizing Fibonacci extension levels (1.27 and 1.618) and focusing on the pattern’s symmetry, traders can pinpoint Potential Reversal Zones (PRZ) where the price is likely to change direction. This pattern works in both bearish and bullish scenarios, each with distinct characteristics and trading opportunities.
🟣 Bullish Three Drive Pattern
The bullish Three Drive pattern develops during a downtrend, indicating a potential reversal to the upside. Similar to its bearish counterpart, this pattern features three consecutive downward price movements (drives) with retracements in between. The third drive concludes within the PRZ, which serves as a strong support zone where the price is expected to reverse upwards.
The first drive begins with a downward movement, followed by a retracement to the 0.618 Fibonacci level. The second drive continues downward to reach a 1.27 or 1.618 Fibonacci extension of the retracement. Finally, the third drive aligns with the PRZ, where a confluence of Fibonacci levels creates a high-probability support zone.
In the PRZ, traders look for bullish confirmation signals such as bullish candlestick patterns (e.g., bullish engulfing or pin bars) or increasing trading volume. Once confirmation is observed, the PRZ becomes an ideal entry point for a buy position. Stop-loss orders are placed slightly below the PRZ to minimize risk, while take-profit targets are set at key resistance levels or Fibonacci retracement levels.
🟣 Bearish Three Drive Pattern
The bearish Three Drive pattern forms during an uptrend, signaling a potential reversal to the downside. This pattern consists of three consecutive upward price movements (drives) and intermediate retracements. Each drive aligns with Fibonacci extension levels, and the third drive ends within the PRZ, indicating a high probability of a bearish reversal.
In the first drive, the price moves upward and then retraces to approximately the 0.618 Fibonacci retracement level, forming the base for the second drive. The second drive then extends upward to the 1.27 or 1.618 Fibonacci extension of the preceding retracement. This process repeats for the third drive, which reaches the PRZ, typically defined by the convergence of Fibonacci levels from previous drives.
Once the PRZ is identified, traders look for confirmation signals such as bearish candlestick patterns (e.g., bearish engulfing or pin bars) or declining trading volume. If confirmation is present, the PRZ becomes an optimal zone for entering a sell position. Stop-loss levels are typically placed slightly above the PRZ to protect against pattern failure, and take-profit targets are set at key support levels or Fibonacci retracement levels of the overall structure.
🟣 Three Drive Vs Wedge Pattern Vs 3 Push pattern
The Three Drive, Wedge, and Three Push patterns are all used to identify potential price reversal points, but they differ significantly in structure and application. The Three Drive pattern is based on three consecutive and symmetrical price movements, validated by precise Fibonacci ratios (1.27 and 1.618), to define Potential Reversal Zones (PRZ).
In contrast, the Wedge pattern relies on converging trend lines and does not require Fibonacci ratios; it can act as either a reversal or continuation pattern. Meanwhile, the Three Push pattern shares similarities with Three Drive but lacks precise symmetry and Fibonacci-based validation.
Instead of a PRZ, Three Push focuses on identifying areas of support and resistance, often signaling weakening momentum in the current trend. Among these, the Three Drive pattern is more reliable for pinpointing high-probability reversal zones due to its strict Fibonacci-based and symmetrical structure.
🔵 Setting
🟣 Logical Setting
ZigZag Pivot Period : You can adjust the period so that the harmonic patterns are adjusted according to the pivot period you want. This factor is the most important parameter in pattern recognition.
Show Valid Format : If this parameter is on "On" mode, only patterns will be displayed that they have exact format and no noise can be seen in them. If "Off" is, the patterns displayed that maybe are noisy and do not exactly correspond to the original pattern.
Show Formation Last Pivot Confirm : if Turned on, you can see this ability of patterns when their last pivot is formed. If this feature is off, it will see the patterns as soon as they are formed. The advantage of this option being clear is less formation of fielded patterns, and it is accompanied by the latest pattern seeing and a sharp reduction in reward to risk.
Period of Formation Last Pivot : Using this parameter you can determine that the last pivot is based on Pivot period.
🟣 Genaral Setting
Show : Enter "On" to display the template and "Off" to not display the template.
Color : Enter the desired color to draw the pattern in this parameter.
LineWidth : You can enter the number 1 or numbers higher than one to adjust the thickness of the drawing lines. This number must be an integer and increases with increasing thickness.
LabelSize : You can adjust the size of the labels by using the "size.auto", "size.tiny", "size.smal", "size.normal", "size.large" or "size.huge" entries.
🟣 Alert Setting
Alert : On / Off
Message Frequency : This string parameter defines the announcement frequency. Choices include: "All" (activates the alert every time the function is called), "Once Per Bar" (activates the alert only on the first call within the bar), and "Once Per Bar Close" (the alert is activated only by a call at the last script execution of the real-time bar upon closing). The default setting is "Once per Bar".
Show Alert Time by Time Zone : The date, hour, and minute you receive in alert messages can be based on any time zone you choose. For example, if you want New York time, you should enter "UTC-4". This input is set to the time zone "UTC" by default.
🔵 Conclusion
The Three Drive pattern is a highly effective harmonic tool for identifying potential reversal points in the market. By leveraging its symmetrical structure and precise Fibonacci ratios (1.27 and 1.618), this pattern provides traders with clear entry and exit signals, enhancing the accuracy of their trades.
Whether in bullish or bearish scenarios, the identification of the Potential Reversal Zone (PRZ) serves as a critical aspect of this pattern, enabling traders to anticipate price movements with greater confidence.
Compared to similar patterns like Wedge and Three Push, the Three Drive pattern stands out for its stringent reliance on Fibonacci levels and symmetrical price movements, making it a more robust choice for forecasting reversals. However, as with any technical analysis tool, its effectiveness increases when combined with confirmation signals, such as candlestick patterns, volume analysis, and broader market context.
Mastering the Three Drive pattern requires practice and attention to detail, especially in accurately defining the PRZ and ensuring the pattern adheres to its criteria. Traders who consistently apply this pattern as part of a comprehensive trading strategy can capitalize on high-probability opportunities and improve their overall performance in the market.

VD Zig Zag with SMAIntroduction
The VD Zig Zag with SMA indicator is a powerful tool designed to streamline technical analysis by combining Zig Zag swing lines with a Simple Moving Average (SMA). It offers traders a clear and intuitive way to analyze price trends, market structure, and potential reversals, all within a customizable framework.
Definition
The Zig Zag indicator is a trend-following tool that highlights significant price movements by filtering out smaller fluctuations. It visually connects swing highs and lows to reveal the underlying market structure. When paired with an SMA, it provides an additional layer of trend confirmation, helping traders align their strategies with market momentum.
Calculations
Zig Zag Logic:
Swing highs and lows are determined using a user-defined length parameter.
The highest and lowest points within the specified range are identified using the ta.highest() and ta.lowest() functions.
Zig Zag lines dynamically connect these swing points to visually map price movements.
SMA Logic:
The SMA is calculated using the closing prices over a user-defined period.
It smooths out price action to provide a clearer view of the prevailing trend.
The indicator allows traders to adjust the Zig Zag length and SMA period to suit their preferred trading timeframe and strategy.
Takeaways
Enhanced Trend Analysis: The Zig Zag lines clearly define the market's structural highs and lows, helping traders identify trends and reversals.
Customizable Parameters: Both the swing length and SMA period can be tailored for short-term or long-term trading strategies.
Visual Clarity: By filtering out noise, the indicator simplifies chart analysis and enables better decision-making.
Multi-Timeframe Support: Adapts seamlessly to the chart's timeframe, ensuring usability across all trading horizons.
Limitations
Lagging Nature: As with any indicator, the Zig Zag and SMA components are reactive and may lag during sudden price movements.
Sensitivity to Parameters: Improper parameter settings can lead to overfitting, where the indicator reacts too sensitively or misses significant trends.
Does Not Predict: This indicator identifies trends and structure but does not provide forward-looking predictions.
Summary
The VD Zig Zag with SMA indicator is a versatile and easy-to-use tool that combines the strengths of Zig Zag swing analysis and moving average trends. It helps traders filter market noise, visualize structural patterns, and confirm trends with greater confidence. While it comes with limitations inherent to all technical tools, its customizable features and multi-timeframe adaptability make it an excellent addition to any trader’s toolkit.
Additional Features
Have an idea or a feature you'd like to see added?
Feel free to reach out or share your suggestions here—I’m always open to updates!

Gradient Filter with Fibonacci-AYNETExplanation of the Combined Features:
Dynamic Gradient Filter:
This section remains as in the previous example, calculating a smoothed filter (filt) with dynamic gradient coloring.
The color of the filter line transitions from red to green based on its RSI value.
Fibonacci Levels:
Calculates key Fibonacci retracement levels (0.0, 0.236, 0.382, 0.5, 0.618, and 1.0) over a user-defined lookback period (fib_length).
Uses the highest high and lowest low in the lookback period to determine the range.
Plotting Fibonacci Levels:
Each Fibonacci level is drawn as a horizontal line.
The lines extend back by the lookback period and are styled with dotted lines for clarity.
Features:
Customizable Inputs:
Users can enable or disable Fibonacci levels (show_fib_levels).
Adjust the color (fib_color) and width (fib_width) of Fibonacci lines.
Integrated Dynamic Filter:
Combines the filtered line with Fibonacci retracement levels to provide multi-dimensional insights.
Use Case:
Dynamic Filter:
Observe how the filtered line behaves near Fibonacci levels for potential trend continuations or reversals.
Fibonacci Levels:
Use retracement levels as key support/resistance zones to make trading decisions.
This combined script is now more functional, blending the dynamic gradient filter with Fibonacci retracement levels. Test this script in different market conditions, and let me know if additional features are required! 😊

Multi-LTF Fisher Transform -AYNETJohn F. Ehlers is a renowned figure in the field of financial markets and technical analysis. With a strong background in engineering and digital signal processing (DSP), Ehlers has applied his expertise to the development of innovative technical indicators and trading systems. His work focuses on using mathematical concepts, particularly those from signal processing, to analyze financial data. THANKS.
Simple Explanation of the Code
This Pine Script code calculates and plots Fisher Transform values for up to 6 different timeframes. The user can enable or disable each timeframe, and each Fisher Transform line is displayed in a unique color. Labels at the end of the lines indicate the timeframe.
Key Components of the Code
User Inputs:
Timeframes: The user specifies up to 6 different timeframes (ltf_1, ltf_2, etc.).
Enable/Disable Options: The user can choose which timeframes to enable using checkboxes (enable_1, enable_2, etc.).
Fisher Transform Length: The number of periods (fisher_length) used to calculate the Fisher Transform.
Fisher Transform Calculation:
For each enabled timeframe, the Fisher Transform is calculated using the fisher_transform_func() function:
Lowest Low and Highest High over the given period are fetched.
The Fisher Transform formula normalizes the price and transforms it into an oscillating value.
Dynamic Plotting:
Each Fisher Transform is plotted in a unique color if the corresponding timeframe is enabled.
Labels are added at the end of the lines to indicate the timeframe (e.g., "15m", "1H").
Visual Enhancements:
Unique colors for each line (green, blue, orange, etc.).
Labels dynamically display the timeframe names.
What the Code Does
Calculates Fisher Transform:
For example, for a 15m timeframe:
Finds the lowest low and highest high over the specified period.
Applies the Fisher Transform formula to normalize and smooth the values.
Plots Active Timeframes:
Only the enabled timeframes are plotted.
Each enabled Fisher Transform is plotted as a separate line.
Adds Labels:
At the end of each plotted line, a label indicates which timeframe it represents.
How It Looks
Each active timeframe is displayed as a colored oscillating line on the chart.
Labels like "15m" or "1H" appear at the end of the lines.
Inactive timeframes are not shown.
User Interaction
Input Parameters:
Select the desired timeframes (e.g., "15m", "1H", "4H").
Enable or disable specific timeframes.
Adjust the Fisher Transform period length.
Output:
View Fisher Transform lines for active timeframes.
Use labels to identify which line corresponds to which timeframe.
Why It’s Useful
Multi-Timeframe Analysis:
Helps compare momentum across different timeframes.
Customizable:
Users can enable only the timeframes they want.
Visual Clarity:
Unique colors and labels make it easy to distinguish between timeframes.
If you need further simplifications or more details, feel free to ask! 😊
5-Minute Buy/Sell SignalThe 5-Minute Buy/Sell Signal Indicator is designed to help short-term traders identify potential buy and sell opportunities on a 5-minute chart using a combination of multiple technical indicators. This indicator integrates the following key components to generate buy and sell signals:
MACD (Moving Average Convergence Divergence):
The MACD helps identify the strength and direction of the market trend by comparing the difference between short-term and long-term moving averages. A positive MACD histogram indicates bullish momentum, while a negative histogram indicates bearish momentum.
RSI (Relative Strength Index):
The RSI is a momentum oscillator that measures the speed and change of price movements. The indicator is used to determine overbought or oversold conditions:
Oversold (below 30): Potential buy signal.
Overbought (above 70): Potential sell signal.
EMA (Exponential Moving Average):
The 50-period EMA is used to determine the prevailing trend. When the price is above the EMA, it indicates a bullish trend; when it is below the EMA, it indicates a bearish trend.
Volume:
The indicator incorporates volume analysis to confirm the strength of signals. Signals are only considered valid when the current volume exceeds the average volume over the last 20 periods, ensuring that there is sufficient market participation to support the move.
Signal Generation:
Buy Signal:
The signal is generated when:
MACD histogram is positive (bullish momentum).
RSI is below the oversold level (indicating a potential reversal).
The price is above the 50-period EMA (indicating an uptrend).
Current volume is higher than the 20-period volume moving average (confirming the strength of the buy signal).
Sell Signal:
The signal is generated when:
MACD histogram is negative (bearish momentum).
RSI is above the overbought level (indicating a potential reversal).
The price is below the 50-period EMA (indicating a downtrend).
Current volume is higher than the 20-period volume moving average (confirming the strength of the sell signal).
Signal Display:
Buy Signal: A green "BUY" label appears below the bar when all buy conditions are met.
Sell Signal: A red "SELL" label appears above the bar when all sell conditions are met.
Usage:
This indicator is specifically designed for 5-minute charts, making it ideal for scalpers and day traders who need quick, reliable signals to trade in short timeframes. By combining multiple indicators—MACD, RSI, EMA, and Volume—the system ensures that the buy or sell signals are well-confirmed, reducing the likelihood of false signals and increasing the probability of successful trades.
Alert Conditions:
Alerts can be set up for both buy and sell signals, enabling traders to be notified when the conditions for a potential trade are met, ensuring they never miss a trading opportunity.
In summary, this indicator provides a comprehensive, multi-faceted approach to identifying buy and sell opportunities, helping traders make more informed decisions based on a detailed technical analysis.
ICT Setup 03 [TradingFinder] Judas Swing NY 9:30am + CHoCH/FVG🔵 Introduction
Judas Swing is an advanced trading setup designed to identify false price movements early in the trading day. This advanced trading strategy operates on the principle that major market players, or "smart money," drive price in a certain direction during the early hours to mislead smaller traders.
This deceptive movement attracts liquidity at specific levels, allowing larger players to execute primary trades in the opposite direction, ultimately causing the price to return to its true path.
The Judas Swing setup functions within two primary time frames, tailored separately for Forex and Stock markets. In the Forex market, the setup uses the 8:15 to 8:30 AM window to identify the high and low points, followed by the 8:30 to 8:45 AM frame to execute the Judas move and identify the CISD Level break, where Order Block and Fair Value Gap (FVG) zones are subsequently detected.
In the Stock market, these time frames shift to 9:15 to 9:30 AM for identifying highs and lows and 9:30 to 9:45 AM for executing the Judas move and CISD Level break.
Concepts such as Order Block and Fair Value Gap (FVG) are crucial in this setup. An Order Block represents a chart region with a high volume of buy or sell orders placed by major financial institutions, marking significant levels where price reacts.
Fair Value Gap (FVG) refers to areas where price has moved rapidly without balance between supply and demand, highlighting zones of potential price action and future liquidity.
Bullish Setup :
Bearish Setup :
🔵 How to Use
The Judas Swing setup enables traders to pinpoint entry and exit points by utilizing Order Block and FVG concepts, helping them align with liquidity-driven moves orchestrated by smart money. This setup applies two distinct time frames for Forex and Stocks to capture early deceptive movements, offering traders optimized entry or exit moments.
🟣 Bullish Setup
In the Bullish Judas Swing setup, the first step is to identify High and Low points within the initial time frame. These levels serve as key points where price may react, forming the basis for analyzing the setup and assisting traders in anticipating future market shifts.
In the second time frame, a critical stage of the bullish setup begins. During this phase, the price may create a false break or Fake Break below the low level, a deceptive move by major players to absorb liquidity. This false move often causes smaller traders to enter positions incorrectly. After this fake-out, the price reverses upward, breaking the CISD Level, a critical point in the market structure, signaling a potential bullish trend.
Upon breaking the CISD Level and reversing upward, the indicator identifies both the Order Block and Fair Value Gap (FVG). The Order Block is an area where major players typically place large buy orders, signaling potential price support. Meanwhile, the FVG marks a region of supply-demand imbalance, signaling areas where price might react.
Ultimately, after these key zones are identified, a trader may open a buy position if the price reaches one of these critical areas—Order Block or FVG—and reacts positively. Trading at these levels enhances the chance of success due to liquidity absorption and support from smart money, marking an opportune time for entering a long position.
🟣 Bearish Setup
In the Bearish Judas Swing setup, analysis begins with marking the High and Low levels in the initial time frame. These levels serve as key zones where price could react, helping to signal possible trend reversals. Identifying these levels is essential for locating significant bearish zones and positioning traders to capitalize on downward movements.
In the second time frame, the primary bearish setup unfolds. During this stage, price may exhibit a Fake Break above the high, causing a brief move upward and misleading smaller traders into incorrect positions. After this false move, the price typically returns downward, breaking the CISD Level—a crucial bearish trend indicator.
With the CISD Level broken and a bearish trend confirmed, the indicator identifies the Order Block and Fair Value Gap (FVG). The Bearish Order Block is a region where smart money places significant sell orders, prompting a negative price reaction. The FVG denotes an area of supply-demand imbalance, signifying potential selling pressure.
When the price reaches one of these critical areas—the Bearish Order Block or FVG—and reacts downward, a trader may initiate a sell position. Entering trades at these levels, due to increased selling pressure and liquidity absorption, offers traders an advantage in profiting from price declines.
🔵 Settings
Market : The indicator allows users to choose between Forex and Stocks, automatically adjusting the time frames for the "Opening Range" and "Trading Permit" accordingly: Forex: 8:15–8:30 AM for identifying High and Low points, and 8:30–8:45 AM for capturing the Judas move and CISD Level break. Stocks: 9:15–9:30 AM for identifying High and Low points, and 9:30–9:45 AM for executing the Judas move and CISD Level break.
Refine Order Block : Enables finer adjustments to Order Block levels for more accurate price responses.
Mitigation Level OB : Allows users to set specific reaction points within an Order Block, including: Proximal: Closest level to the current price. 50% OB: Midpoint of the Order Block. Distal: Farthest level from the current price.
FVG Filter : The Judas Swing indicator includes a filter for Fair Value Gap (FVG), allowing different filtering based on FVG width: FVG Filter Type: Can be set to "Very Aggressive," "Aggressive," "Defensive," or "Very Defensive." Higher defensiveness narrows the FVG width, focusing on narrower gaps.
Mitigation Level FVG : Like the Order Block, you can set price reaction levels for FVG with options such as Proximal, 50% OB, and Distal.
CISD : The Bar Back Check option enables traders to specify the number of past candles checked for identifying the CISD Level, enhancing CISD Level accuracy on the chart.
🔵 Conclusion
The Judas Swing indicator helps traders spot reliable trading opportunities by detecting false price movements and key levels such as Order Block and FVG. With a focus on early market movements, this tool allows traders to align with major market participants, selecting entry and exit points with greater precision, thereby reducing trading risks.
Its extensive customization options enable adjustments for various market types and trading conditions, giving traders the flexibility to optimize their strategies. Based on ICT techniques and liquidity analysis, this indicator can be highly effective for those seeking precision in their entry points.
Overall, Judas Swing empowers traders to capitalize on significant market movements by leveraging price volatility. Offering precise and dependable signals, this tool presents an excellent opportunity for enhancing trading accuracy and improving performance

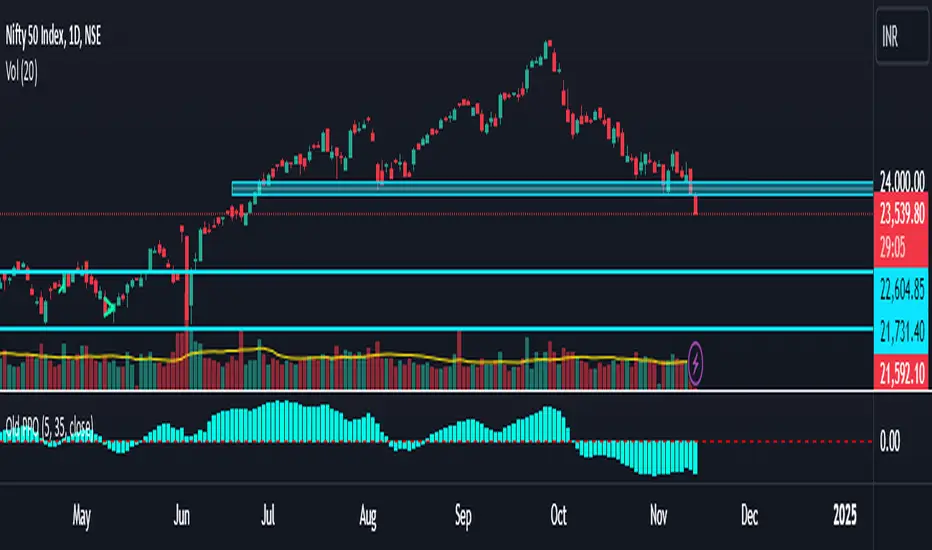
Old Price OscillatorThe Old Price Oscillator (OPO) is a momentum indicator widely used by traders and analysts to gauge the direction and strength of price trends. It works by calculating the difference between two moving averages—a shorter-term moving average and a longer-term moving average—of a security’s price. This difference is plotted as an oscillating line, helping traders visualize the momentum and determine when price reversals or continuations might occur. Typically, when the oscillator value is positive, the price is trending upwards, suggesting potential buy signals; conversely, when the oscillator turns negative, it indicates downward momentum, which could signal a potential sell.
The OPO is similar to other oscillators, like the Moving Average Convergence Divergence (MACD), in that it uses moving averages to smooth out price fluctuations and clarify trends. Traders often customize the length of the short- and long-term moving averages to better suit specific assets or market conditions. Generally, this indicator is especially useful in markets that exhibit clear trends. However, it may generate false signals during sideways or highly volatile periods, so many traders combine the OPO with other technical indicators or filters to improve accuracy.
Market Structure Algo V2 [OmegaTools]The Market Structure Algo V2 (MS Algo V2) is an advanced TradingView indicator developed by OmegaTools to provide traders with a comprehensive analysis of market structure. This tool refines the insights provided by its predecessor, combining enhanced pivot point analysis, dynamic market structure scoring, and zone visualization to deliver an intuitive view of potential market movements. Through custom settings, the MS Algo V2 allows users to tailor the indicator to fit their trading strategies more closely, offering enhanced adaptability to both short-term and long-term trends.
Core Functionality
The MS Algo V2 differentiates between internal and external market structures by analyzing pivot highs and lows over user-defined periods. The internal market structure focuses on shorter timeframes, providing insights into recent price action, while the external structure considers broader trends. This dual-layered approach helps traders distinguish between immediate and overarching market trends.
The indicator introduces improved visualization for areas of interest or zones around pivot points, adjustable through zone distance settings. These zones serve as potential support and resistance areas, helping traders anticipate price reactions at key levels. In addition to the zones, the indicator now provides gradient-based color coding on bars, reflecting the market structure’s bullish or bearish intensity. This visual enhancement aids in quickly interpreting the current trend's strength.
Dynamic signal generation has been refined in MS Algo V2. The indicator now offers both classic signals and breakout signals based on the market structure, including entries, exits, and change-of-character (CHoCH) alerts. Signals are generated based on price interactions with pivot levels, indicating potential long and short opportunities.
Operational Mechanism
The MS Algo V2 calculates pivot highs and lows over specified periods to define internal and external market structures. A market structure score is derived from these pivot points, classifying the market into bullish or bearish extremes. Signals are generated as the closing price interacts with these levels, marking entry and exit points based on the calculated structure.
A new feature in this version is zone visualization, where zones are plotted around a dynamic moving average derived from the exponential and simple moving averages (EMA and SMA). The zones are adjusted based on ATR (Average True Range) and the specified zone distance percentile, providing a clear visual representation of potential support and resistance regions. The external and internal zones are represented with different levels of transparency for quick reference.
Usage Guidelines
To apply the MS Algo V2 to your TradingView charts, adjust the internal and external market structure settings to match your preferred analysis timeframes. The line style and width of each structure can also be customized for a tailored view. The Zone Distance setting allows users to define the percentile range of the zones around the moving average, providing further flexibility in identifying potential areas of support and resistance.
For a color-coded overview of market sentiment, the bar gradient feature can be enabled. This option uses a gradient that reflects the bullish or bearish intensity of the market structure, giving traders a visual cue on the market’s overall trend. Color-coded signals and zone fill areas further assist in interpreting the current market structure and identifying potential trade areas.
The indicator includes customizable alerts for long and short signals, as well as specific breakout alerts (BOS) and change-of-character (CHoCH) signals. These alerts can help traders stay informed about significant market structure changes, supporting timely trading decisions.
Understanding the Indicator’s Originality
The MS Algo V2 stands out due to its robust integration of pivot analysis, zone visualization, and market structure scoring, offering a unique perspective on market dynamics. With features like color-coded signals, bar gradients, and configurable alerts, MS Algo V2 provides an edge in understanding both the current market environment and potential turning points. This indicator’s ability to represent the market’s structure visually makes it a powerful addition to any trader’s toolkit, especially for those seeking a deeper, multi-layered approach to market analysis.

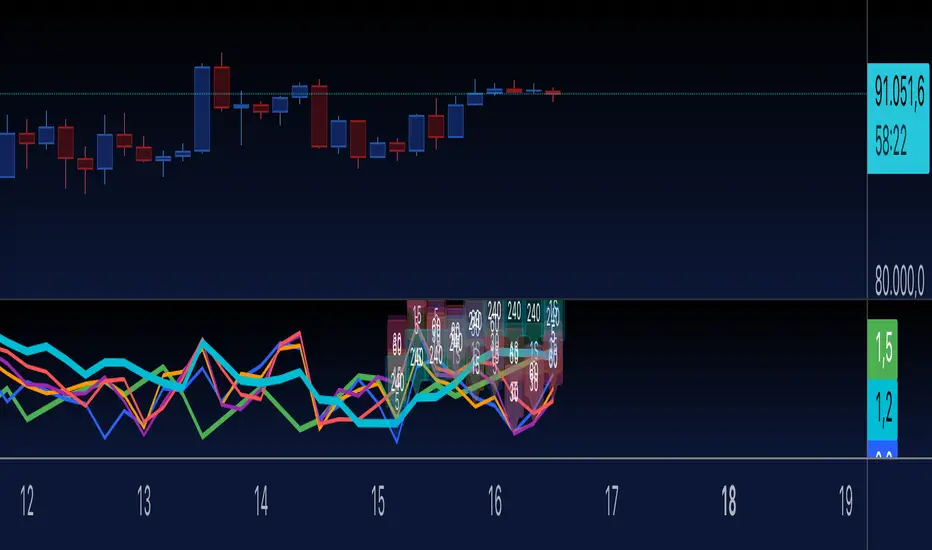
Sequence Waves [OmegaTools]the sequence waves indicator, developed by omegatools, is a multi-functional tool designed to detect trends, sequences, and potential reversal signals based on price movements and volume. this indicator has two main modes, "trend" and "sequence," which determine how the indicator calculates directional changes. additional enhancements in this version include reversal signals, allowing users to identify potential long and short opportunities with specific entry cues.
input parameters
mode (mode): chooses the calculation basis for directional movement.
- "trend": uses a midline calculated from the highest high and lowest low over the "trend mode length" period to assess if the price is in an upward or downward trend.
- "sequence": compares the current price to the closing price of the previous "sequence mode length" period to detect shifts in direction.
counter mode (modec): sets whether the counter increments by a fixed amount (1 or -1) or the volume of the bar, impacting the indicator’s sensitivity.
- "fixed": increments or decrements the counter by 1.
- "volume": increments or decrements based on the period’s volume, making the indicator more responsive to high-volume periods.
percentile length (lntp): defines the lookback period for calculating overbought and oversold thresholds using a percentile method. shorter lengths make ob/os levels more reactive.
sensitivity (sens): controls the percentile-based ob/os thresholds, ranging from 10 to 100. higher values narrow ob/os zones, while lower values widen them, impacting signal frequency.
trend mode length (lnt1): sets the period length for midline calculation in trend mode, defaulting to 21. longer periods smooth the midline for detecting major trends.
sequence mode length (lnt2): sets the lookback period in sequence mode, with a default of 4. shorter lengths capture more frequent directional changes, while longer lengths smooth signals.
visual colors:
- up color (upc): sets the color for upward movements.
- down color (dnc): sets the color for downward movements.
calculation logic
midline calculation: in trend mode, a midline is derived from the average of the highest high and lowest low over the "trend mode length" period, acting as a reference to detect upward or downward movements.
counter calculation:
- in trend mode, if the close price is above the midline, the counter increases (or volume if volume mode is selected). it decreases when the price is below.
- in sequence mode, the counter increases if the close is above the closing price from "sequence mode length" periods ago and decreases if below.
the counter resets to zero on direction changes, creating clear directional transitions.
overbought/oversold percentiles: separate arrays track the counter’s values each time the direction changes, creating historical up and down values. ob and os thresholds are dynamically determined based on these arrays, with sizes limited by the percentile length and sensitivity inputs.
reversal signals: two new variables, "long" and "short," detect potential reversal points when the counter crosses specific thresholds:
- long: a long signal is generated when the counter switches to positive and exceeds the down percentile.
- short: a short signal is triggered when the counter switches to negative and exceeds the up percentile.
visual and display elements
counter plot: plots the counter value on the chart with color-coded columns, making it easy to spot directional momentum.
up and down percentiles: displays overbought (up percentile) and oversold (down percentile) thresholds to identify potential reversal zones.
regime background: the background color changes based on market regime:
- bullish (up percentile > down percentile): greenish background.
- bearish (down percentile > up percentile): reddish background.
- neutral (both percentiles equal): grayish background.
reversal signals: plotted as small triangles on the chart for visual confirmation of potential long (triangle up) and short (triangle down) reversal signals.
obs background: changes color when the counter exceeds ob or os thresholds, creating a visual cue for extreme market conditions:
- overbought: background changes to a faint down color.
- oversold: background changes to a faint up color.
status table: displayed on the right side of the chart, providing real-time status information:
- status: shows "overbought," "oversold," "long," "short," or "none" based on the current counter position.
- regime: indicates whether the market is in a "bullish," "bearish," or "neutral" state based on the percentile comparison.
- percentile up/down: displays the current up and down percentiles for quick reference.
how to use the indicator
trend following: in trend mode, use the midline-based counter to gauge if the market is in an uptrend (positive counter) or downtrend (negative counter).
reversal detection: the ob/os thresholds assist in identifying potential reversal points. when the counter exceeds the up percentile, it may indicate an overbought state, suggesting a bearish reversal. similarly, dropping below the down percentile may indicate an oversold state, suggesting a bullish reversal.
entry signals: use the long and short reversal signals for potential entry points, particularly in trending or range-bound markets. these signals are indicated by up and down triangles.
sequence trading: in sequence mode, the indicator tracks shorter-term directional shifts, making it suitable for detecting smaller momentum patterns based on recent price comparisons.
volume sensitivity: selecting volume mode enhances sensitivity to high-volume moves, allowing it to detect stronger market activity in both trend and sequence modes.
the sequence waves indicator is suited to both short-term and long-term traders. it allows for detailed trend analysis, reversal detection, and dynamic ob/os signals. the inclusion of visual reversal cues makes it a flexible tool adaptable to a variety of trading strategies.

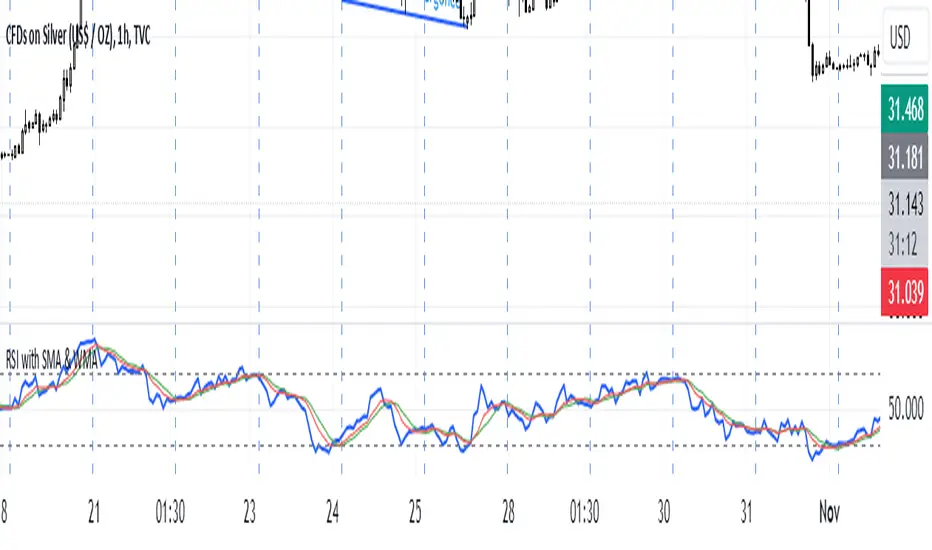
M.Kiriti RSI with SMA & WMAThis script is a custom RSI indicator with added SMA and WMA moving averages to smooth RSI trends and improve analysis of momentum shifts.
1. RSI Calculation: Measures 14-period RSI of the closing price, default threshold levels at 70 (overbought) and 30 (oversold).
2. Moving Averages (SMA and WMA):
- SMA and WMA are applied to RSI for trend smoothing.
- SMA gives equal weight; WMA gives more weight to recent values, making it more responsive.
3.Overbought/Oversold Lines and Labels:
- Horizontal lines and scale labels at 70 (overbought) and 30 (oversold) make these levels easy to reference.
This indicator is useful for identifying potential reversal points and momentum trends when RSI crosses its moving averages.
DeNoised Momentum [OmegaTools]The DeNoised Momentum by OmegaTools is a versatile tool designed to help traders evaluate momentum, acceleration, and noise-reduction levels in price movements. Using advanced mathematical smoothing techniques, this script provides a "de-noised" view of momentum by applying filters to reduce market noise. This helps traders gain insights into the strength and direction of price trends without the distractions of market volatility. Key components include a DeNoised Moving Average (MA), a Momentum line, and Acceleration bars to identify trend shifts more clearly.
Features:
- Momentum Line: Measures the percentage change of the de-noised source price over a specified look-back period, providing insights into trend direction.
- Acceleration (Ret) Bars: Visualizes the rate of change of the source price, helping traders identify momentum shifts.
- Normal and DeNoised Moving Averages: Two moving averages, one based on close price (Normal MA) and the other on de-noised data (DeNoised MA), enable a comparison of smoothed trends versus typical price movements.
- DeNoised Price Data Plot: Displays the current de-noised price, color-coded to indicate the relationship between the Normal and DeNoised MAs, which highlights bullish or bearish conditions.
Script Inputs:
- Length (lnt): Sets the period for calculations (default: 21). It influences the sensitivity of the momentum and moving averages. Higher values will smooth the indicator further, while lower values increase sensitivity to price changes.
The Length does not change the formula of the DeNoised Price Data, it only affects the indicators calculated on it.
Indicator Components:
1. Momentum (Blue/Red Line):
- Calculated using the log of the percentage change over the specified period.
- Blue color indicates positive momentum; red indicates negative momentum.
2. Acceleration (Gray Columns):
- Measures the short-term rate of change in momentum, shown as semi-transparent gray columns.
3. Moving Averages:
- Normal MA (Purple): A standard simple moving average (SMA) based on the close price over the selected period.
- DeNoised MA (Gray): An SMA of the de-noised source, reducing the effect of market noise.
4. DeNoised Price Data:
- Represented as colored circles, with blue indicating that the Normal MA is above the DeNoised MA (bullish) and red indicating the opposite (bearish).
Usage Guide:
1. Trend Identification:
- Use the Momentum line to assess overall trend direction. Positive values indicate upward momentum, while negative values signal downward momentum.
- Compare the Normal and DeNoised MAs: when the Normal MA is above the DeNoised MA, it indicates a bullish trend, and vice versa for bearish trends.
2. Entry and Exit Signals:
- A change in the Momentum line's color from blue to red (or vice versa) may indicate potential entry or exit points.
- Observe the DeNoised Price Data circles for early signs of a trend reversal based on the interaction between the Normal and DeNoised MAs.
3. Volatility and Noise Reduction:
- By utilizing the DeNoised MA and de-noised price data, this indicator helps filter out minor fluctuations and focus on larger price movements, improving decision-making in volatile markets.

Polygonal Pivot Bands [FXSMARTLAB]The Polygonal Pivot Bands highlights key price pivots, dynamic support and resistance levels, and recent price action on a trading chart. This indicator connects pivot highs and lows with a zigzag line, extends a real-time dashed line to the latest price point, and plots diagonal support/resistance levels that adapt to price movement. These elements together provide traders with a view of significant price zones and potential trend shifts.
Key Components of the Indicator
Pivots are calculated based on user-defined lengths, specifying how many bars on either side of a high or low are required to validate it as a pivot.
Adjustable left and right pivot lengths allow traders to control the sensitivity of pivot detection, with higher values resulting in fewer, more prominent pivots, and lower values increasing sensitivity to price changes.
Zigzag Line
The zigzag line connects consecutive pivot points, filtering out smaller fluctuations and emphasizing the broader direction of price movement.
Users can customize the line's color and thickness to match their preferences, helping them focus on larger trends and potential reversal points.
By linking pivot highs and lows, the zigzag pattern highlights the overall trend and potential points of reversal.
Real-Time Connector Line
A dashed line extends from the last confirmed pivot to the latest price point, providing a real-time, bar-by-bar update of the current price relative to the previous pivot.
This line does not project future price direction but maintains an up-to-date connection with the current price, showing the distance from the last pivot.
Its color and thickness are customizable for improved visibility on the chart.
Dynamic Support and Resistance Levels
The indicator plots dynamic support and resistanc e levels by connecting recent pivot highs and lows, resulting in lines that may appear diagonal rather than strictly horizontal.
These levels move in line with price action, adapting to the natural direction of trends, and offer visual cues where price may encounter support or resistance.
Colors and thickness of these lines can be set individually, allowing traders to adjust visibility according to their preferences.
Enabling these lines gives traders an ongoing reference for critical price boundaries that align more closely with the overall trend.

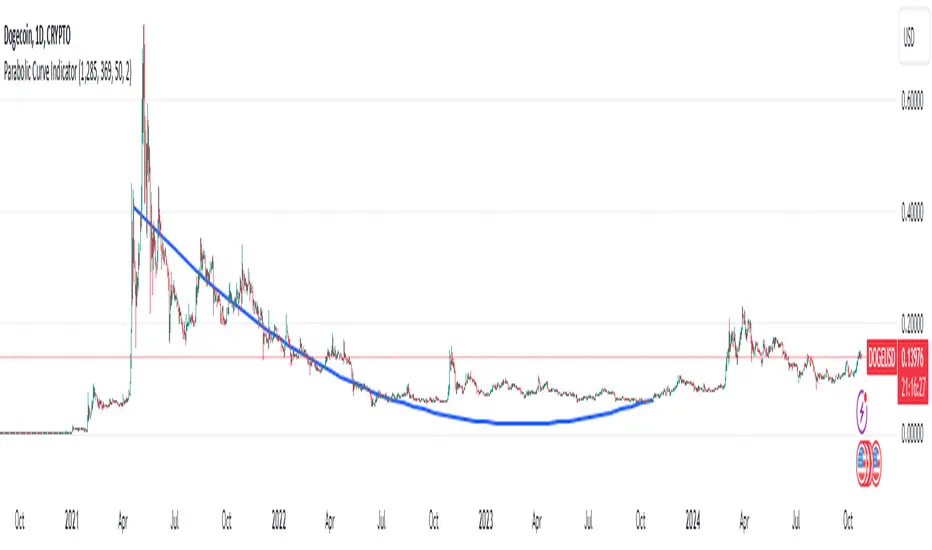
Parabolic (Brachistochrone) Curve IndicatorOverview of the Script
The script is designed to plot an approximation of the Brachistochrone curve between two points on a TradingView chart. The Brachistochrone curve represents the path of fastest descent under gravity between two points not aligned vertically. In physics, this curve is a segment of a cycloid.
Understanding the Brachistochrone Curve
Definition: The Brachistochrone curve is the curve along which a particle will descend from one point to another in the least time under gravity, without friction.
Mathematical Representation: The solution to the Brachistochrone problem is a cycloid, which is the curve traced by a point on the rim of a circular wheel as it rolls along a straight line.
Relevance to Trading: While the Brachistochrone curve originates from physics, plotting it on a price-time chart can offer a unique visual representation of the fastest possible movement between two price levels.
How the Script Works
Inputs
Start and End Bars:
startBar: The number of bars back from the current bar to define the starting point.
endBar: The number of bars back from the current bar to define the ending point.
Curve Customization:
numPoints: The number of points used to plot the curve (affects smoothness).
curveColor: The color of the curve.
curveWidth: The width of the curve lines.
Labels:
showTimeLabels: A toggle to display labels along the curve for reference.
Calculations
Determine Start and End Points:
The script calculates the coordinates (x_start, y_start, x_end, y_end) of the start and end points based on the specified bar offsets.
x_start and x_end correspond to bar indices (time).
y_start and y_end correspond to price levels.
Calculate Differences and Parameters:
Horizontal and Vertical Differences:
delta_x = x_end - x_start
delta_y = y_end - y_start
Ensure Descending Motion:
If the end point is higher than the start point (i.e., delta_y is positive), the script swaps the start and end points to ensure the curve represents a descent.
Cycloid Parameters:
Angle (theta): Calculated using theta = atan(delta_y / delta_x), representing the inclination of the curve.
Radius (R): The radius of the generating circle for the cycloid, calculated with R = delta_x / (π * cos(theta)).
Generate Points Along the Cycloid:
Parameter t: Varies from 0 to t_end, where t_end is set to π to represent half a cycloid (a common segment for the Brachistochrone).
Cycloid Equations:
Horizontal Component (x_t): x_t = R * (t - sin(t))
Vertical Component (y_t): y_t = R * (1 - cos(t))
Adjust Coordinates:
The script adjusts the cycloid coordinates to align with the chart's axes:
x_plot = x_start + x_t * cos(theta)
y_plot = y_start + y_t * sin(theta)
The x_plot values are converted to integer bar indices to match the chart's x-axis.
Plotting the Curve
Drawing Lines:
The script connects consecutive points using lines to form the curve.
It uses the line.new function, specifying the start and end coordinates of each line segment.
Adding Labels (Optional):
If showTimeLabels is enabled, the script places labels at intervals along the curve to indicate progress or parameter values.
Adjustments for Accurate Visualization
Handling Ascending Paths:
To adhere to the physical definition of the Brachistochrone curve, the script ensures that the ending point is below the starting point in terms of price.
If not, it swaps the points to represent a descending path.
Parameter Constraints:
The script ensures that calculations involving trigonometric functions remain within valid ranges to prevent mathematical errors (e.g., division by zero or invalid arguments for acos).
Scaling Considerations:
Adjustments are made to account for the differences in scaling between time (x-axis) and price (y-axis) on the chart.
The script maps spatial coordinates to the chart's axes appropriately.
Limitations and Considerations
Theoretical Nature:
The Brachistochrone curve is a theoretical concept from physics and doesn't necessarily predict actual price movements in financial markets.
Chart Scaling:
The visual appearance of the curve may be affected by the chart's scaling settings. Users may need to adjust the chart's zoom or scale to view the curve properly.
Data Range:
The start and end bars must be within the range of available data on the chart. If the specified bars are out of range, the script may not plot the curve.
Computational Limits:
TradingView imposes limits on the number of drawing objects (lines, labels) that can be displayed. The script accounts for this, but extremely high numPoints values may lead to performance issues.
Usage Instructions
Adding the Indicator:
The script is added to the chart as a custom indicator in TradingView's Pine Script Editor.
Configuring Inputs:
Start and End Bars: Users specify the bar offsets for the start and end points. It's important that the end point is below the start point in price to represent a descent.
Curve Customization: Users can adjust the number of points for smoothness and customize the curve's color and width.
Labels: Users can choose to display or hide labels along the curve.
Observing the Curve:
After configuring the inputs, the curve will be plotted between the two specified points.
Users can observe the curve to understand the theoretical fastest descent between the two price levels.
Potential Applications
Educational Tool:
The script serves as a visual aid to understand the properties of the Brachistochrone curve and cycloid.
Analytical Insights:
While not predictive, the curve might inspire new ways of thinking about price movements, momentum, or acceleration in markets.
Visualization:
It provides a unique way to visualize the relationship between time and price over a specific interval.
Conclusion
The script effectively adapts the mathematical concept of the Brachistochrone curve to a financial chart by carefully mapping spatial coordinates to time and price axes. By accounting for the unique characteristics of TradingView charts and implementing necessary mathematical adjustments, the script plots the curve between two user-defined points, offering a novel and educational visualization.
Wave Anchor IndicatorThe Wave Anchor Indicator is designed to mark the crossing of overbought and oversold levels of higher time frame momentum waves, based on the VuManChu Cipher B+Divergences Wave Trend Indicator. This tool is inspired by the TP Mint trading strategy, which relies heavily on the momentum waves of Market Cipher B or VuManChu Cipher B for identifying optimal entry and exit points.
Key Concept: Anchored Waves
In the TP Mint strategy, momentum waves in overbought (above 60) or oversold (below -60) conditions on higher time frames are considered "anchored." These anchored waves provide strong signals for entries and take-profit points when viewed on lower time frames. The Wave Anchor Indicator focuses on these anchor conditions to help traders make informed decisions by seeing higher time frame anchor states directly on the entry time frame chart.
How It Works
Labeling Signals:
- On lower time frames, such as the 15-minute chart, the indicator shows labels when higher
time frame momentum waves (1-hour and 4-hour) cross the overbought or oversold levels.
- Labels above price indicate overbought conditions, with green labels when the wave crosses
upward and red labels when crossing downward.
- Labels below price signal oversold conditions, with red for a downward cross and green for an
upward cross.
- Each label displays the time frame of the crossing momentum wave, providing context for
traders at a glance.
Time Frame Pairings:
- On the 15-minute time frame, the indicator tracks anchor conditions from the 1-hour and 4-
hour time frames.
- On the 1-hour chart, it monitors 4-hour and daily time frame anchor conditions.
Customization and Alerts
Flexible Display Options : Users can choose to display none, one, or both of the grouped higher time frame labels, depending on their strategy and preferences.
Alerts : The indicator also allows for custom alerts when a label appears, helping traders stay on top of key market movements without constantly monitoring the chart.
Use Cases
This indicator is ideal for traders who use momentum-based strategies across multiple time frames. It simplifies the process of identifying key entry and exit points by focusing on the anchor conditions from higher time frames, making it easier to execute the TP Mint strategy or similar methods.
Thank you to VuManChu and LazyBear for mamking the momentum wave code open source and allowing it’s use in this indicator.
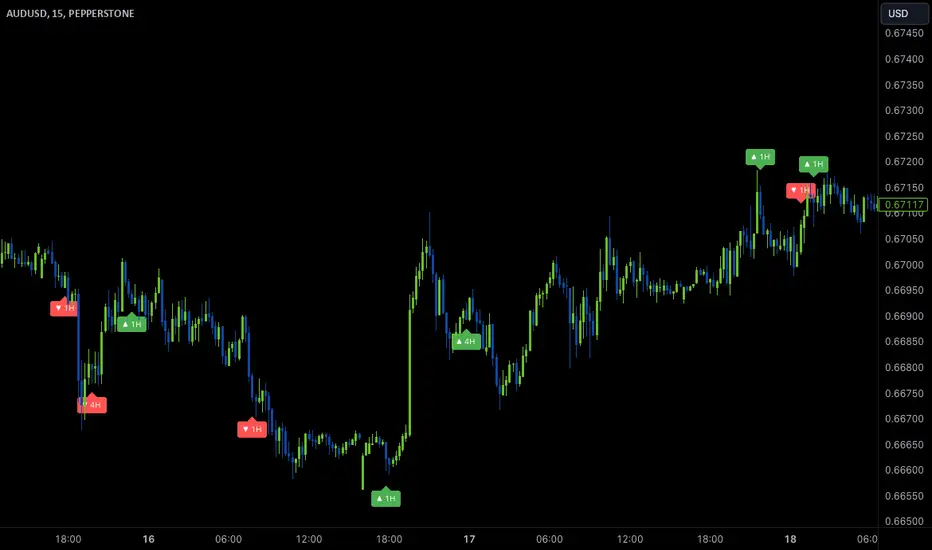
Ultimate Fibonacci Trading Tool [CHE]Ultimate Fibonacci Trading Tool – Your Key to More Precise Trading Decisions!
Description:
Discover the Ultimate Fibonacci Trading Tool , a powerful instrument designed to revolutionize your technical analysis. This tool is crafted to assist traders of all experience levels in better understanding market movements and making informed decisions. By utilizing a higher reference period from the past, it provides you with a clear advantage in identifying critical support and resistance levels.
🌟 Key Features in Detail:
1. Automatic Timeframe Selection:
- Auto Timeframe: The tool automatically detects the optimal higher reference period based on your current chart, providing more precise analysis without additional effort.
- Multiplier Mode: Define the higher timeframe using a multiplier. By default set to 5, this can be adjusted to suit your individual needs.
- Manual Selection: For maximum control, you can manually select the desired timeframe.
2. Customizable Fibonacci Levels:
- Enable/Disable Levels: Toggle specific Fibonacci levels (e.g., 0.236, 0.382, 0.5, 0.618, etc.) on or off to personalize your analysis.
- User-Defined Values: Input custom numerical values for each level to support specialized Fibonacci calculations.
- Color Customization: Choose individual colors for each level to keep your charts clear and visually appealing.
3. Automatic Trend Detection:
- The tool automatically identifies whether the market is in a bullish or bearish trend and adjusts the Fibonacci calculations accordingly, ensuring you always have the most relevant information at hand.
4. Period Separators with Start and Stop Labels:
- Customizable Separator Lines: Visualize the beginning of new time periods with lines that you can customize in style, color, and width.
- Start/Stop Labels: Clear markers help you instantly recognize critical time points and potential trend changes.
5. Flexible Label Management:
- Display Styles: Decide how Fibonacci levels are presented—percentage, price level, or both—so you get the information most important to you.
- Size Adjustment: Modify the size of the labels to optimize readability on your chart.
- Positioning: Place labels where they make the most sense for your analysis.
6. Informative Time Period Display:
- Customizable Info Box: Keep track of the reference period used with a customizable information box displayed directly on your chart.
- Layout Options: Determine the size, position, background, and text colors for seamless integration into your chart environment.
🔧 Detailed Settings Options:
- Timeframe Selection:
- Timeframe Type: Choose between "Auto Timeframe," "Multiplier," or "Manual" to control how the reference period is calculated.
- Multiplier: Set the multiplier when using the "Multiplier" mode; this value determines how many units of the current timeframe are used as the reference.
- Manual Resolution: If "Manual" is selected, you can input the exact timeframe (e.g., "60," "1D," "1W").
- Fibonacci Level Settings:
- Enabling Individual Levels: Toggle each Fibonacci level on or off according to your preference.
- Adjusting Level Values: Enter custom numerical values for each level to perform specialized calculations.
- Color Selection: Choose a unique color for each level to ensure clear differentiation.
- Period Separator Settings:
- Separator Color: Define the color of the separator lines to make them distinctly visible.
- Separator Style: Choose between "Solid," "Dashed," or "Dotted" to adjust the style of the separator lines.
- Separator Width: Set the width of the separator lines to match your chart aesthetics.
- Label Management:
- Label Style: Select how labels are displayed:
- Default: Shows both percentage and price.
- None: No labels are displayed.
- Percentage: Shows only the Fibonacci level percentage.
- Price: Shows only the price at the Fibonacci level.
- Label Size: Adjust the size of the labels (tiny, small, normal, large, huge) for optimal readability.
- Time Period Display:
- Show Time Period: Enable or disable the information box displaying the reference period.
- Size: Choose the size of the information box (tiny, small, normal, large, huge, auto).
- Positioning: Set the vertical (top, middle, bottom) and horizontal (left, center, right) position of the box.
- Color Customization: Select the background and text color of the information box to integrate it into your chart design.
📈 Why Is the Higher Reference Period Important?
The Ultimate Fibonacci Trading Tool leverages a higher reference period from the past to calculate Fibonacci levels. This approach offers several advantages:
- Deeper Market Analysis: By considering longer timeframes, you can uncover major market movements and trends that might be hidden in shorter periods.
- More Accurate Support and Resistance Levels: Higher timeframes provide more robust Fibonacci levels that are observed by many market participants.
- Better Decision-Making Foundation: With a comprehensive view of the market, you can make more informed trading decisions and minimize potential risks.
🎯 How This Tool Enhances Your Trading Strategy:
- Increased Efficiency: Automate complex calculations and save valuable time.
- Personalized Analysis: Adapt the tool to your individual needs and strategies.
- Enhanced Precision: Utilize precise Fibonacci levels to better determine entry and exit points.
- Improved Market Insight: Gain deeper understanding of market trends and structures by using higher timeframes.
🚀 Get Started Now!
Don't miss the opportunity to revolutionize your chart analysis. Integrate the Ultimate Fibonacci Trading Tool into your trading routine and benefit from more precise analyses and improved trading decisions.
Disclaimer
The content provided, including all code and materials, is strictly for educational and informational purposes only. It is not intended as, and should not be interpreted as, financial advice, a recommendation to buy or sell any financial instrument, or an offer of any financial product or service. All strategies, tools, and examples discussed are provided for illustrative purposes to demonstrate coding techniques and the functionality of Pine Script within a trading context.
Any results from strategies or tools provided are hypothetical, and past performance is not indicative of future results. Trading and investing involve high risk, including the potential loss of principal, and may not be suitable for all individuals. Before making any trading decisions, please consult with a qualified financial professional to understand the risks involved.
By using this script, you acknowledge and agree that any trading decisions are made solely at your discretion and risk.
Best regards
Chervolino