Cypher Harmonic Pattern [TradingFinder] Cypher Pattern Detector🔵 Introduction
The Cypher Pattern is one of the most accurate and advanced harmonic patterns, introduced by Darren Oglesbee. The Cypher pattern, utilizing Fibonacci ratios and geometric price analysis, helps traders identify price reversal points with high precision. This pattern consists of five key points (X, A, B, C, and D), each playing an important role in determining entry and exit points in the financial markets.
The reversal point typically occurs in the XD region, with the Fibonacci ratio ranging between 0.768 and 0.886. This zone is referred to as the Potential Reversal Zone (PRZ), where traders anticipate price changes to occur.
The Cypher harmonic pattern is popular among professional traders due to its high accuracy in identifying market trends and reversal points. The pattern appears in two forms: bullish Cypher pattern and bearish Cypher pattern.
In the bullish Cypher pattern, after a price correction, the price moves upward, while in the bearish Cypher pattern, the price moves downward after a temporary increase. These patterns help traders use technical analysis to identify strong reversal points in the PRZ and execute more optimal trades.
Bullish Cypher Pattern :
Bearish Cypher Pattern :
🔵 How to Use
The Cypher pattern is one of the most complex and precise harmonic patterns, leveraging Fibonacci ratios to help traders identify price reversals. This pattern is comprised of five key points, each playing a critical role in determining entry and exit points.
The Cypher pattern appears in two main types :
Bullish Cypher pattern : This pattern appears as an M shape on the chart and indicates a trend reversal to the upside after a price correction. Traders can prepare for buying after identifying this pattern in technical analysis.
Bearish Cypher pattern : This pattern appears as a W shape and signals the start of a downtrend after a temporary price increase. Traders can use this pattern to enter short positions.
🟣 How to Identify the Cypher Pattern on a Chart
Identifying the Cypher pattern requires precision and the use of advanced technical analysis tools. The pattern consists of four main legs, each identified using Fibonacci ratios and geometric analysis.
To spot the Cypher pattern on a chart, first, identify the five key points : X, A, B, C, and D.
XA leg : The initial move from point X to A.
AB leg : The first correction after the XA move, where the price moves to point B.
BC leg : After the correction, the price moves upwards to point C.
CD leg : The final price move that reaches point D, where a price reversal is expected.
In a bullish Cypher pattern, point D indicates the start of a new uptrend, while in a bearish Cypher pattern, point D signals the beginning of a downtrend. Correctly identifying these points helps traders determine the best time to enter a trade.
🟣 How to Trade Using the Cypher Pattern
Once the Cypher pattern is identified on the chart, traders can use it to set entry and exit points. Point D is the key point for trade entry. In the bullish Cypher pattern, the trader can enter a long position after point D forms, while in the bearish Cypher pattern, point D serves as the ideal point for entering a short position.
🟣 Entering a Buy Trade with the Bullish Cypher Pattern
In a bullish Cypher pattern, traders wait for the price to reach point D, after which they can enter a buy position. At this point, the price is expected to start rising.
🟣 Entering a Sell Trade with the Bearish Cypher Pattern
In a bearish Cypher pattern, the trader enters a sell position at point D, expecting the price to move downward after reaching this point. For additional confirmation, traders can use technical indicators such as RSI or MACD.
🟣 Risk Management in Cypher Pattern Trades
Risk management is one of the most critical aspects of any trade, and this holds true for trading the Cypher pattern. Traders should always use stop-loss orders to prevent larger losses in case the pattern fails.
In the bullish Cypher pattern, the stop-loss is usually placed slightly below point D to exit the trade if the price continues to drop.
In the bearish Cypher pattern, the stop-loss is placed above point D to limit losses if the price rises unexpectedly.
🟣 Combining the Cypher Pattern with Other Technical Tools
The Cypher pattern is a powerful tool in technical analysis, but combining it with other methods such as price action and technical indicators can improve trading accuracy.
🟣 Combining with Price Action
Traders can use price action to confirm the Cypher pattern. Candlestick patterns like reversal candlesticks can provide additional confirmation for price reversals at point D.
🟣 Using Technical Indicators
Incorporating technical indicators such as RSI and MACD can also help traders receive stronger signals for entering trades based on the Cypher pattern. These indicators help identify overbought or oversold conditions, allowing traders to make more informed decisions.
🟣 Advantages and Disadvantages of the Cypher Pattern in Technical Analysis
Advantages :
High accuracy : The Cypher pattern, using Fibonacci ratios and geometric analysis, provides high precision in identifying reversal points.
Applicable in various markets : This pattern can be used in a wide range of financial markets, including forex, stocks, and cryptocurrencies.
Disadvantages :
Rarit y: The Cypher pattern appears less frequently on charts compared to other harmonic patterns.
Complexity : Accurately identifying this pattern requires significant experience, which may be challenging for novice traders.
🔵 Setting
🟣 Logical Setting
ZigZag Pivot Period : You can adjust the period so that the harmonic patterns are adjusted according to the pivot period you want. This factor is the most important parameter in pattern recognition.
Show Valid Forma t: If this parameter is on "On" mode, only patterns will be displayed that they have exact format and no noise can be seen in them. If "Off" is, the patterns displayed that maybe are noisy and do not exactly correspond to the original pattern.
Show Formation Last Pivot Confirm : if Turned on, you can see this ability of patterns when their last pivot is formed. If this feature is off, it will see the patterns as soon as they are formed. The advantage of this option being clear is less formation of fielded patterns, and it is accompanied by the latest pattern seeing and a sharp reduction in reward to risk.
Period of Formation Last Pivot : Using this parameter you can determine that the last pivot is based on Pivot period.
🟣 Genaral Setting
Show : Enter "On" to display the template and "Off" to not display the template.
Color : Enter the desired color to draw the pattern in this parameter.
LineWidth : You can enter the number 1 or numbers higher than one to adjust the thickness of the drawing lines. This number must be an integer and increases with increasing thickness.
LabelSize : You can adjust the size of the labels by using the "size.auto", "size.tiny", "size.smal", "size.normal", "size.large" or "size.huge" entries.
🟣 Alert Setting
Alert : On / Off
Message Frequency : This string parameter defines the announcement frequency. Choices include: "All" (activates the alert every time the function is called), "Once Per Bar" (activates the alert only on the first call within the bar), and "Once Per Bar Close" (the alert is activated only by a call at the last script execution of the real-time bar upon closing). The default setting is "Once per Bar".
Show Alert Time by Time Zone : The date, hour, and minute you receive in alert messages can be based on any time zone you choose. For example, if you want New York time, you should enter "UTC-4". This input is set to the time zone "UTC" by default.
🔵 Conclusion
The Cypher harmonic pattern is one of the most powerful and accurate patterns used in technical analysis. Its high precision in identifying price reversal points, particularly within the Potential Reversal Zone (PRZ), has made it a popular tool among professional traders. The PRZ, located between the Fibonacci ratios of 0.768 and 0.886 in the XD region, offers traders a clear indication of where price reversals are likely to occur.
However, to use this pattern successfully, traders must employ proper risk management and combine it with supplementary tools like technical indicators and price action. By understanding how to utilize the PRZ, traders can enhance the accuracy of their trade entries and exits.
Ultimately, the Cypher pattern, when used in conjunction with the PRZ, helps traders make more precise decisions in the financial markets, leading to more successful and well-informed trades.
การวิเคราะห์คลื่น

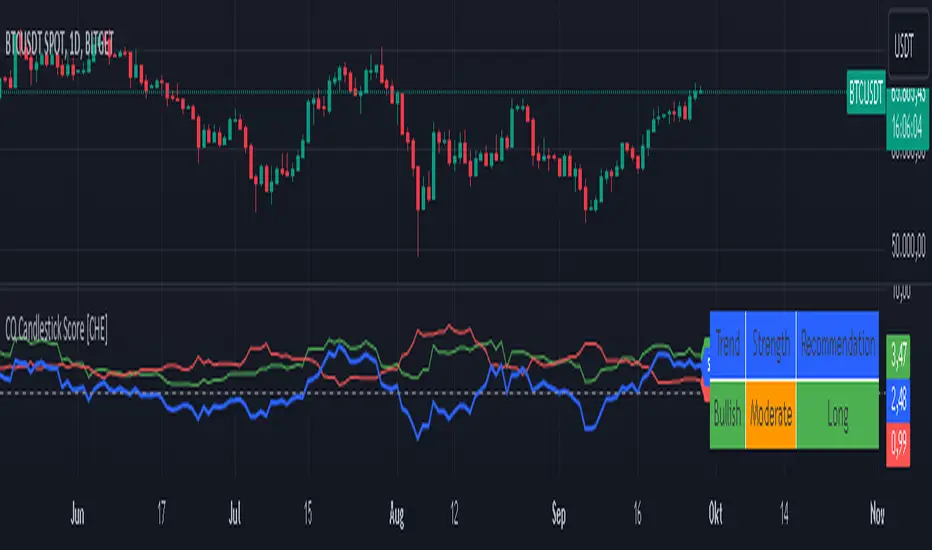
Qualitative and Quantitative Candlestick Score [CHE] Qualitative and Quantitative Candlestick Score
Overview
The Qualitative and Quantitative Candlestick Score is a powerful indicator for TradingView that combines both qualitative and quantitative analyses of candlestick patterns. This indicator provides traders with a comprehensive assessment of market conditions to make informed trading decisions.
Key Features
- Quantitative Analysis: Calculates a quantitative score based on the price movement of each candle.
- Qualitative Analysis: Evaluates candles based on body size, wick size, trend, and trading volume.
- Cumulative Scores: Displays cumulative green (bullish) and red (bearish) scores over a defined period.
- Trend Analysis: Identifies trend direction, strength, and provides trading recommendations (Long/Short).
- Customizable Settings: Adjust parameters for time periods, thresholds, and volume analysis.
Settings and Customizations
1. Time Period Settings:
- Period: Number of periods to calculate moving averages and cumulative scores (Default: 14).
2. Qualitative Evaluation:
- Body Size Threshold (%): Minimum size of the candle body to be considered significant (Default: 0.5%).
- Wick Size Threshold (%): Maximum size of the wicks to be considered minimal (Default: 0.3%).
3. Volume Settings:
- Include Volume in Evaluation: Whether to include trading volume in the qualitative score (Default: Enabled).
- Volume MA Period: Number of periods to calculate the moving average of volume (Default: 14).
4. Trend Settings:
- Moving Average Length: Number of periods for the Simple Moving Average used to determine the trend (Default: 50).
Calculations and Visualizations
- Quantitative Score: Difference between the closing and opening price, normalized to the opening price.
- Qualitative Score: Evaluation based on body size, wick size, trend, and volume.
- Cumulative Scores: Average of green and red scores over the defined period.
- Score Difference: Difference between cumulative green and red scores to determine trend direction.
- Trend Analysis Table: Displays trend direction, trend strength, and trading recommendation in an easy-to-read table.
Plotting and Display
- Cumulative Scores: Displays cumulative green and red scores in green and red colors.
- Score Difference: Blue line chart to visualize the difference between green and red scores.
- Zero Line: Horizontal gray line as a reference point.
- Trend Analysis Table: Table in the top right of the chart showing current trend direction, strength, and trading recommendation.
Use Cases
- Trend Identification: Use the score difference and trend analysis table to quickly assess the current market sentiment.
- Trading Recommendations: Based on the table, decide whether a long or short entry is appropriate.
- Volume Analysis: Including volume helps to better understand the strength of a trend.
Benefits
- Comprehensive Analysis: Combines quantitative and qualitative methods for a deeper market analysis.
- User-Friendly: Easy parameter adjustments allow for personalized use.
- Visually Appealing: Clear charts and tables facilitate data interpretation.
- Flexible: Adaptable to various trading strategies and timeframes.
Installation and Usage
1. Installation:
- Copy the provided Pine Script code.
- Go to TradingView and open the Pine Script Editor.
- Paste the code and save the script.
- Add the indicator to your chart.
2. Customization:
- Adjust the parameters according to your trading preferences.
- Monitor the cumulative scores and the trend analysis table for trading decisions.
Conclusion
The Qualitative and Quantitative Candlestick Score offers a comprehensive analysis of market conditions by combining quantitative and qualitative evaluation methods. With its user-friendly settings and clear visualizations, this indicator is a valuable tool for traders seeking informed and precise trading decisions.
Best regards and happy trading
Chervolino
Developed by: Chervolino
Version: 1.0
License: Free to use and customize on TradingView.
For any questions or feedback, feel free to contact me through the TradingView community.
Note: This indicator is a tool to assist with trading decisions and does not replace professional financial advice. Use it responsibly and thoroughly test it before incorporating it into your trading strategies.
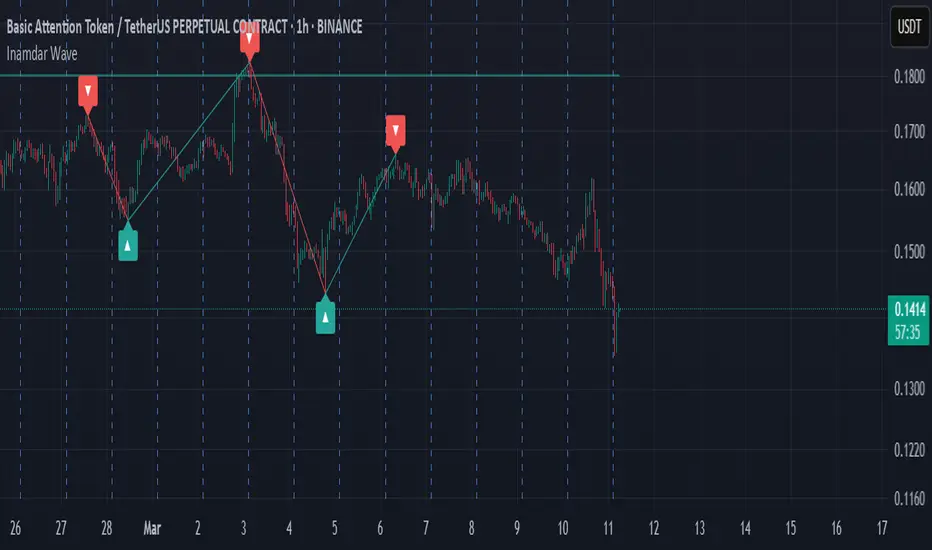
Inamdar Wave - Winning Wave
The **"Inamdar Wave"**, also known as the **"Winning Wave"**, is a cutting-edge market indicator designed to help traders ride the waves of momentum and capitalize on high-probability opportunities. With its unique ability to adapt to market shifts, the Inamdar Wave ensures you're always in sync with the market's most profitable moves, making it an indispensable tool for traders looking for consistent success.
### Key Features of the "Inamdar Wave":
1. **Dynamic Market Movement Detection**:
- The **Inamdar Wave** tracks the market’s momentum and identifies clear waves of movement, allowing traders to catch both upswings and downswings with ease.
- This indicator dynamically adjusts based on price action and volatility, ensuring you're always aligned with the market’s natural flow.
- Whether the market is trending or ranging, the **Inamdar Wave** keeps you on the right path, helping you surf the market's waves effortlessly.
2. **Highly Profitable Buy/Sell Signals**:
- The **Inamdar Wave** generates precise buy and sell signals that guide you to the most profitable entry and exit points.
- Its built-in filters ensure you avoid market noise, focusing only on high-probability trades that maximize your potential for profit.
- You’ll confidently enter trades at the start of each new wave, ensuring you ride the momentum for maximum gains.
3. **Visual Wave Highlighting**:
- Color-coded zones help you easily spot bullish (upward) and bearish (downward) waves.
- Green highlights signal upward waves, while red zones indicate downward waves, making it visually simple to recognize the current market direction.
- This feature allows for quick decision-making and a clear understanding of the market's direction at a glance.
4. **Tailored for Any Market Condition**:
- Whether you’re trading a calm or highly volatile market, the **Inamdar Wave** adapts to the changing conditions, ensuring consistent performance across all environments.
- Its flexibility allows it to work seamlessly with any asset class—stocks, forex, crypto, or commodities—making it an all-in-one solution for traders.
- The **Inamdar Wave**'s real-time adjustments keep it relevant regardless of market conditions or timeframes.
5. **Real-Time Alerts**:
- Get instant alerts when a new wave begins, whether it's a buy, sell, or wave reversal.
- You’ll never miss out on a profitable opportunity with real-time notifications that keep you one step ahead of the market.
- These alerts help you act quickly, maximizing the potential of every market movement.
### Inputs:
- **Wave Period**: Customize the sensitivity of the wave detection with adjustable periods to suit your trading style.
- **Signal Source**: Choose from different price sources to fine-tune how the **Inamdar Wave** reacts to market movements.
- **Signal Strength**: Control the sensitivity of wave detection to focus on only the strongest and most profitable moves.
- **Buy/Sell Signals**: Easily toggle buy/sell signals on your chart for enhanced clarity.
- **Wave Highlighting**: Turn visual wave highlights on or off, depending on your preference.
### Use Case:
The **Inamdar Wave** is perfect for traders looking to capture the most profitable waves in any market. Whether you're a short-term scalper or a long-term trend follower, this indicator keeps you in sync with the market’s natural rhythm, ensuring that you're always riding the winning wave. With its powerful buy/sell signals and dynamic wave detection, you'll be better positioned to take advantage of market momentum and secure consistent profits.
In conclusion, the **"Inamdar Wave"** is not just another indicator—it’s your key to riding the market’s most profitable waves with precision and confidence. By following the signals and staying in tune with the market’s natural flow, you’ll be able to maximize your gains and minimize your risks, ensuring a successful trading journey.
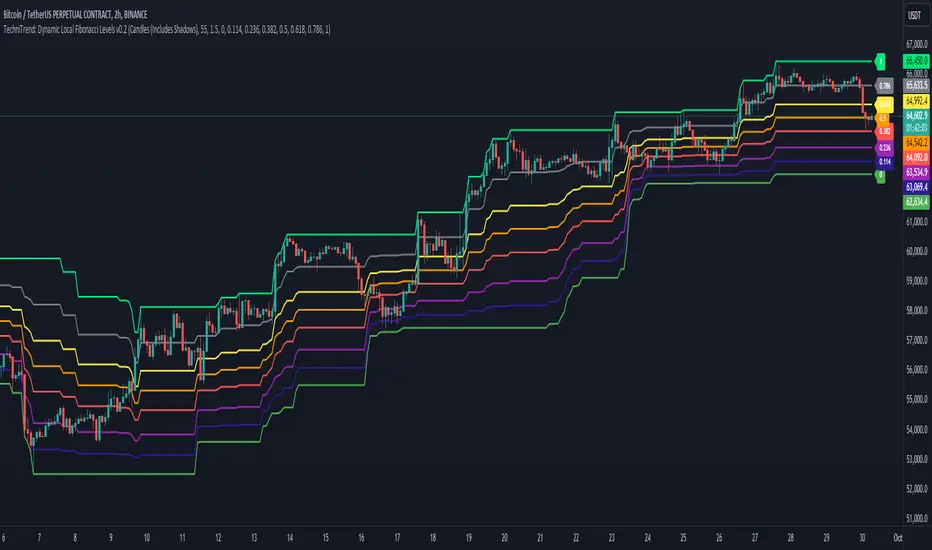
TechniTrend: Dynamic Local Fibonacci LevelsTechniTrend: Dynamic Local Fibonacci Levels
Description: The "Dynamic Local Fibonacci Levels" indicator dynamically displays Fibonacci levels only when the market is experiencing significant volatility. By detecting volatile price movements, this tool helps traders focus on Fibonacci retracement levels that are most relevant during high market activity, reducing noise from calm market periods.
Key Features:
Adaptive Fibonacci Levels: The indicator calculates and plots Fibonacci levels (from 0 to 1) only during periods of high volatility. This helps traders focus on actionable levels during significant price swings.
Customizable Chart Type: Users can choose between Candlestick charts (including shadows) or Line charts (excluding shadows) to determine the high and low price points for Fibonacci level calculations.
Volatility-Based Detection: The Average True Range (ATR) is used to detect significant volatility. Traders can adjust the ATR multiplier to fine-tune the sensitivity of the indicator to price movements.
Fully Customizable Fibonacci Levels: Traders can modify the default Fibonacci levels according to their preferences or trading strategies.
Real-Time Volatility Confirmation: Fibonacci levels are displayed only if the price range between the local high and low exceeds a user-defined volatility threshold, ensuring that these levels are only plotted when the market is truly volatile.
Customization Options:
Chart Type: Select between "Candles (Includes Shadows)" and "Line (Excludes Shadows)" for detecting price highs and lows.
Length for High/Low Detection: Choose the period for detecting the highest and lowest price in the given time frame.
ATR Multiplier for Volatility Detection: Adjust the sensitivity of the volatility threshold by setting the ATR multiplier.
Fibonacci Levels: Customize the specific Fibonacci levels to be displayed, from 0 to 1.
Usage Tips:
Focus on Key Levels During Volatility: This indicator is best suited for periods of high volatility. It can help traders identify potential support and resistance levels that may be more significant in turbulent markets.
Adjust ATR Multiplier: Depending on the asset you're trading, you might want to fine-tune the ATR multiplier to better suit the market conditions and volatility.
Recommended Settings:
ATR Multiplier: 1.5
Fibonacci Levels: Default levels set to 0.00, 0.114, 0.236, 0.382, 0.5, 0.618, 0.786, and 1.0
Length for High/Low Detection: 55
Use this indicator to detect key Fibonacci retracement levels in volatile market conditions and make more informed trading decisions based on price dynamics and volatility.
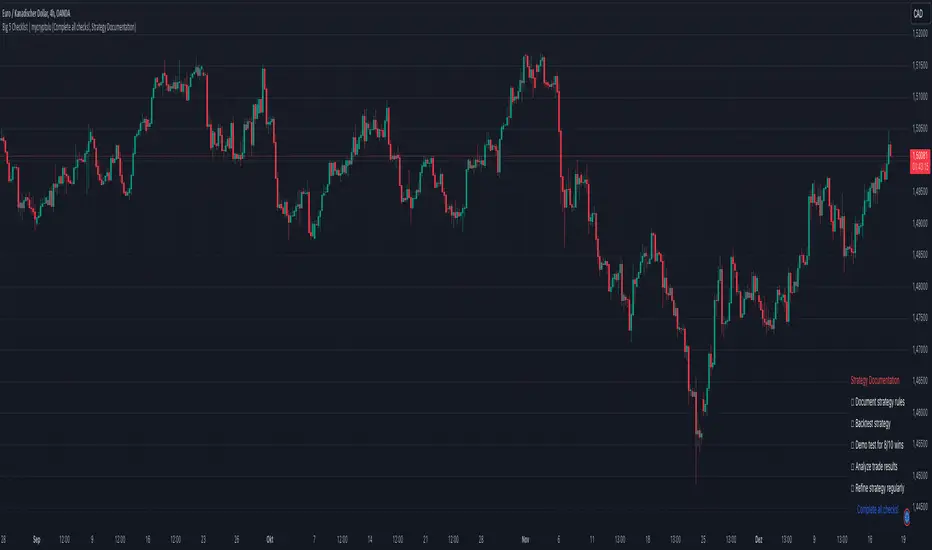
Big 5 Checklist | XEONEDIAThe Big 5 Checklist | XEONEDIA indicator is a powerful trading tool designed to help traders prepare their trading decisions in a structured and effective manner. The indicator encompasses five key areas:
Strategy Documentation :
✅ Ensure that the trading strategy is clearly defined and documented.
✅ Conduct backtesting.
✅ Perform demo testing with an 80% success rate.
✅ Analyze trading results.
✅ Regularly refine the strategy.
Risk Management :
✅ Minimize financial losses and ensure responsible trading.
✅ Set a risk limit of 1-2%.
✅ Use stop-loss orders.
✅ Ensure a risk-reward ratio of at least 2:1.
✅ Adjust position sizes.
Technical Analysis :
✅ Evaluate charts and indicators to identify trading opportunities.
✅ Identify support and resistance levels.
✅ Use technical indicators (e.g., RSI).
✅ Set entry and exit points.
✅ Establish alerts for specific market conditions.
Market Conditions :
✅ Consider external factors that may influence trading.
✅ Monitor the economic calendar.
✅ Apply fundamental analysis.
✅ Observe market volatility.
✅ Analyze global trends.
Psychological Management :
✅ Control emotions and mindset during trading.
✅ Adhere to the trading plan.
✅ Manage emotions while trading.
✅ Set realistic expectations.
✅ Take regular mental breaks.
Mastercheck
The Mastercheck provides a digital checklist where traders can track their progress live. Users can make their own notes and view their checklist on any TradingView device, ensuring they stay informed about their trading readiness and can make adjustments in real-time. ✅
Overall, the Big 5 Checklist | XEONEDIA indicator helps minimize risks and maximize the chances of successful trades by promoting systematic and comprehensive trading preparation.
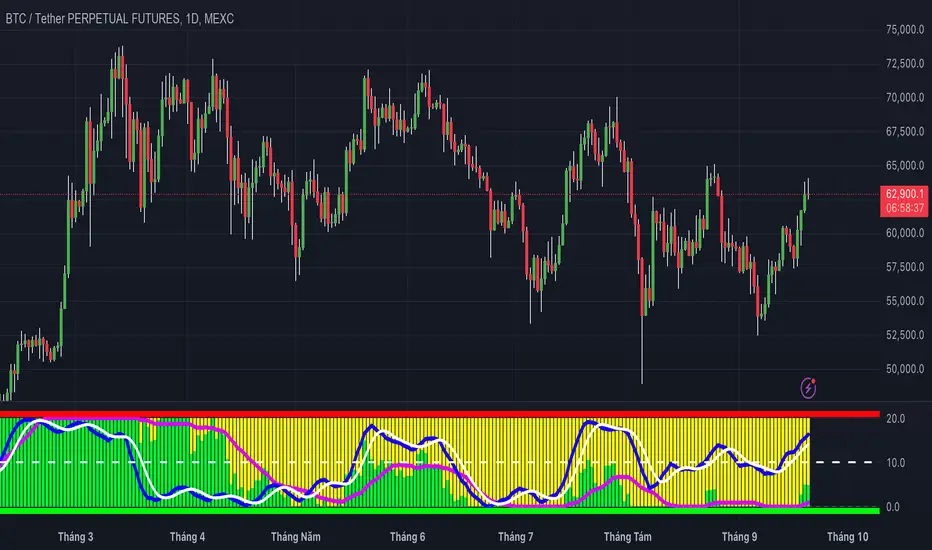
MCDX+RSI+SMA[THANHCONG]### Detailed Analysis of the MCDX+RSI+SMA Indicator
The MCDX+RSI+SMA indicator is designed to help investors conduct a deeper analysis of market trends by combining multiple technical factors into a single chart. This integration of popular indicators such as RSI, SMA, and Stochastic RSI provides investors with a comprehensive view of market movements, particularly in distinguishing between "Banker" and "Hot Money"—representing large and small capital flows.
#### Key Components of the Indicator:
1. **RSI for Banker and Hot Money:**
- **RSI (Relative Strength Index)** is a momentum oscillator that measures the speed and change of price movements, indicating overbought or oversold conditions. In this indicator, there are two distinct RSI lines configured for Banker (large capital) and Hot Money (small capital).
- Investors can adjust parameters like the RSI calculation period, baseline levels, and sensitivity for each type of capital flow, providing flexibility to adapt to varying market conditions.
2. **Moving Average (MA) of RSI:**
- The indicator employs two common types of Moving Averages: **SMA (Simple Moving Average)** and **EMA (Exponential Moving Average)**. These help smooth the RSI signals for Banker, offering a clearer view of the long-term trend of large capital in the market.
- Investors can select the type and period of the MA, allowing them to optimize the indicator for their trading style.
3. **Stochastic RSI:**
- The **Stochastic RSI** is incorporated to monitor overbought and oversold conditions over a specified timeframe. Parameters related to %K and %D of the Stochastic can also be adjusted to refine the accuracy of market signal analysis.
- A notable feature is the normalization of %K and %D on a 0-20 scale, making these lines compatible with other RSI charts, thus providing consistency in evaluating market strength.
4. **Overbought and Oversold Levels:**
- The indicator includes reference lines for overbought and oversold levels, aiding investors in identifying potential reversal zones in the market. This helps to avoid buying at excessively high prices or selling at excessively low prices.
#### Benefits for Investors:
- **Comprehensive View:** The indicator combines insights from both large (Banker) and small (Hot Money) capital flows, enabling investors to analyze not just trends but also the participation of each type of capital in the market.
- **Enhanced Technical Analysis:** By integrating multiple technical indicators within a single chart, investors can track important factors such as market momentum, overbought/oversold conditions, and capital flow shifts without needing to switch between various charts.
- **Flexibility and Customization:** The indicator allows adjustment of key parameters like the RSI period, sensitivity, type of MA, and Stochastic RSI settings, enabling investors to tailor the indicator to their trading strategy and timeframe.
- **Higher Reliability:** The combination of indicators like RSI, Stochastic RSI, and MA helps investors confirm trading signals more confidently. For instance, when both RSI and Stochastic RSI indicate overbought conditions, the likelihood of a reversal may be higher, reducing risk for investors.
#### Unique Features of the Indicator:
The MCDX+RSI+SMA indicator is a unique tool that integrates various market analysis factors into a single framework. This not only provides investors with a complete view of capital flows but also aids in optimizing decision-making based on multiple market aspects. Furthermore, its customizable parameters make it suitable for various trading strategies, from short-term to long-term.
Absolute ZigZagThis ZigZag Indicator is a bit unique in it's kind.
It uses my own Absolute ZigZag Lib to calculate the pivots:
Instead of using percentages or looking more than 1 bar left or right, this Zigzag library calculates pivots by just looking at the current bar highs and lows and the ones of one bar earlier. This is a very fast and accurate way of calculating pivots.
The library also features a solution for bars that have both a higher high and a higher low like seen below.
You can also use your own colors for the labels and the lines:
You can also quickly select a one-colored theme without changing all colors at once:

Market Structure Inducements ICT [TradinFinder] CHoch BOS Sweeps🔵 Introduction
Market Structure is the foundation for identifying trends in the market, crucial in technical analysis and strategies like ICT and SMC. Understanding key concepts such as Break of Structure (BOS) and Change of Character (CHOCH) helps traders recognize critical shifts in the market. BOS, referring to a Market Structure Change (BMS), and CHOCH or Market Structure Shift (MSS) signal trend reversals in the market.
Additionally, the concept of Inducement, a vital tool in Smart Money strategies, allows traders to avoid price traps. Identifying valid pullback, valid inducement, POI, and Liquidity Grab helps traders find optimal entry and exit points and leverage Smart Money movements effectively.
Bullish Market Structure :
Bearish Market Structure :
🔵 How to Use
The Market Structure indicator is designed to help traders better understand market structure and detect price traps. By using this indicator, you can identify the right entry and exit points based on structural changes in the market and avoid unprofitable trades. Below, we explain the key concepts and how to apply them in trading.
🟣 Market Structure
Market Structure refers to the overall pattern of price movement in the market. Using this indicator, traders can identify uptrends and downtrends and make better trading decisions based on changes in market structure. The two key concepts here are Break of Structure (BOS) and Change of Character (CHOCH).
Change of Character (CHOCH) : CHOCH occurs when the market shifts from an uptrend to a downtrend or vice versa. These changes typically indicate a broader trend reversal, and the indicator assists you in identifying them accurately.
Break of Structure (BOS) : When the market breaks a key support or resistance level, it signals a change in market structure. This indicator helps you identify these breakouts in time and take advantage of trading opportunities.
🟣 Inducement
Inducement refers to price traps set by Smart Money to trick retail traders into making the wrong trades. This indicator helps you recognize these traps and avoid unprofitable trades.
Valid Inducement : Valid Inducement refers to deliberately created price traps by major market players to gather liquidity from retail traders. Once the market has collected sufficient liquidity, it makes the real move, and professional traders use this moment to enter.
🟣 Valid Pullback
A Valid Pullback refers to a temporary market retracement, indicating a price correction within the main trend. This concept is crucial in technical analysis as it helps traders enter trades at the right time and profit from the continuation of the trend. The Market Structure indicator can identify these valid retracements, allowing traders to enter trades with greater confidence.
🟣 Point of Interest (POI)
Another important concept in market analysis is the Point of Interest (POI), referring to key price areas on the chart. POI includes zones where significant price movements are likely to occur. The Market Structure indicator helps you locate these key points and use them as entry signals for trades.
🟣 Liquidity Grab
Liquidity Grab refers to a scenario where the market intentionally moves to areas where retail traders' stop losses are placed. The goal is to gather liquidity, allowing major players to execute trades at better prices. By using this indicator, you can spot these liquidity grabs and avoid falling into price traps.
🔵 Setting
ChoCh Detector Period : The period of identifying the major market levels that occur when they break ChoCh.
BoS & Liquidity Detector Period : The period of identifying minor levels, which are used to identify BoS and Liquidity levels.
Inducement Detector Period : The period of identification of Inducement levels.
Fast Trend Detector : This feature will help you update the major market structure levels sooner.
Inducement Type Detector : Two modes "Sweeps" and "Total" can be used to identify the levels of Inducement. In "Sweeps" mode only Levels detected by touch shadow. In "Total" mode, all Levels are detected.
🔵 Conclusion
In financial market analysis and forex trading, identifying Market Structure and Inducement is crucial. Market Structure helps you detect uptrends and downtrends, and understand Break of Structure (BOS) and Change of Character (CHOCH). The concept of Inducement also enables traders to spot Smart Money price traps and avoid unprofitable trades.
The Market Structure indicator is a powerful tool that, by analyzing the market structure and concepts like valid pullback and valid inducement, helps you make more precise trade entries. Additionally, by identifying POI and Liquidity Grab, the indicator gives you the ability to spot key market zones and use them to your advantage in trading.

Volume Wave Trend ConfirmationUtility of the Indicator
The core utility of this indicator lies in its ability to utilize volume, a less frequently exploited metric in MACD analysis, providing several strategic advantages:
Trend Confirmation: By focusing on volume, the indicator confirms whether movements in price are backed by significant trading activity. A rising MACD line above the signal line, paired with increasing volume, can confirm the strength of an uptrend. Conversely, if the histogram turns negative while the MACD line falls below the signal line during a price drop, it confirms a robust downtrend.
Early Warning Signals: Changes in the histogram and divergences between the MACD and Signal lines can serve as early warnings of potential reversals or slowdowns in market momentum. For instance, a shrinking histogram in an uptrend might suggest that the upward movement is losing steam.
Market Sentiment: The integration of volume into the MACD framework allows the indicator to provide insights into underlying market sentiment. Higher volumes during price movements indicate stronger conviction among traders, making the trend more reliable.
Indicator Functionality
The "Volume Wave Trend Confirmation" indicator is built on the Moving Average Convergence Divergence (MACD) framework, but with a unique twist: it uses the smoothed moving averages (SMA) of trading volumes instead of price. The indicator calculates two specific SMAs of the volume — a shorter 33-period SMA and a longer 100-period SMA — and computes their difference. This difference is then used as the input for the MACD calculation, with typical parameters set at 12, 26, and a signal line of 9.
MACD Line (Blue): Represents the main line, calculated as the difference between the 12-period and 26-period exponential moving averages (EMA) of the volume difference.
Signal Line (Orange): A 9-period EMA of the MACD line, acting as a trigger for buy or sell signals.
Histogram (Blue/Purple): Measures the distance between the MACD line and the Signal line, colored blue when positive (above the Signal line) and purple when negative (below the Signal line).

Gaussian Filter [BigBeluga]The Gaussian Filter - BigBeluga indicator is a trend-following tool that uses a Gaussian filter to smooth price data and identify directional shifts in the market. It provides dynamic signals for entering and exiting trades based on trend changes, helping traders stay aligned with the market's momentum. What sets this indicator apart is its ability to display precise entry and exit points with real-time tracking of percentage price changes, making it ideal for trend-based strategies.
SP500:
NIFTY50:
🔵 KEY FEATURES & USAGE
◉ Gaussian Filter Trend Line:
//@function GaussianFilter is used for smoothing, reducing noise, and computing derivatives of data.
//@param src (float) The source data (e.g., close price) to be smoothed.
//@param params (GaussianFilterParams) Gaussian filter parameters that include length and sigma.
//@returns (float) The smoothed value from the Gaussian filter.
gaussian_filter(float src, params) =>
var float weights = array.new_float(params.length) // Array to store Gaussian weights
total = 0.0
pi = math.pi
for i = 0 to params.length - 1
weight = math.exp(-0.5 * math.pow((i - params.length / 2) / params.sigma, 2.0))
/ math.sqrt(params.sigma * 2.0 * pi)
weights.set(i, weight)
total := total + weight
for i = 0 to params.length - 1
weights.set(i, weights.get(i) / total)
sum = 0.0
for i = 0 to params.length - 1
sum := sum + src * weights.get(i)
sum
The core functionality of the Gaussian Filter line is to show trend direction. When the trend line increases four times consecutively, it indicates an uptrend signal. Similarly, if it decreases four times in a row, it signals a downtrend. The smoothness of the filter helps traders stay on the right side of the market by filtering out noise and emphasizing the dominant trend direction.
◉ Entry and Exit Levels with Real-Time Price and Performance Data:
Each time the indicator detects a trend change, it plots an entry or exit level on the chart. For an uptrend, an entry level is marked, and for a downtrend, an exit level is plotted. These levels display the price at the time of the signal.
While the trend is ongoing, the indicator tracks the percentage change in price from the initial entry or exit signal to the current bar, updating in real-time. When a trend concludes, it displays the total percentage change from the entry or exit point to the trend's end. This feature provides valuable insights into how much the price has moved during each trend phase and allows traders to monitor the performance of each trade.
◉ Color-Coded Candlestick Representation with Trend Shift Alerts:
In addition to coloring the candlesticks based on the trend direction, the indicator also uses gray candles to highlight potential early trend shifts. For example, if the Gaussian Filter detects a downtrend but the price moves above the filter line, the candles turn gray, signaling a possible reversal or shift in momentum. Similarly, in an uptrend, if the price moves below the Gaussian Filter line, the candles turn gray as an early indication of potential bearish momentum. This visual cue helps traders stay alert to possible faster shifts in market direction, allowing for quicker decision-making.
🔵 CUSTOMIZATION
Length and Sigma for Gaussian Filter:
Adjust the length and sigma parameters to control how the Gaussian Filter smooths the price data. A longer length provides smoother trend lines, while adjusting sigma can fine-tune the level of smoothing applied.
Levels Display and Candle Coloring:
You can toggle the visibility of entry and exit levels as well as enable or disable the dynamic coloring of candlesticks based on the trend direction. The additional gray color setting provides an extra layer of information, allowing you to spot potential trend reversals early.
🔵 CONCLUSION
The Gaussian Filter indicator is a powerful tool for identifying and following market trends. By providing clear entry and exit signals, along with real-time tracking of price changes, it gives traders a structured way to manage trades and monitor performance. The color-coded candles, including gray to highlight possible trend shifts, add another dimension to visualizing market dynamics. The added flexibility of customizing colors and trend levels makes it a versatile indicator suitable for both trend-following and reversal strategies.

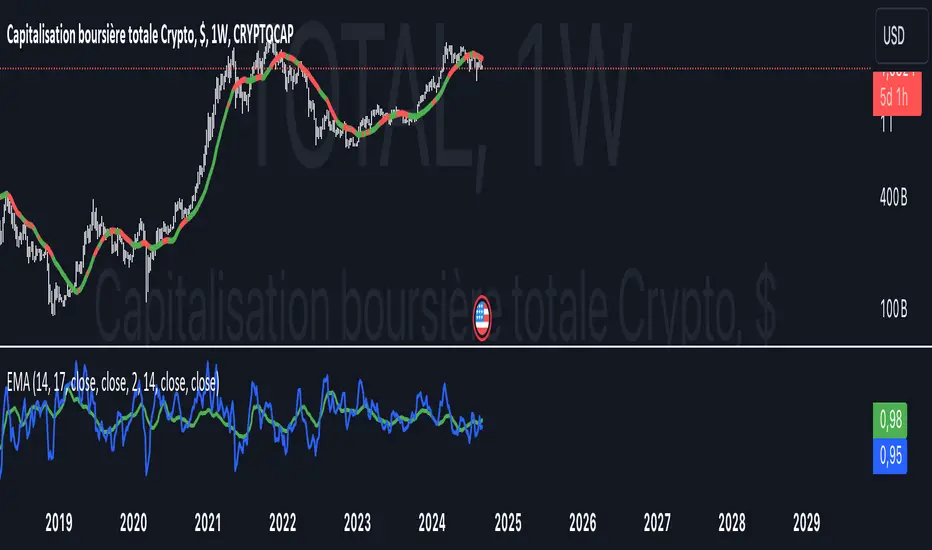
COMBINED EMA & SMA + DOUBLE DEMA, $TOTAL 1W / 5D -- Ruslan CRYPTOCAP:TOTAL
This Pine Script indicator, **"EMAS"**, provides an enhanced visualization of multiple types of moving averages, including both **Exponential Moving Averages (EMA)**, **Simple Moving Averages (SMA)**, and **Double Exponential Moving Averages (DEMA)**. It allows the user to observe the relationship between these different types of moving averages and apply regime-based coloring to price bars based on the comparison between the EMAs and DEMAs.
#### Key Features:
1. **EMA & SMA:**
- **EMA (Exponential Moving Average):** Calculated using a customizable lookback period (default 17), the EMA places greater weight on more recent prices, making it react faster to price changes.
- **SMA (Simple Moving Average):** Uses an equal-weighted average over a customizable lookback period (default 14), providing a slower-moving average compared to the EMA.
2. **DEMA (Double Exponential Moving Average):**
- Two separate DEMA lines are plotted using different lookback periods (default 2 and 14). The DEMA is a smoother and faster-responding version of the EMA, intended to reduce lag while retaining trend-following characteristics.
3. **Combined Signals:**
- The script calculates ratios between EMA/SMA (`comb`) and DEMA1/DEMA2 (`combd`) to generate a **regime-based bar coloring system**:
- If `combd > comb`: The bars are colored **green**, indicating that DEMAs are outperforming the EMAs, potentially signaling a stronger trend or momentum.
- If `comb > combd`: The bars are colored **red**, suggesting that the EMAs are dominant, which may indicate a different phase of the market.
4. **Signal SMA:**
- A 21-period **SMA** is plotted as a general trend-following signal. It provides a broader perspective on the current price trend, helping to smooth out short-term fluctuations.
5. **Customizable Options:**
- **"Show MAs?"**: The user has the option to toggle the display of the EMA, SMA, and DEMA lines on or off.
- **Custom Period Inputs**: Each type of moving average can have its period length customized via the input settings for better adaptability to different market conditions.
#### How to Use the Indicator:
- **Trend Following**:
The **EMA, SMA, and DEMA** values can help you determine the direction of the trend. When the EMA is above the SMA, it could indicate a stronger, more recent upward momentum. Similarly, DEMA comparisons provide smoother and faster trend signals.
- **Bar Coloring Regime**:
The **bar color** gives a quick visual cue of the regime:
- **Green bars** suggest that DEMAs are indicating stronger bullish or bearish signals compared to the EMAs.
- **Red bars** imply the opposite, where EMAs may be showing stronger signals, but possibly with more noise or lag.
- **Signal SMA**:
The **21-period SMA** line can be used as a simple trend indicator. When the price is above this line, it could signify an uptrend, while price movement below the line might indicate a downtrend.
#### Custom Inputs:
- **EMA Length**: Default is 17, but can be adjusted to fit your trading style.
- **SMA Length**: Default is 14.
- **DEMA Lengths**: Two customizable inputs for DEMA (default 2 and 14).
- **Source Selection**: You can choose which price source (close, open, high, low, etc.) to use for each calculation (default is the closing price).
#### Conclusion:
This indicator is useful for traders who wish to blend **trend-following strategies** (using EMA, SMA, and DEMA) with **visual regime indicators** (bar coloring). It is highly customizable, allowing traders to adjust settings based on their market approach. The combination of EMAs and DEMAs provides a nuanced view of price dynamics, potentially leading to better-informed trading decisions.
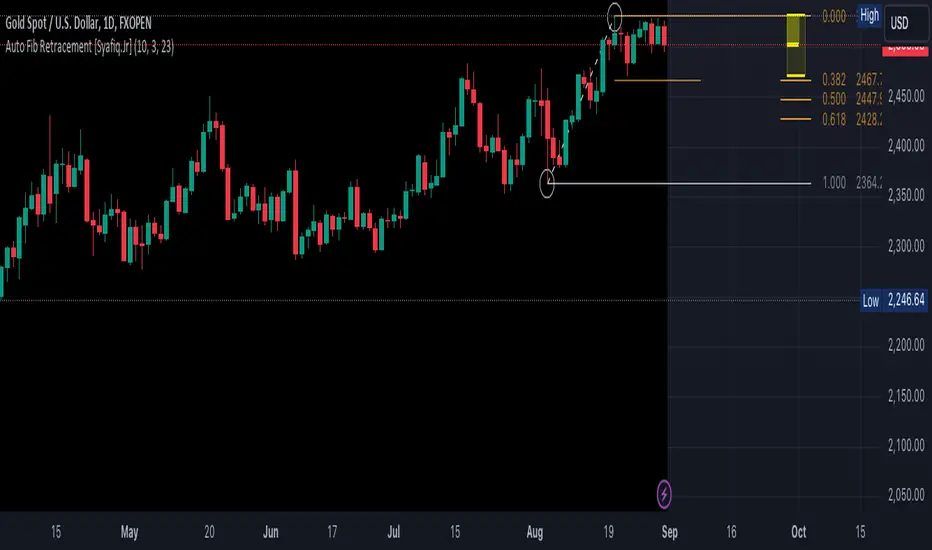
Auto Fib Retracement [Syafiq.Jr]This TradingView script is an advanced indicator titled "Auto Fib Retracement Neo ." It's designed to automatically plot Fibonacci retracement levels on a price chart, aiding in technical analysis for traders. Here's a breakdown of its functionality:
Core Functionality :
The script identifies pivot points (highs and lows) on a chart and draws Fibonacci retracement lines based on these points. The lines are dynamic, updating in real-time as the market progresses.
Customizable Inputs :
Depth: Determines the minimum number of bars considered in the pivot point calculation.
Deviation: Adjusts the sensitivity of the script in identifying new pivots.
Fibonacci Levels: Allows users to select which retracement levels (236, 382, 500, 618, 786, 886) are displayed on the chart.
Visual Settings: Customization options include the colors and styles of pivot points, trend lines, and the retracement meter.
Pivot and Line Calculation:
The script calculates the deviation between the current price and the last pivot point. If the deviation exceeds a certain threshold, it identifies a new pivot and draws a trend line between the previous pivot and the current one.
Visual Aids :
The indicator provides extensive visual aids, including pivot points marked with circles, dashed trend lines connecting pivots, and labels displaying additional information like price and delta rate.
Performance :
Optimized to handle large datasets, the script is configured to process up to 4000 bars and can manage numerous lines and labels efficiently.
Background and Appearance :
The script allows for customization of the chart background color, enhancing visibility based on user preferences.
In essence, this script is a powerful tool for traders who rely on Fibonacci retracement levels to identify potential support and resistance areas, allowing for a more automated and visually guided approach to market analysis.
Unleash Bitcoin's Next Move with S&P Divergence!BTC_GO_LONG_SONG
This script works like a special helper that watches two things: Bitcoin (a popular type of digital money) and the S&P 500 (which is like a big basket of important companies' stocks).
Imagine Bitcoin and the S&P 500 are connected by an invisible elastic band.
When they move together: The elastic band stays relaxed.
When they move apart: The elastic band stretches.
This script keeps an eye on how much the elastic band stretches.
If Bitcoin starts to move in a different way than the S&P 500 and the band stretches a lot, the script thinks that Bitcoin might snap back or make a big jump soon.
Here’s how it works:
Volume Check: The script looks at how many people are buying or selling Bitcoin. If a lot more people are trading than usual, it’s like a signal that something big might happen.
Price Movement: It watches how Bitcoin’s price is changing. If Bitcoin breaks away from its usual pattern and moves far from where it was recently, it could be a sign that a big change is coming.
Elastic Band Check: The script checks if Bitcoin is moving differently than the S&P 500. If Bitcoin is doing its own thing while the S&P 500 moves in another direction, it’s like the elastic band is being stretched.
When all these things happen together—high trading volume, unusual price movement, and a stretched elastic band—the script shows a green triangle on the chart.
This triangle is a signal for people who believe Bitcoin might go up (the Bulls) that it could be a good time to think about entering a trade because a breakout might be coming.
This explanation uses the idea of an elastic band to describe the relationship between Bitcoin and the S&P 500, making it easier to understand how this script helps traders spot potential breakout opportunities.

Breaker Blocks + Order Blocks confirm [TradingFinder] BBOB Alert🔵 Introduction
In the realm of technical analysis, various tools and concepts are employed to identify key levels on price charts. These tools assist traders in analyzing market trends with greater precision, enabling them to optimize their trading decisions. Among these tools, the Order Block and Breaker Block hold a significant place, serving as effective instruments for analyzing market structure.
🟣 Order Block
An Order Block refers to zones on a chart where large financial institutions and high-volume traders place their orders. Due to the substantial volume of buy or sell orders in these areas, they are often regarded as pivotal points for potential price reversals or temporary pauses in a trend. Order Blocks are particularly crucial when prices react to these zones after a strong market move, acting as strong support or resistance levels.
🟣 Breaker Block
On the other hand, a Breaker Block refers to areas on a chart that previously functioned as Order Blocks but where the price has managed to break through and continue in the opposite direction. These zones are typically recognized as key points where market trends might shift, helping traders identify potential reversal points in the market.
🟣 Overlapping Block (BBOB)
Now, imagine a scenario where these two essential concepts in technical analysis—Order Blocks and Breaker Blocks—overlap on a chart. Although this overlap is not specifically discussed within the ICT (Inner Circle Trader) trading framework, exploring and utilizing this overlap can provide traders with powerful insights into strong support and resistance zones. The combination of these two robust concepts can highlight critical areas in trading, potentially offering significant advantages in making informed trading decisions.
In this article, we will delve into the concept of this overlap, explaining how to utilize it in trading strategies. Additionally, we will analyze the potential outcomes and benefits of incorporating this concept into your trading decisions.
Bullish Overlapping Block (BBOB) :
Bearish Overlapping Block (BBOB) :
🔵 How to Use
The overlap between Order Blocks and Breaker Blocks is a compelling and powerful concept that can help traders identify key levels on the chart with a high probability of success. This overlap is particularly valuable because it combines two well-regarded concepts in technical analysis—zones of high order volume and critical market shifts.
🟣 Here’s how to effectively use this overlap in your trading
1. Dentifying the Overlapping Block : To make the most of the overlap between Order Blocks and Breaker Blocks, begin by identifying these zones separately. Order Blocks are areas where price typically reacts and reverses after a strong market move.
Breaker Blocks are areas where a previous Order Block has been breached, and the price continues in the opposite direction. When these two zones overlap on a chart, it’s crucial to pay close attention to this area, as it represents a high-probability reaction zone.
2. Analyzing the Overlapping Block : After identifying the overlap zone, carefully analyze price action within this region. Candlestick patterns and price behavior can provide essential clues.
If the price reaches this overlap zone and strong reversal patterns such as Pin Bars or Engulfing patterns are observed, it’s likely that this zone will act as a pivotal reversal point. In such cases, entering a trade with confidence becomes more feasible.
3. Entering the Trade : When sufficient signs of price reaction are present in the overlap zone, you can proceed to enter the trade. If the overlap zone is within an uptrend and bullish reversal signals are evident, a long position might be appropriate.
Conversely, if the overlap zone is in a downtrend and bearish reversal signals are observed, a short position would be more suitable.
4. Risk Management : One of the most critical aspects of trading in overlap zones is managing risk. To protect your capital, place your stop loss near the lowest point of the Order Block (for buy trades) or the highest point (for sell trades). This approach minimizes potential losses if the overlap zone fails to hold.
5. Price Targets : After entering the trade, set your price targets based on other key levels on the chart. These targets could include other support and resistance zones, Fibonacci levels, or pivot points.
Bullish Overlapping Block :
Bearish Overlapping Block :
🟣 Benefits of the Overlapping Block Between Order Block and Breaker Block
1. Enhanced Precision in Identifying Key Levels : The overlap between these two zones usually acts as a highly reliable area for price reactions, increasing the accuracy of identifying entry and exit points.
2. Reduced Trading Risk : Given the high importance of the overlap zone, the likelihood of making incorrect decisions is reduced, contributing to overall lower trading risk.
3. Increased Probability of Success : The overlap between Order Blocks and Breaker Blocks combines two powerful concepts, enhancing the likelihood of success in trades, as multiple indicators confirm the importance of the area.
4. Creation of Better Trading Opportunities : Overlap zones often provide traders with more robust trading opportunities, as these areas typically represent strong reversal points in the market.
5. Compatibility with Other Technical Tools : This concept seamlessly integrates with other technical analysis tools such as Fibonacci retracements, trend lines, and chart patterns, offering a more comprehensive market analysis.
🔵 Setting
🟣 Global Setting
Pivot Period of Order Blocks Detector : Enter the desired pivot period to identify the Order Block.
Order Block Validity Period (Bar) : You can specify the maximum time the Order Block remains valid based on the number of candles from the origin.
Mitigation Level Order Block : Determining the basic level of a Order Block. When the price hits the basic level, the Order Block due to mitigation.
Mitigation Level Breaker Block : Determining the basic level of a Breaker Block. When the price hits the basic level, the Breaker Block due to mitigation.
Mitigation Level Overlapping Block : Determining the basic level of a Overlapping Block. When the price hits the basic level, the Overlapping Block due to mitigation.
🟣 Overlapping Block Display
Show All Overlapping Block : If it is turned off, only the last Order Block will be displayed.
Demand Overlapping Block : Show or not show and specify color.
Supply Overlapping Block : Show or not show and specify color.
🟣 Order Block Display
Show All Order Block : If it is turned off, only the last Order Block will be displayed.
Demand Main Order Block : Show or not show and specify color.
Demand Sub (Propulsion & BoS Origin) Order Block : Show or not show and specify color.
Supply Main Order Block : Show or not show and specify color.
Supply Sub (Propulsion & BoS Origin) Order Block : Show or not show and specify color.
🟣 Breaker Block Display
Show All Breaker Block : If it is turned off, only the last Breaker Block will be displayed.
Demand Main Breaker Block : Show or not show and specify color.
Demand Sub (Propulsion & BoS Origin) Breaker Block : Show or not show and specify color.
Supply Main Breaker Block : Show or not show and specify color.
Supply Sub (Propulsion & BoS Origin) Breaker Block : Show or not show and specify color.
🟣 Order Block Refinement
Refine Order Blocks : Enable or disable the refinement feature. Mode selection.
🟣 Alert
Alert Name : The name of the alert you receive.
Alert Overlapping Block Mitigation :
On / Off
Message Frequency :
This string parameter defines the announcement frequency. Choices include: "All" (activates the alert every time the function is called), "Once Per Bar" (activates the alert only on the first call within the bar), and "Once Per Bar Close" (the alert is activated only by a call at the last script execution of the real-time bar upon closing). The default setting is "Once per Bar".
Show Alert Time by Time Zone :
The date, hour, and minute you receive in alert messages can be based on any time zone you choose. For example, if you want New York time, you should enter "UTC-4". This input is set to the time zone "UTC" by default.
🔵 Conclusion
The overlap between Order Blocks and Breaker Blocks represents a critical and powerful area in technical analysis that can serve as an effective tool for determining entry and exit points in trading.
These zones, due to the combination of two key concepts in technical analysis, hold significant importance and can help traders make more confident trading decisions.
Although this concept is not specifically discussed in the ICT framework and is introduced as a new idea, traders can achieve better results in their trades through practice and testing.
Utilizing the overlap between Order Blocks and Breaker Blocks, in conjunction with other technical analysis tools, can significantly improve the chances of success in trading.

Jason's Simple Moving Averages WaveUnderstanding the Script:
Purpose: This script identifies potential trend direction and momentum using a moving average and wave amplitude calculation. It shows a green line when the price is trending upwards and a red line when trending downwards.
Strategy: This script doesn't provide a complete trading strategy. It's an indicator designed to be used alongside other tools.
Parameters: You can adjust the "Moving Average Length" input to change the sensitivity of the indicator. A shorter length will react quicker to price changes, while a longer length will be smoother but less responsive.
How to Use it:
Load the Script: In TradingView, navigate to the indicator creation section and paste the provided script code.
Adjust Parameters: Set the "Moving Average Length" based on your preferred timeframe and trading style.
Combine with Other Tools: Use the indicator along with other technical indicators or price action analysis to confirm potential entry and exit points for trades.
Here are some additional points to consider:
Crossovers: You could look for buy signals when the price crosses above the green line and sell signals when it crosses below the red line. However, these can be prone to false signals.
Divergence: Look for divergences between the price movement and the wave indicator. For example, a rising price with a falling wave could indicate overbought conditions and a potential reversal.
Confirmation: Don't rely solely on this indicator. Use it alongside other confirmations from price action, volume analysis, or other indicators to identify higher probability trades.
Important Note:

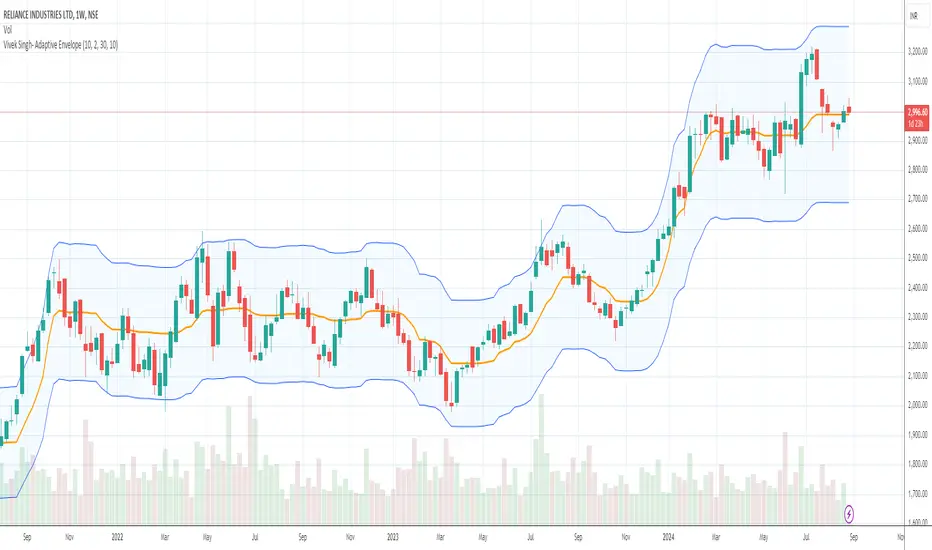
Envelop-Ama-VivekThe Adaptive Moving Average (AMA) is a type of moving average developed by Perry Kaufman, designed to adapt to the market's volatility. Unlike traditional moving averages that use fixed periods for smoothing, the AMA adjusts its sensitivity based on the market's noise and trends.
### Key Features of AMA:
1. **Adaptive Sensitivity:**
- The AMA responds more quickly to significant market movements while filtering out minor fluctuations. This is achieved by adjusting the smoothing constant dynamically.
- In trending markets, the AMA becomes more sensitive, allowing it to capture trends faster.
- In choppy or sideways markets, the AMA reduces its sensitivity, thus minimizing the impact of noise and avoiding false signals.
2. **Efficiency Ratio (ER):**
- The ER is a core component of the AMA. It measures the efficiency of price movement by comparing the net price change to the total price change over a given period.
- A higher ER indicates a strong trend, while a lower ER suggests more noise in the market.
3. **Smoothing Constant (SC):**
- The SC determines how much weight is given to the most recent price relative to the previous AMA value.
- The SC is dynamically adjusted based on the ER, with higher values used during strong trends and lower values during volatile or choppy periods.
### Applications of AMA:
- **Trend Detection:** The AMA is useful for identifying the start of a new trend or confirming an existing one, as it adjusts quickly to significant price movements.
- **Noise Reduction:** By adapting to market conditions, the AMA helps in filtering out market noise, making it easier to distinguish between genuine trends and short-term fluctuations.
- **Entry and Exit Signals:** Traders can use the AMA to generate buy and sell signals. For instance, when the price crosses above the AMA, it might indicate a buying opportunity, and when it crosses below, it might signal a selling opportunity.
### Benefits:
- **Adaptive Nature:** Its ability to adjust to market conditions makes the AMA more reliable in different market environments.
- **Reduced Lag:** Compared to traditional moving averages, the AMA reduces lag during trending markets, allowing for quicker responses to price movements.
### Drawbacks:
- **Complexity:** The calculation of the AMA is more complex compared to simple moving averages, which might make it less accessible to some traders.
- **Parameter Sensitivity:** The effectiveness of the AMA can vary depending on the chosen parameters (e.g., length, fast length, slow length), requiring careful tuning.
In summary, the AMA is a powerful tool for traders looking to capture trends while minimizing the impact of market noise. Its adaptive nature makes it suitable for various market conditions, providing a balance between responsiveness and noise reduction.
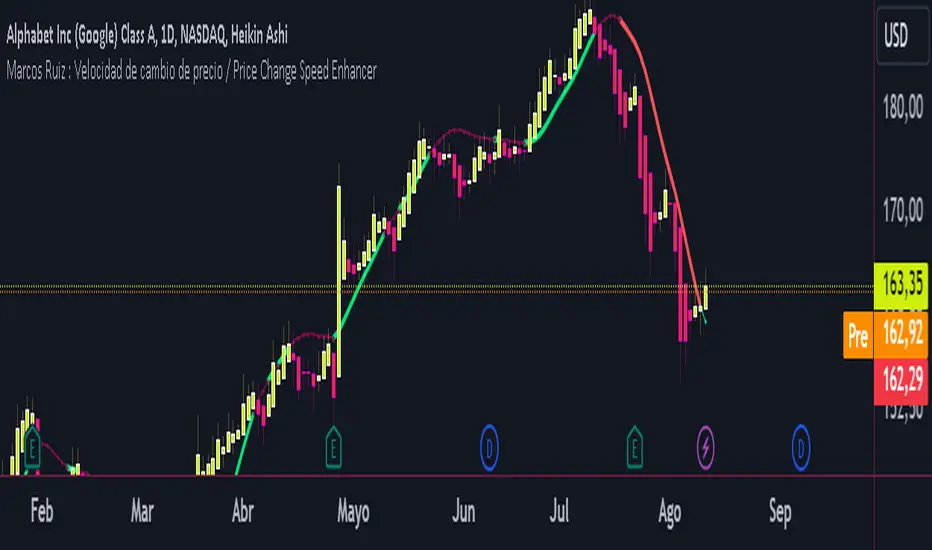
Marcos Ruiz :Price Change Speed Descripción:
Este indicador en Pine Script está diseñado para analizar y visualizar dinámicamente la velocidad de los cambios de precio en un gráfico de TradingView. El indicador permite a los usuarios seleccionar diferentes tipos de medias móviles y fuentes de precios para calcular y mostrar el cambio porcentual en el precio durante un período especificado
Características:
Selección de Fuente de Precio: Elige entre cierre, apertura, alto, o bajo para los cálculos de precios
Tipos de Media Móvil: Selecciona entre SMA, WMA, EMA, HMA, o VWMA para determinar la media móvil utilizada en el cálculo de la velocidad promedio
Coloreado Dinámico: El color de la línea de la media móvil cambia según la velocidad de cambio de precio
Aumento de Velocidad: Cuando la velocidad del cambio de precio está aumentando, la media móvil se colorea según upColor definido por el usuario
Disminución de Velocidad: Cuando la velocidad está disminuyendo, la media móvil se colorea según downColor definido por el usuario
Posición Neutral: Coloreado adicional para escenarios donde el precio está por encima o por debajo de la media móvil, pero no cumple con las condiciones de aumento/disminución
Factor de Refuerzo: Ajusta la sensibilidad del cálculo del cambio de velocidad
Uso:
Parámetros de Entrada:
Define el Período para establecer la ventana de retroceso para calcular la velocidad
Elige la Fuente de Precio para determinar qué datos de precios usar
Selecciona el Tipo de Media Móvil y ajusta la Longitud de EMA para la comparación
Interpretación:
El indicador traza la media móvil seleccionada con colores dinámicos basados en la velocidad calculada del cambio de precio
Los cambios positivos y negativos en la velocidad se indican con diferentes colores, proporcionando una representación visual del momento y la fuerza de la tendencia del precio
Nota: Este script es el resultado de un desarrollo y pruebas extensivas. Se agradecen mucho sus comentarios y contribuciones
Description:
This Pine Script indicator is designed to dynamically analyze and visualize the speed of price changes on a TradingView chart. The indicator allows users to select different moving average types and price sources to compute and display the percentage change in price over a specified period
Features:
Price Source Selection: Choose from close, open, high, or low for price calculations
Moving Average Types: Select from SMA, WMA, EMA, HMA, or VWMA to determine the moving average used for computing average speed
Dynamic Coloring: The moving average line's color changes based on the speed of price change
Increasing Speed: When the price change speed is increasing, the moving average is colored according to the user-defined upColor
Decreasing Speed: When the speed is decreasing, the moving average is colored according to the user-defined downColor
Neutral Position: Additional coloring for scenarios where the price is above or below the moving average but not meeting the increase/decrease conditions
Reinforcement Factor: Adjusts the sensitivity of the speed change calculation
Usage:
Input Parameters:
Set the Period to define the lookback window for calculating speed
Choose the Price Source to determine which price data to use
Select the Moving Average Type and adjust the EMA Length for comparison
Interpretation:
The indicator plots the selected moving average with dynamic colors based on the calculated speed of price change
Positive and negative changes in speed are indicated by different colors, providing a visual representation of price momentum and trend strength
Note: This script is the result of extensive development and testing. Your feedback and contributions are highly appreciated
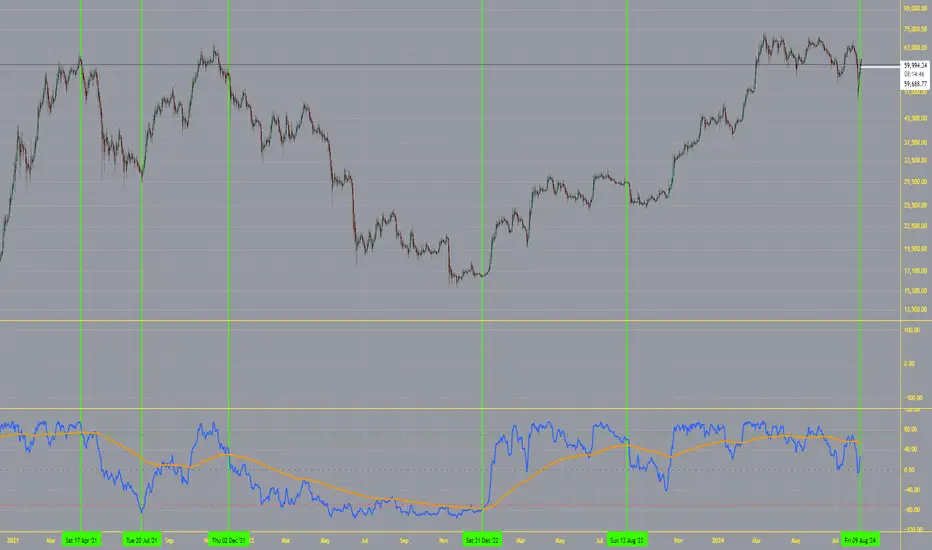
Price Oscillator TR### Summary: How to Use the Price Oscillator with EMA Indicator
The **Price Oscillator with EMA** is a custom technical analysis tool designed to help traders identify potential buying and selling opportunities based on price momentum. Here's how to use it:
1. **Understanding the Oscillator**:
- The oscillator is calculated by normalizing the current price relative to the highest high and lowest low over a specified lookback period. It fluctuates between -70 and +70.
- When the oscillator is near +70, the price is close to the recent highs, indicating potential overbought conditions. Conversely, when it’s near -100, the price is close to recent lows, indicating potential oversold conditions.
2. **Exponential Moving Average (EMA)**:
- The indicator includes an EMA of the oscillator to smooth out price fluctuations and provide a clearer signal.
- The EMA helps to filter out noise and confirm trends.
3. **Trading Signals**:
- **Bullish Signal**: A potential buying opportunity is signaled when the oscillator crosses above its EMA. This suggests increasing upward momentum.
- **Bearish Signal**: A potential selling opportunity is signaled when the oscillator crosses below its EMA. This indicates increasing downward momentum.
4. **Visual Aids**:
- The indicator includes horizontal lines at +70, 0, and -70 to help you quickly assess overbought, neutral, and oversold conditions.
- The blue line represents the oscillator, while the orange line represents the EMA of the oscillator.
### How to Use:
- **Set your parameters**: Adjust the lookback period and EMA length to fit your trading strategy and time frame.
- **Watch for Crossovers**: Monitor when the oscillator crosses the EMA. A crossover from below to above suggests a buy, while a crossunder from above to below suggests a sell.
- **Confirm with Other Indicators**: For more reliable signals, consider using this indicator alongside other technical tools like volume analysis, trend lines, or support/resistance levels.
This indicator is ideal for traders looking to capture momentum-based trades in various market conditions.
Butterfly Harmonic Pattern [TradingFinder] Harmonic Detector🔵 Introduction
The Butterfly Harmonic Pattern is a sophisticated and highly regarded tool in technical analysis, utilized by traders to identify potential reversal points in the financial markets. This pattern is distinguished by its reliance on Fibonacci ratios and geometric configurations, which aid in predicting price movements with remarkable precision.
The origin of the Butterfly Harmonic Pattern can be traced back to the pioneering work of Bryce Gilmore, who is credited with discovering this pattern. Gilmore's extensive research and expertise in Fibonacci ratios laid the groundwork for the identification and application of this pattern in technical analysis.
The Butterfly pattern, like other harmonic patterns, is based on the principle that market movements are not random but follow specific structures and ratios.
The pattern is characterized by a distinct "M" shape in bullish scenarios and a "W" shape in bearish scenarios, each indicating a potential reversal point. These formations are identified by specific Fibonacci retracement and extension levels, making the Butterfly pattern a powerful tool for traders seeking to capitalize on market turning points.
The precise nature of the Butterfly pattern allows for the accurate prediction of target prices and the establishment of strategic entry and exit points, making it an indispensable component of a trader's analytical arsenal.
Bullish :
Bearish :
🔵 How to Use
Like other harmonic patterns, the Butterfly pattern is categorized based on how it forms at the end of an uptrend or downtrend. Unlike the Gartley and Bat patterns, the Butterfly pattern, similar to the Crab pattern, forms outside the wave 3 range at the end of a rally.
🟣 Types of Butterfly Harmonic Patterns
🟣 Bullish Butterfly Pattern
This pattern forms at the end of a downtrend and leads to a trend reversal from a downtrend to an uptrend.
🟣 Bearish Butterfly Pattern
In contrast to the Bullish Butterfly pattern, this pattern forms at the end of an uptrend and warns analysts of a trend reversal to a downtrend. In this case, traders are encouraged to shift their trading stance from buy trades to sell trades.
Advantages and Limitations of the Butterfly Pattern in Technical Analysis :
The Butterfly pattern is considered one of the precise and stable tools in financial market analysis. However, it is always important to pay special attention to the advantages and limitations of each pattern.
Here, we review the advantages and disadvantages of using the Butterfly harmonic pattern :
The main advantage of the Butterfly pattern is providing very accurate signals.
Using Fibonacci golden ratios and geometric rules, the Butterfly pattern identifies patterns accurately and systematically. (This high accuracy significantly helps investors in making trading decisions.)
Identifying this pattern requires expertise and experience in technical analysis.
Recognizing the Butterfly pattern might be complex for beginner traders. (Correct identification of the pattern necessitates mastery over geometric principles and Fibonacci ratios.)
The Butterfly harmonic pattern might issue false trading signals. (Traders usually combine the Butterfly pattern with other technical tools to confirm buy and sell signals.)
🔵 Setting
🟣 Logical Setting
ZigZag Pivot Period : You can adjust the period so that the harmonic patterns are adjusted according to the pivot period you want. This factor is the most important parameter in pattern recognition.
Show Valid Forma t: If this parameter is on "On" mode, only patterns will be displayed that they have exact format and no noise can be seen in them. If "Off" is, the patterns displayed that maybe are noisy and do not exactly correspond to the original pattern.
Show Formation Last Pivot Confirm : if Turned on, you can see this ability of patterns when their last pivot is formed. If this feature is off, it will see the patterns as soon as they are formed. The advantage of this option being clear is less formation of fielded patterns, and it is accompanied by the latest pattern seeing and a sharp reduction in reward to risk.
Period of Formation Last Pivot : Using this parameter you can determine that the last pivot is based on Pivot period.
🟣 Genaral Setting
Show : Enter "On" to display the template and "Off" to not display the template.
Color : Enter the desired color to draw the pattern in this parameter.
LineWidth : You can enter the number 1 or numbers higher than one to adjust the thickness of the drawing lines. This number must be an integer and increases with increasing thickness.
LabelSize : You can adjust the size of the labels by using the "size.auto", "size.tiny", "size.smal", "size.normal", "size.large" or "size.huge" entries.
🟣 Alert Setting
Alert : On / Off
Message Frequency : This string parameter defines the announcement frequency. Choices include: "All" (activates the alert every time the function is called), "Once Per Bar" (activates the alert only on the first call within the bar), and "Once Per Bar Close" (the alert is activated only by a call at the last script execution of the real-time bar upon closing). The default setting is "Once per Bar".
Show Alert Time by Time Zone : The date, hour, and minute you receive in alert messages can be based on any time zone you choose. For example, if you want New York time, you should enter "UTC-4". This input is set to the time zone "UTC" by default.

Sylvain Zig-Zag [MyTradingCoder]This Pine Script version of ZigZagHighLow is a faithful port of Sylvain Vervoort's original study, initially implemented in NinjaScript and later added to the thinkorswim standard library. This indicator identifies and connects swing points in price data, offering a clear visualization of market moves that exceed a specified threshold. Additionally, it now includes features for detecting and plotting support and resistance levels, enhancing its utility for technical analysis.
Overview
The Sylvain Zig-Zag study excels at highlighting significant price swings by plotting points where the price change, combined with volatility adjustments via the Average True Range (ATR), exceeds a user-defined percentage. It effectively smooths out minor fluctuations, allowing traders to focus on the primary market trends. This tool is particularly useful in identifying potential turning points, trends in price movements, and key support and resistance levels, making it a valuable addition to your technical analysis arsenal.
How It Works
The Sylvain Zig-Zag indicator works by detecting swing points in the price data and connecting them to form a zigzag pattern. A swing point is identified when the price moves a certain distance, defined by a combination of percentage change and ATR. This distance must be exceeded for a swing point to be plotted.
When the price moves upwards and exceeds the previous high by a specified percentage plus a factor of the ATR, a new high swing point is plotted. Conversely, a low swing point is plotted when the price moves downwards and exceeds the previous low by the same criteria. This ensures that only significant price moves are considered, filtering out minor fluctuations and providing a clear view of the overall market trend.
In addition to plotting zigzag lines, the indicator can now identify and draw support and resistance levels based on the detected swing points. These levels are crucial for identifying potential reversal areas and market structure.
Key Features
Swing Point Detection: Accurately identifies significant price swings by considering both percentage price change and volatility (via Average True Range).
Dynamic Support/Resistance: Automatically generates support and resistance lines based on the identified swing points, providing potential areas of price reversals.
Customizable Parameters: Tailor the indicator's sensitivity to your preferred trading style and market conditions. Adjust parameters like percentage reversal, ATR settings, and absolute/tick reversals.
Visual Clarity: Choose to display the ZigZag line, support/resistance levels, new trend icons, continuation icons, and even customize bar colors for easy visual analysis.
Trading Applications
Trend Identification: Easily visualize the prevailing market trend using the direction of the ZigZag line and support/resistance levels.
Entry/Exit Signals: Potential entry points can be identified when the price interacts with the dynamic support/resistance levels.
Stop-Loss Placement: Use recent swing points as logical places for setting stop-loss orders.
Profit Targets: Project potential price targets based on the distance between previous swing points.
Input Parameters
Several input parameters can be adjusted to customize the behavior of the Sylvain Zig-Zag indicator. These parameters allow traders to fine-tune the detection of swing points and support/resistance levels to better suit their trading strategy and the specific market conditions they are analyzing.
High Source and Low Source:
These inputs define the price points used for detecting high and low swing points, respectively. You can choose between high, low, open, or close prices for these calculations.
Percentage Reversal:
This input sets the minimum percentage change in price required for a swing to be detected. A higher percentage value will result in fewer but more significant swing points, while a lower value will detect more frequent, smaller swings.
Absolute Reversal:
This parameter allows for an additional fixed value to be added to the minimum price change and ATR change. This can be useful for increasing the distance between swing points in volatile markets.
ATR Length:
This input defines the period used for calculating the ATR, which is a measure of market volatility. A longer ATR period will smooth out the ATR calculation, while a shorter period will make it more sensitive to recent price changes.
ATR Multiplier:
This factor is applied to the ATR value to adjust the sensitivity of the swing point detection. A higher multiplier will increase the required price movement for a swing point to be plotted, reducing the number of detected swings.
Tick Reversal:
This input allows for an additional value in ticks to be added to the minimum price change and ATR change, providing further customization in the swing point detection process.
Support and Resistance:
Show S/R: Enable or disable the plotting of support and resistance levels.
Max S/R Levels: Set the maximum number of support and resistance levels to display.
S/R Line Width: Adjust the width of the support and resistance lines.
Visual Settings
The Sylvain Zig-Zag indicator also includes visual settings to enhance the clarity of the plotted swing points and trends. You can customize the color and width of the zigzag line, and enable icons to indicate new trends and continuation patterns. Additionally, the bars can be colored based on the detected trend, aiding in quick visual analysis.
Conclusion
This port of the ZigZagHighLow study from NinjaScript to Pine Script preserves the essence of Sylvain Vervoort’s methodology while adding new features for support and resistance. It provides traders with a powerful tool for technical analysis. The combination of price changes and ATR ensures that you have a robust and adaptable tool for identifying key market movements and structural levels. Customize the settings to match your trading style and gain a clearer picture of market trends, turning points, and support/resistance areas. Enjoy improved market analysis and more informed trading decisions with the Sylvain Zig-Zag indicator.

All Chart Patterns [theEccentricTrader]█ OVERVIEW
This indicator automatically draws and sends alerts for all of the chart patterns in my public library as they occur. The patterns included are as follows:
• Ascending Broadening
• Broadening
• Descending Broadening
• Double Bottom
• Double Top
• Triple Bottom
• Triple Top
• Bearish Elliot Wave
• Bullish Elliot Wave
• Bearish Alternate Flag
• Bullish Alternate Flag
• Bearish Flag
• Bullish Flag
• Bearish Ascending Head and Shoulders
• Bullish Ascending Head and Shoulders
• Bearish Descending Head and Shoulders
• Bullish Descending Head and Shoulders
• Bearish Head and Shoulders
• Bullish Head and Shoulders
• Bearish Pennant
• Bullish Pennant
• Ascending Wedge
• Descending Wedge
• Wedge
█ CONCEPTS
Green and Red Candles
• A green candle is one that closes with a close price equal to or above the price it opened.
• A red candle is one that closes with a close price that is lower than the price it opened.
Swing Highs and Swing Lows
• A swing high is a green candle or series of consecutive green candles followed by a single red candle to complete the swing and form the peak.
• A swing low is a red candle or series of consecutive red candles followed by a single green candle to complete the swing and form the trough.
Peak and Trough Prices
• The peak price of a complete swing high is the high price of either the red candle that completes the swing high or the high price of the preceding green candle, depending on which is higher.
• The trough price of a complete swing low is the low price of either the green candle that completes the swing low or the low price of the preceding red candle, depending on which is lower.
Historic Peaks and Troughs
The current, or most recent, peak and trough occurrences are referred to as occurrence zero. Previous peak and trough occurrences are referred to as historic and ordered numerically from right to left, with the most recent historic peak and trough occurrences being occurrence one.
Upper Trends
• A return line uptrend is formed when the current peak price is higher than the preceding peak price.
• A downtrend is formed when the current peak price is lower than the preceding peak price.
• A double-top is formed when the current peak price is equal to the preceding peak price.
Lower Trends
• An uptrend is formed when the current trough price is higher than the preceding trough price.
• A return line downtrend is formed when the current trough price is lower than the preceding trough price.
• A double-bottom is formed when the current trough price is equal to the preceding trough price.
Range
The range is simply the difference between the current peak and current trough prices, generally expressed in terms of points or pips.
Retracement and Extension Ratios
Retracement and extension ratios are calculated by dividing the current range by the preceding range and multiplying the answer by 100. Retracement ratios are those that are equal to or below 100% of the preceding range and extension ratios are those that are above 100% of the preceding range.
Measurement Tolerances
Tolerance refers to the allowable variation or deviation from a specific value or dimension. It is the range within which a particular measurement is considered to be acceptable or accurate. I have applied this concept in my pattern detection logic and have set default tolerances where applicable, as perfect patterns are, needless to say, very rare.
Chart Patterns
Generally speaking price charts are nothing more than a series of swing highs and swing lows. When demand outweighs supply over a period of time prices swing higher and when supply outweighs demand over a period of time prices swing lower. These swing highs and swing lows can form patterns that offer insight into the prevailing supply and demand dynamics at play at the relevant moment in time.
‘Let us assume… that you the reader, are not a member of that mysterious inner circle known to the boardrooms as “the insiders”… But it is fairly certain that there are not nearly so many “insiders” as amateur trader supposes and… It is even more certain that insiders can be wrong… Any success they have, however, can be accomplished only by buying and selling… hey can do neither without altering the delicate poise of supply and demand that governs prices. Whatever they do is sooner or later reflected on the charts where you… can detect it. Or detect, at least, the way in which the supply-demand equation is being affected… So, you do not need to be an insider to ride with them frequently… prices move in trends. Some of those trends are straight, some are curved; some are brief and some are long and continued… produced in a series of action and reaction waves of great uniformity. Sooner or later, these trends change direction; they may reverse (as from up to down), or they may be interrupted by some sort of sideways movement and then, after a time, proceed again in their former direction… when a price trend is in the process of reversal… a characteristic area or pattern takes shape on the chart, which becomes recognisable as a reversal formation… Needless to say, the first and most important task of the technical chart analyst is to learn to know the important reversal formations and to judge what they may signify in terms of trading opportunities’ (Edwards & Magee, 1948).
This is as true today as it was when Edwards and Magee were writing in the first half of the last Century, study your patterns and make judgements for yourself about what their implications truly are on the markets and timeframes you are interested in trading.
Over the years, traders have come to discover a multitude of chart and candlestick patterns that are supposed to pertain information on future price movements. However, it is never so clear cut in practice and patterns that where once considered to be reversal patterns are now considered to be continuation patterns and vice versa. Bullish patterns can have bearish implications and bearish patterns can have bullish implications. As such, I would highly encourage you to do your own backtesting.
There is no denying that chart patterns exist, but their implications will vary from market to market and timeframe to timeframe. So it is down to you as an individual to study them and make decisions about how they may be used in a strategic sense.
█ INPUTS
• Change pattern and label colours
• Show or hide patterns individually
• Adjust pattern ratios and tolerances
• Set or remove alerts for individual patterns
█ NOTES
I have decided to rename some of my previously published patterns based on the way in which the pattern completes. If the pattern completes on a swing high then the pattern is considered bearish, if the pattern completes on a swing low then it is considered bullish. This may seem confusing but it makes sense when you come to backtesting the patterns and want to use the most recent peak or trough prices as stop losses. Patterns that can complete on both a swing high and swing low are for such reasons treated as neutral, namely all broadening and wedge variations. I trust that it is quite self-evident that double and triple bottom patterns are considered bullish while double and triple top patterns are considered bearish, so I did not feel the need to rename those.
The patterns that have been renamed and what they have been renamed to, are as follows:
• Ascending Elliot Waves to Bearish Elliot Waves
• Descending Elliot Waves to Bullish Elliot Waves
• Ascending Head and Shoulders to Bearish Ascending Head and Shoulders
• Descending Head and Shoulders to Bearish Descending Head and Shoulders
• Head and Shoulders to Bearish Head and Shoulders
• Ascending Inverse Head and Shoulders to Bullish Ascending Head and Shoulders
• Descending Inverse Head and Shoulders to Bullish Descending Head and Shoulders
• Inverse Head and Shoulders to Bullish Head and Shoulders
You can test the patterns with your own strategies manually by applying the indicator to your chart while in bar replay mode and playing through the history. You could also automate this process with PineScript by using the conditions from my swing and pattern libraries as entry conditions in the strategy tester or your own custom made strategy screener.
█ LIMITATIONS
All green and red candle calculations are based on differences between open and close prices, as such I have made no attempt to account for green candles that gap lower and close below the close price of the preceding candle, or red candles that gap higher and close above the close price of the preceding candle. This may cause some unexpected behaviour on some markets and timeframes. I can only recommend using 24-hour markets, if and where possible, as there are far fewer gaps and, generally, more data to work with.
█ SOURCES
Edwards, R., & Magee, J. (1948) Technical Analysis of Stock Trends (10th edn). Reprint, Boca Raton, Florida: Taylor and Francis Group, CRC Press: 2013.

Boost Candle Indicator by JulianThe Boost Candle Trading Indicator is designed to identify significant price movements by calculating the average candle size for the same direction candles (green for bullish and red for bearish) over a specified number of periods. It then highlights candles that exceed a predefined multiple of this average size, indicating potential strong buying or selling pressure.
Key Features:
Directional Average Calculation: Calculates the average size of the previous candles in the same direction (green for buy signals and red for sell signals), ensuring the boost signal is contextually relevant.
Boost Multiplier: Allows customization of the multiplier to define what constitutes a boost candle, providing flexibility in detecting varying levels of price movement intensity.
Proximity to Moving Average: Integrates a proximity check to the moving average (MA), ensuring that boost candles are identified in context with the overall market trend.
Buy and Sell Signals:
Buy Signal: Triggered when a significant green boost candle appears below the moving average and closes above it, indicating a strong bullish movement.
Sell Signal: Triggered when a significant red boost candle appears above the moving average and closes below it, indicating a strong bearish movement.
Customizable Inputs:
Moving Average Length: Adjust the length of the moving average to suit different trading strategies.
Number of Periods for Average Candle Size: Define the lookback period for calculating the average candle size.
Boost Multiplier and Proximity Tolerance: Fine-tune the sensitivity of the indicator to suit different market conditions.
How to Use:
Buy Signals: Look for green labels ("B") below significant bullish candles, indicating a potential upward price movement.
Sell Signals: Look for red labels ("S") above significant bearish candles, indicating a potential downward price movement.
Proximity to Moving Average: Use the proximity tolerance setting to filter out signals that are not closely aligned with the moving average trend.
This indicator is ideal for traders looking to identify strong market movements and align their trades with significant price actions. Customize the settings to fit your trading style and enhance your market analysis.

Parabolic SAR Waves [MMA]Parabolic SAR Waves
Description:
The "Parabolic SAR Waves " is an advanced version of the traditional Parabolic SAR indicator, customized for TradingView. This script incorporates dynamic acceleration factors and optional gradient coloration to enhance visual interpretation and utility for traders aiming to accurately capture trends and predict potential reversals.
Features:
- Dynamic Acceleration: Adjust the initial, incremental, and maximum values of the acceleration factor to suit various market conditions and trading preferences.
- Gradient Coloring: Use gradient colors to indicate the strength and stability of the trend, providing visual cues that are easy to interpret.
- Trend Visibility: The SAR dots are plotted directly on the price chart, making it easy to spot trend changes and maintain situational awareness.
- Overlay Feature: Designed to overlay directly on the price charts, allowing for seamless integration with other technical analysis tools.
Benefits:
- Trend Detection: Helps in identifying the beginning and potential reversal of trends, aiding in timely decision-making.
- Stop-Loss Management: Utilizes the positions of the SAR dots as dynamic stop-loss points, which helps in risk management.
- Visual Simplicity: Enhances the decision-making process through a straightforward visual representation of trend data.
Parameters:
- Acceleration Start (accel_start): The initial value for the acceleration, set to 0.02 by default.
- Acceleration Increment (accel_inc): The amount by which the acceleration increases, set to 0.005 by default.
- Acceleration Maximum (accel_max): The maximum limit of the acceleration factor, set to 0.1 by default.
- Use Gradient Colors (use_gradient): A boolean toggle to enable or disable gradient coloring, enabled by default.
Indicator Usage:
1. To apply, select this indicator from TradingView's indicator library.
2. Adjust the acceleration parameters based on your specific trading strategy and market analysis.
3. Interpret the indicator signals:
- Green SAR dots below the price bars indicate a bullish trend.
- Red SAR dots above the price bars signify a bearish trend.
- Gradient colors, if enabled, provide insights into the acceleration factor's intensity relative to trend strength.
Alerts:
- Bullish Reversal Alert: Issues a notification if there is a potential upward reversal when the trend shifts to bullish.
- Bearish Reversal Alert: Alerts when there's potential for a downward move as the trend turns bearish.
The "Parabolic SAR Waves " is a robust tool, ideal for traders who need precise, customizable trend-following capabilities that integrate seamlessly with other market analysis strategies. Enhance your trading with detailed trend insights and adaptive parameter controls.