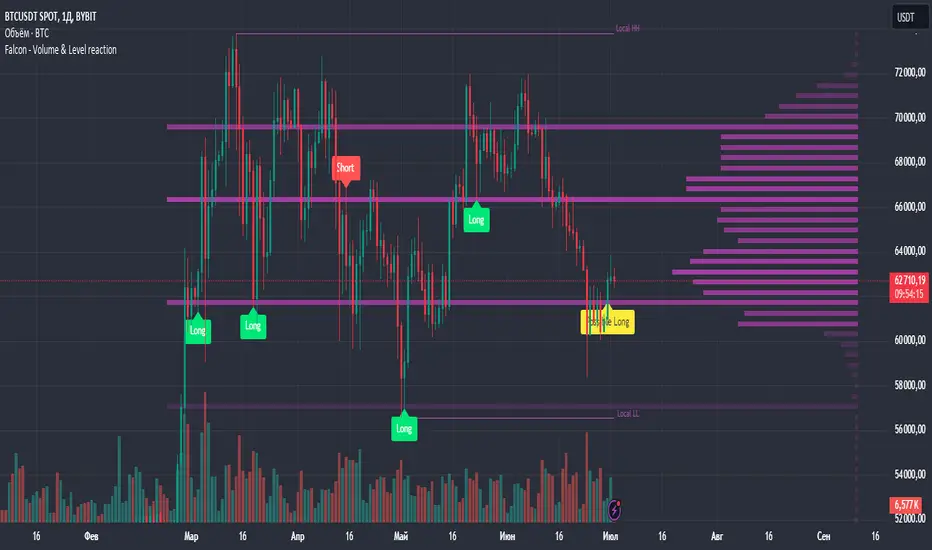
Falcon - Volume & Level reaction Falcon - Volume & Level Reaction
Our indicator, Falcon - Volume & Level Reaction, is designed to provide traders with comprehensive insights into price behavior through the calculation of horizontal volume profiles. By analyzing these profiles, the indicator identifies key levels and assesses price reactions, offering valuable trading signals.
---
# Concept
The Falcon - Volume & Level Reaction indicator is built to help traders identify and capitalize on key market levels by analyzing volume profiles and price behavior. This indicator enhances trading strategies by providing clear signals based on robust analysis, allowing traders to make informed decisions and improve their trading outcomes.
---
# Functions
1. Volume Profile Calculation
- Profile Period: Calculates horizontal volume profiles over a specified number of bars.
- Peak Volumes: Identifies peak volume levels based on the sensitivity parameter.
2. Price Behavior Analysis
- Primary Check: Determines if bars close above or below the peak level.
- Secondary Checks:
- Volume Decrease: Confirms a decrease in volume after the price touches the level.
- Volatility Check: Ensures bars do not exceed the average ATR range.
3. Signal Generation
- Combined Signals: The primary check generates initial long/short signals, while secondary checks strengthen these signals.
- Real-time Alerts: Provides "Potential" short or long signals based on the current candle's closure relative to the level.
4. Comprehensive Analysis: Helps identify multiple factors that validate level protection and potential price reversals.
---
# Description of Checks
1. Primary Check: Price Closure
- This check assesses whether the bars close above or below the identified peak volume levels. If the price closes above the level, it generates a long signal; if it closes below, it generates a short signal. This check is fundamental as it directly indicates the price's interaction with significant volume levels.
2. Secondary Check 1: Volume Decrease
- After the price touches a peak volume level, this check verifies if there is a subsequent decrease in trading volume. A decrease in volume after touching the level suggests reduced market interest at that price, which can indicate potential reversals or continuations based on the overall market context.
3. Secondary Check 2: Volatility Check
- This check ensures that the price bars do not exceed the average ATR range after touching the peak volume level. Lower volatility near key levels indicates stability and strengthens the signal generated by the primary check, confirming the market's reaction to these levels.
---
# How to Use the Indicator
1. Set Parameters: Define volume profile parameters such as profile period, number of peaks, and level sensitivity.
2. Analyze the Chart: Observe the peak volume levels displayed on the chart.
3. Receive Signals: Follow the buy or sell signals that appear when the price touches the level and the primary and secondary checks are met.
4. Respond to Alerts: When a "Potential" long or short signal appears, evaluate the closure of the current candle relative to the level to make a trading decision.
Example of Work
- Setup:
- Result:
---
# Input Parameters
- Profile back: Defines the lookback period for volume profiles (10–500, step 1).
- Max Profile: Sets the maximum number of profiles (10–300, step 5).
- Profiles Length: Specifies the length of profiles (10–100, step 1).
- Profiles Offset: Determines the offset for profiles (0–100, step 1).
- Profiles Width: Sets the width of profiles (1–10).
- Profiles Color: Chooses the color for profiles.
- Lvls Color: Chooses the color for levels.
- Lvl's sensitivity: Adjusts the sensitivity of levels (1–10).
- tolerance: Sets the tolerance level (0.000–0.003, step 0.001).
- tolerance ATR: Defines the ATR tolerance (1.0–4.0).
---
Falcon - Volume & Level Reaction
Индикатор на основе горизонтальных объемов помогает трейдерам выявлять ключевые уровни объемной проторговки, предоставляя четкие сигналы для принятия торговых решений.
Функции
– Определение и отображение пиковых уровней объемной проторговки.
– Сигналы на покупку (Long) и продажу (Short) на основе поведения цены.
– Анализ объема торгов до и после касания уровня.
– Оценка волатильности цены в период консолидации.
– Автоматическая подстройка под выбранный таймфрейм.
– Отображение локальных максимумов и минимумов.
Настройки
– Количество баров назад VRVP: определяет период для расчета горизонтальных объемов.
– Множитель ATR: коэффициент для вычисления волатильности.
– Множитель погрешности: допустимая погрешность касания уровня.
– Период расчета ATR: количество баров для расчета среднего ATR.
– Отображение Local HH/LL: включение/выключение отображения локальных максимумов и минимумов.
Версии
Данный скрипт – упрощенная версия нашего индикатора с закрытым доступом. Открытая версия доступна для BTC и ETH, только на дневном таймфрейме, без возможности изменения параметров
Volume Profile
Volume Positive & Negative Levels [ChartPrime]Volume Positive & Negative Levels
Overview:
The Volume Positive & Negative Levels indicator by ChartPrime is designed to provide traders with a clear visualization of volume activity across different price levels. By plotting volume levels as histograms, this tool helps identify significant areas of buying (positive volume) and selling (negative volume) pressure, enhancing the ability to spot potential support and resistance zones.
Key Features:
⯁ Lookback Period:
- The `lookbackPeriod` parameter, set to 500 bars, determines the range over which the volume analysis is conducted, ensuring a comprehensive view of the market’s volume activity. The maximum lookback period is 500 bars or the bars currently visible on the chart, whichever is smaller.
⯁ Dynamic Volume Calculation:
- Volume is calculated dynamically based on the price action, with positive volume indicating buying pressure (close > open) and negative volume indicating selling pressure (close < open).
⯁ Color Coding for Clarity:
- Positive Volume: Represented with a distinct color (`#ad9a2c`), making it easy to identify areas of buying interest.
- Negative Volume: Highlighted with another color (`#ad2cad`), simplifying the detection of selling pressure.
Volume Threshold and Bins:
- The indicator allows users to set a volume threshold (`volume_level`) to highlight significant volume levels, with the default set at 70.
- The number of bins (`numBins`) defines the granularity of the volume profile, with a higher number providing more detail.
⯁ Volume Profile Visualization:
- The volume profile is plotted as a histogram, with the height of each bar proportional to the volume at that price level. This visualization helps in quickly assessing the strength of volume at various price points.
⯁ Interactive Labels and Threshold Indicators:
- Labels: The indicator uses labels to mark significant volume levels, providing quick reference points for traders.
- Threshold Lines: Lines are drawn at specified volume thresholds, with colors and widths dynamically adjusted based on the volume levels.
⯁ User Inputs:
- Volume Threshold (`volume_level`): Sets the minimum volume required to highlight significant levels.
- Number of Bins (`numBins`): Determines the resolution of the volume profile.
- Line Width (`line_withd`): Specifies the width of the lines used in the visualization.
The Volume Positive & Negative Levels indicator is a powerful tool for traders looking to gain deeper insights into market dynamics. By providing a clear visual representation of volume activity across different price levels, it helps traders identify key support and resistance zones, spot trends, and make more informed trading decisions. Whether you are a day trader or a swing trader, this indicator enhances your ability to analyze volume data effectively, improving your overall trading strategy.

Volume Profile [projeadam]Volume Profile Indicator
OVERVIEW
The "Volume Profile " indicator is designed to analyze and visualize the volume distribution within a specified number of past bars on the TradingView platform. This tool helps traders to identify key levels of volume activity, which can indicate significant support and resistance zones.
USER GUIDE
The primary purpose of this indicator is to provide a detailed volume profile over a specified range of bars. It highlights areas of high and low trading activity, enabling traders to make more informed decisions based on historical volume data.
SETTINGS PANEL
🌟 Indicator Settings 🌟
1. Back Bars Value :
o Description: Sets the number of past bars to be considered for volume profile calculation.
o Default Value: 43
o Range: 1 to 500
2. Value Area Volume %:
o Description: Specifies the percentage of total volume to be included in the value area.
o Default Value: 50%
o Range: 1% to 100%
🪐 Histogram Settings 🪐
1. Show Histogram:
o Description: Toggles the display of the volume histogram on the chart.
o Default: Enabled
2. Right Or Left Side Histogram:
o Description: Allows the user to choose the position of the histogram on the chart (right or left side).
o Default: Left Side
3. Number of Histogram Branches:
o Description: Sets the number of segments or branches in the histogram.
o Default Value: 50
4. Value Area BUY Color:
o Description: Sets the color for the histogram bars indicating buying volume areas.
o Default: Green (#73ff21 with 15% opacity)
5. Value Area SELL Color:
o Description: Sets the color for the histogram bars indicating selling volume areas.
o Default: Red (#ff2828 with 15% opacity)
🎯 Lines Settings 🎯
1. Show Lines:
o Description: Toggles the display of horizontal lines representing key volume levels.
o Default: Enabled
2. Show Labels:
o Description: Toggles the display of labels for the horizontal lines.
o Default: Enabled
3. High Level Line:
o Show Line: Enables the high volume level line.
o Line Style: Options for solid, dotted, or dashed lines.
o Line Width: Adjustable from 1 to 5.
o Line Color: Customizable color for the high level line.
4. Middle Level Line (POC Line):
o Show Line: Enables the Point of Control (POC) line.
o Line Style: Options for solid, dotted, or dashed lines.
o Line Width: Adjustable from 1 to 5.
o Line Color: Customizable color for the POC line.
5. Low Level Line:
o Show Line: Enables the low volume level line.
o Line Style: Options for solid, dotted, or dashed lines.
o Line Width: Adjustable from 1 to 5.
o Line Color: Customizable color for the low level line.
Visualization
- Histogram Positioning: The histogram can be displayed on either the right or left side of the chart, providing flexibility based on user preference.
- Line and Label Customization: Users can customize the style, width, and color of the lines and labels to match their trading style and charting preferences.
ALARMS
This indicator can trigger alarms based on significant price movements relative to the identified volume levels:
- Break High Level: An alarm is triggered when the price crosses above the high volume level.
- Break Low Level: An alarm is triggered when the price crosses below the low volume level.
ALGORITHM
The indicator calculates the highest and lowest prices within the specified number of past bars and divides the price range into segments. It then allocates the volume within each segment, distinguishing between buying and selling volumes. The key volume levels (Point of Control, High Volume Node, and Low Volume Node) are identified and highlighted on the chart.
Example
In the example below, the histogram is displayed on the left side, showing higher buying volumes in green and selling volumes in red. The key volume levels are marked with horizontal lines and labels, providing clear visual cues for significant support and resistance zones.
BENEFITS
- Enhanced Market Insight: Provides a detailed view of volume distribution, highlighting key trading levels.
- Customizable Visualization: Flexible settings allow traders to customize the indicator to their needs.
- Alert Mechanism: Automated alarms keep traders informed of significant market movements in real-time.
ADDITIONAL FEATURES
If you have suggestions for additional features or improvements, please feel free to reach out.

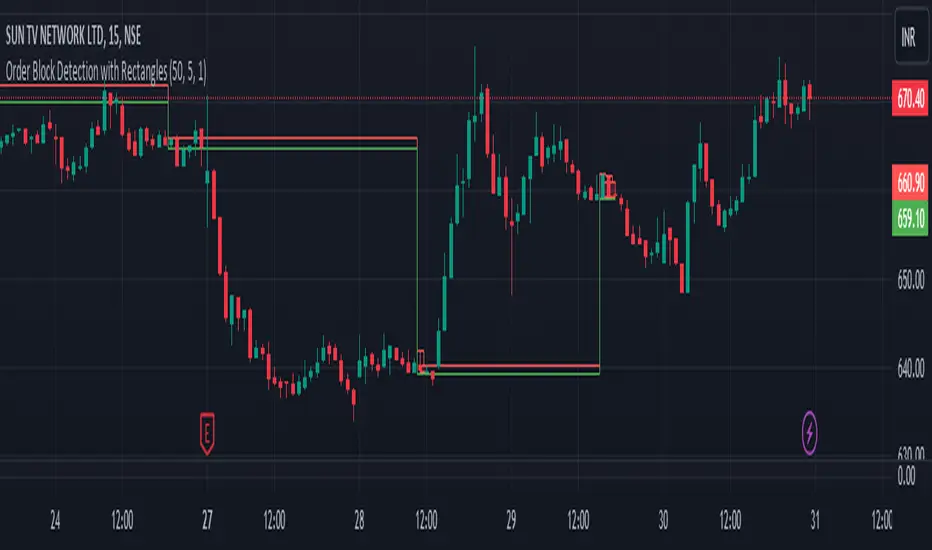
Order Block Detection By Zia (StockWiz)What is an Order Block?
An order block is a concept used in technical analysis, particularly in price action trading and supply and demand analysis. It refers to a significant area on a price chart where institutional traders, such as banks and hedge funds, have placed large orders. These blocks of orders often create strong support or resistance levels, as they represent areas where the "smart money" has shown interest in buying or selling an asset.
Characteristics of Order Blocks:
1. High Volume: Order blocks are typically associated with high trading volume, indicating strong participation from large players in the market.
2. Price Rejection: They often lead to sharp reversals or consolidations in price, as the large orders absorb the market's liquidity and push the price in the opposite direction.
3. Formation: Order blocks are usually formed after significant price movements, such as strong bullish or bearish trends, and can be identified by clusters of candles with long wicks or significant body sizes.
4. Support and Resistance: Once identified, order blocks can serve as potential support or resistance levels in future price movements. Prices often return to these areas, where new orders can be executed.
Identifying Order Blocks:
To identify order blocks, traders look for specific patterns and price actions on the chart. Here is a step-by-step guide to finding order blocks:
1. Identify a Strong Move: Look for strong bullish or bearish moves, which are often the result of large institutional orders.
2. Find Consolidation : After the strong move, find areas where the price consolidates. This is where large orders were likely placed.
3. Look for Rejections: Identify areas where the price has been rejected multiple times, creating a clear support or resistance zone.
4. Mark the Order Block: Draw a rectangle around the consolidation area to mark the order block on your chart.
Student of Parag Mehta (StockWiz)
With Regards
Zia Rahim
Auto Anchored Volume ProfileAuto Anchored Volume profile indicator to identify potential support and resistance zones, along with weak and strong Point of Control (POC) levels.
Understanding the Concepts:
Volume Profile: This chart depicts trading activity at various price levels over a chosen timeframe. Higher volume areas represent price levels where most buying and selling happened.
Point of Control (POC): The price level with the highest volume traded within the timeframe. It represents the price where most agreement existed between buyers and sellers.
High Volume Nodes (HVN): Areas on the volume profile with significantly higher volume compared to surrounding areas. These can indicate potential support or resistance.
Delta (Sentimental): This volume profile type shows the difference between buying and selling volume at each price level. Positive delta indicates buying dominance, while negative delta suggests selling pressure.
Strategy Breakdown:
Identify Volume Shelves:
Look for areas with concentrated volume on the profile. These areas, called shelves, can act as support (high volume at lower prices) or resistance (high volume at higher prices).
Analyze POC Strength (POC Volume Percentage):
Calculate the Volume Percentage: (Volume at Price Level / Maximum HVN Volume over the Period) * 100
This ratio indicates the significance of the POC relative to the strongest volume area.
A high percentage suggests a strong POC, potentially indicating a more reliable support or resistance level.
A low percentage suggests a weak POC, with a higher chance of price breaking through that level.
Leverage Previous Session Data:
The strategy incorporates data from the previous session's POC and Highest Delta Node. These are displayed on the right side of the chart, extending the volume profile for reference.
Identify if the current price is trading above or below the previous session's POC. This can provide context for potential price direction.
The Highest Delta Node from the previous session indicates areas of strong buying or selling sentiment that might carry over to the current session.
Additional Anchor Point Types:
Pivot Points and Fixed Range Volume Profile can be added for further confirmation of support and resistance zones.
Pivot points are calculated automatically based on the price changes direction
Fixed Range Volume Profile focuses on a specific price range, allowing detailed analysis within that zone.
Timeframe Considerations(AUTO):
The resolution for calculating pivot points is determined automatically:
- For intraday resolutions up to and including 15 minutes, the daily (1D) timeframe is used.
- For intraday resolutions more than 15 minutes, the weekly (1W) timeframe is used.
- For daily resolutions, the monthly (1M) timeframe is used.
- For weekly and monthly resolutions, the 12-month (12M) timeframe is used.
Trading with the Strategy:
Look for price approaching a volume shelf identified on the profile.
Analyze the POC Volume Percentage to gauge the strength of the POC as potential support or resistance.
Consider the previous session's POC and Highest Delta Node for additional context.
Combine volume profile insights with other technical indicators and price action confirmation for entry and exit signals.
Remember, strong POCs with high volume shelves suggest more reliable support/resistance, while weak POCs indicate a higher chance of price movement beyond that level.
Important Notes:
Volume profile is a tool to identify potential trading zones, not a guaranteed predictor of future price movements.
Always practice proper risk management techniques, including stop-loss orders.
Backtest this strategy on historical data to understand its effectiveness before risking real capital.
By understanding volume distribution and POC strength, this strategy can help you make informed trading decisions based on where most buying and selling activity has occurred. Remember, a comprehensive trading approach that considers multiple factors is crucial for success.

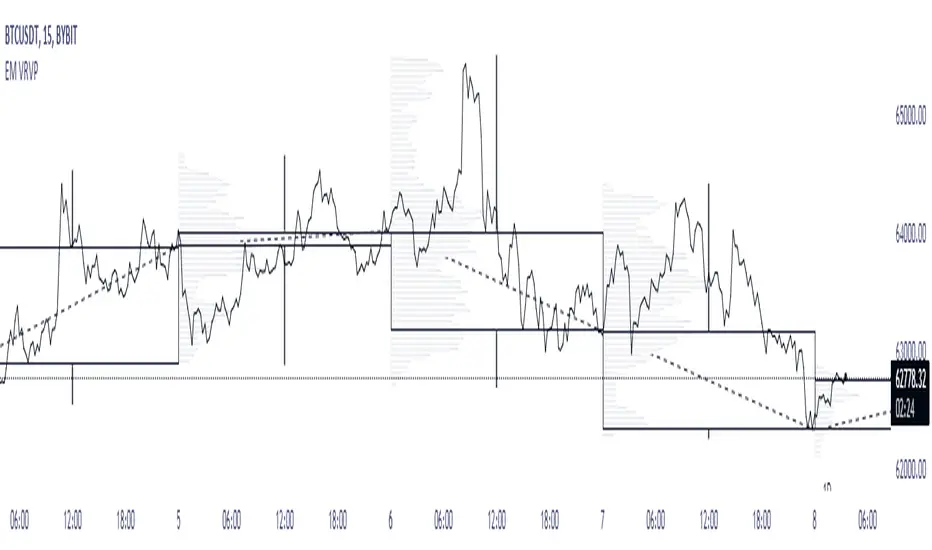
EM Visible Range Volume Profile█ OVERVIEW
ᴇᴍ VRVP (Visible Range Volume Profile) indicator calculates the volume profile within the visible range of prices.
Volume Profile is an advanced technical analysis indicator that shows trading activity over a specified period of time at certain price levels.
The indicator plots a histogram on the chart that reflects dominant or significant price levels based that are based on volume.
VP concept
VP Components
Open, High, Low, Close:
There are different types of volume profile indicators but the majority of them will designate the OHLC.
Point of Control:
A price level with the most traded volume during one session, also known as POC.
High Volume Node (HVN):
Area of high volume relative to surrounding price action.
Low Volume Node (LVN):
Area of low volume relative to surrounding price action.
Analysis of price in relation to high and low volume nodes is useful when building context around your trades.
█ VOLUME PROFILE STRATEGIES
The distribution of a volume profile can help you determine the strength of a trend and spot potential reversal zones. Let’s take a look at the five different distribution types.
Neutral D
In order for price to break away from value, either the buyers or the sellers will have to become more aggressive than the other side. When this occurs, it gives us with a vital piece of information.
Now we know who were the agressors at this price level: either the buyers or the sellers. That's why this is a good level for a trading setup if the price bounces back.
Bearish P and Bullish P
Bearish P — reversal. Bullish P — confirmation.
Bearish Ь and Bullish Ь
Bearish Ь — confirmation. Bullish Ь — reversal.
Examples
█ INPUTS
Width — amplitude of the VP histogram.
Grid — the number of columns of the VP histogram.
Delta of volumes — combinatorial determination of the ratios of sellers and buyers.
In quoted units — conversion in units of quoted currency.
Logarithmic scale — recalculation the grid step to the logarithmic scale of the chart.
HTF — (Higher Timeframe) calculation of VP for the period of the selected timeframe. ISO: Isolated computation in HTF period.
Palette: Total volume, Volume of buyers, Volume of sellers, HTF bars.
Warnings: colour of the «⚠» icon, language of information in the Tooltip.
Addition: ᴇᴍ CHN-RMA — a grid of moving averages with periods of centered hexagonal numbers.
█ ОБЩИЕ СВЕДЕНИЯ
ᴇᴍ VRVP (Visible Range Volume Profile) рассчитывает профиль объёма в видимом диапазоне цен.
Профиль объёма — это продвинутый индикатор технического анализа, который показывает торговую активность за условленный период времени на определённых ценовых уровнях.
Индикатор строит на графике гистограмму, отражающую доминирующие или значимые ценовые уровни, основанные на объёме.
█ НАСТРОЙКИ
Ширина — амплитуда гистограммы VP.
Сетка — количество колонок гистограммы VP.
Дельта объёмов — комбинаторное определение соотношений продаж и покупок.
В котируемых единицах — пересчёт в единицах котируемой валюты.
Логарифмическая шкала — пересчёт шага сетки на логарифмическую шкалу графика.
HTF — (Higher Timeframe) расчёт VP за период выбранного таймфрейма. ISO: Изолированное вычисление в HTF-периоде.
Палитра: Суммарный объём, Объём покупок, Объём продаж, Бары HTF.
Предупреждения: цвет значка «⚠», язык информации в Tooltip.
Дополнение: ᴇᴍ CHN-RMA — сетка скользящих средних с периодами центрированных гексагональных чисел.
Previous Day and Week RangesI've designed the "Previous Day and Week Ranges" indicator to enhance your trading strategy by clearly displaying daily and weekly price levels. This tool shows Open-Close and High-Low ranges for both daily and weekly timeframes directly on your trading chart.
Key Features :
Potential Support and Resistance: The indicator highlights previous day and week ranges that may serve as key support or resistance levels in subsequent trading sessions.
Customizable Display Options: Offers the flexibility to show or hide daily and weekly ranges based on your trading needs.
Color Customization: Adjust the color settings to differentiate between upward and downward movements, enhancing visual clarity and chart readability.
This indicator is ideal for traders aiming to understand market dynamics better, offering insights into potential pivot points and zones of price stability or volatility.

Fixed volume profile & zonesHi all!
If you like volume profile and like to create zones, where the price might react, this indicator might be for you. It plots a fixed volume profile and creates a user defined number of zones (shelves) of high volume.
If you want to know more about volume profile you can about it here on TradingView: se.tradingview.com
To do
• Add possiblity to create alerts for zone entries, breakouts and retest
• The importance of zones are now based on high volume slots only. It might be changed to include the slots around the 'master slot' to determine if the area is of high importance or not, your suggestions here are welcome!
• Show total volume in 'values'
• Error if the data cannot be fetched
• Add value area
• Make earlier (more important shelves) more visible (less transparent)
• Add possiblity to skip zones
Known issues
• Script execution is long when the volume profile is created (should be none)
• In some cases you can get overlapping shelves, avoid this
Settings
• Main
• Start/end bar of the volume profile (this is required)
• Data
• Timeframe (for getting the volume data)
• Levels (the number of slots in the volume profile)
• Shelves (the number of zones with high volume to plot) and it's color
• Max slot (have this enabled if you want the shelf's highest volume slot to have a dotted line and choose it's color
• Show info (show the order of the plotted zone)
• Style (how the volume profile will look)
• Histogram box (the color of the background of the volume profile)
• Up (the color of bullish volume)
• Down (the color of bearish volume)
• Point of control (color and if it should be extended or not)
• Values and text color (show bullish and bearish volume values)
The defaults on all settings are based on the daily timeframe. This indicator is not 'complete' and I plan to work on it when I get the time.
Note that the precision for the volume profile is per candle, so some levels can have visuals as others but lower volume.
The slot (level) volume has to have a lower difference to the volume included in the shelf than the next volume to be checked to be included. If the level being checked for inclusion in a shelf is at the end of boundaries (high and low) of the volume profile, the volume has to be higher than the golden ratio of the volume before.
You can also use this indicator if you just want a volume profile to show, just set the the number of zones to plot (in 'Shelves') to 0.
I hope I haven't forgotten anything and that it's clear, let me know otherwise.
Best of trading luck!

Money Flow Profile [LuxAlgo]The Money Flow Profile is a charting tool that measures the traded volume or the money flow at all price levels on the market over a specified time period and highlights the relationship between the price of a given asset and the willingness of traders to either buy or sell it, allowing traders to reveal dominant and/or significant price levels and to analyze the trading activity of a particular user-selected range.
This tool combines a volume/money flow profile, a sentiment profile, and price levels, where the right side of the profile highlights the distribution of the traded activity/money flow at different price levels, the left side of the profile highlights the market sentiment at those price levels, and in the middle the price levels.
🔶 USAGE
A volume/money flow profile is an advanced charting tool that displays the traded volume/money flow at different price levels over a specific period. It helps traders visualize where the majority of trading activity/money flow has occurred.
A sentiment profile is a difference between buy and sell volume/money flow aiming to highlight the sentiment/dominance at specific price levels.
Each row of the profile presents figures on volume and money flow specific to price levels.
High volume/money flow nodes indicate areas of high activity and are likely to act as support or resistance in the future. They attract price and try to hold it there. Conversely, low-volume nodes are areas with low trading activity, that are less subject to get revisited by the price. The market often bounces right over these levels, not staying for long. The "Profile Heatmap" option of the script helps to better emphasize the trading activity within each areas.
By measuring the traded activity at each price level the script presents an ability to highlight the consolidation zones, in other words, highlights accumulation and distribution zones. When the price moves toward one end of the consolidation and volume pick up, it can foreshadow a potential breakout.
Level of Significance, Point of Control, Highest Sentiment Zone, and Profile Price levels are some of the other profile-related options available with the script.
🔶 SETTINGS
The script takes into account user-defined parameters and plots the profiles, where detailed usage for each user-defined input parameter in indicator settings is provided with the related input's tooltip.
🔹 Profile Generic Settings
Lookback Length / Fixed Range: Sets the lookback length.
Profile Source: Sets the profile source, Volume, or Money Flow.
🔹 Profile Presentation Settings
Volume/Money Flow Profile: Toggles the visibility of the Volume/Money Flow Profile.
High Traded Nodes: Threshold and Color option for high traded nodes.
Average Traded Nodes: Color option for average traded nodes.
Low Traded Nodes: Threshold and Color option for low traded nodes.
🔹 Sentiment Profile Settings
Sentiment Profile: Toggles the visibility of the Sentiment Profile.
Sentiment Polarity Method: Sets the method used to calculate the up/down volume/money flow.
Bullish Nodes: Color option for Bullish Nodes.
Bearish Nodes: Color option for Bearish Nodes.
🔹 Profile Heatmap Settings
Profile Heatmap: Toggles the visibility of the profile heatmap.
Heatmap Source: Sets the source of the profile heatmap, Volume/Money Flow Profile, or Sentiment Profile.
Heatmap Transparency: Control the transparency of the profile heatmap.
🔹 Other Presentation Settings
Level of Significance: Toggles the visibility of the level of significance line/zone.
Consolidation Zones: Toggles the visibility of the consolidation zones.
Consolidation Threshold, Color: Sets the threshold value and zone color.
Highest Sentiment Zone: Toggles the visibility of the highest bullish or bearish sentiment zone.
Profile Price Levels, Color, Size: Toggles the visibility of the profile price levels, and sets the color and the size of the level labels.
Profile Range Background Fill: Toggles the visibility of the profiles range.
🔹 Other Settings
Number of Rows: Specify how many rows each profile histogram will have.
Profile Width %: Alters the width of the rows in the histogram, relative to the profile length
Profile Text Size: Alters the size of the text. Setting to Auto will keep the text within the box limits.
Profile Horizontal Offset: Enables to move profile in the horizontal axis.
🔶 RELATED SCRIPTS
Liquidity-Sentiment-Profile
Swing-Volume-Profiles
For more and other conceptual scripts you are kindly invited to visit LuxAlgo-Scripts .

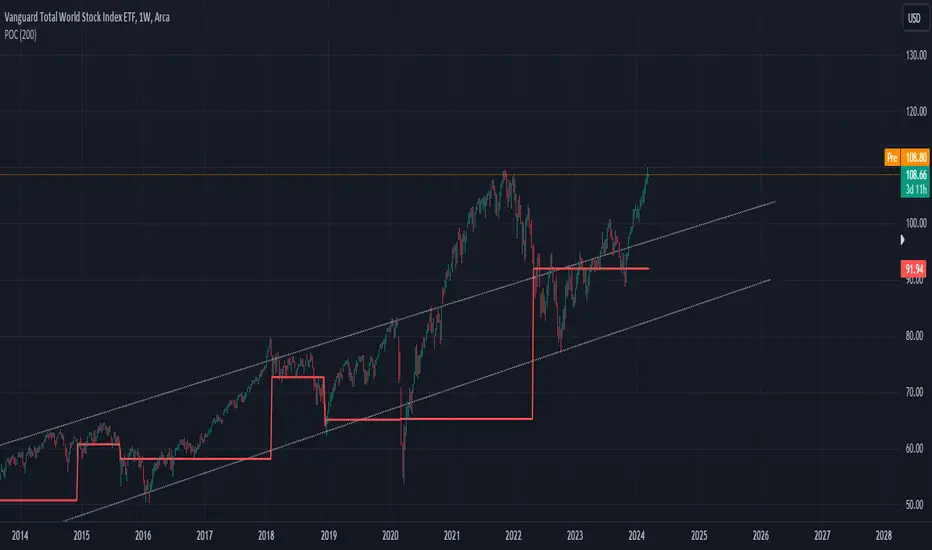
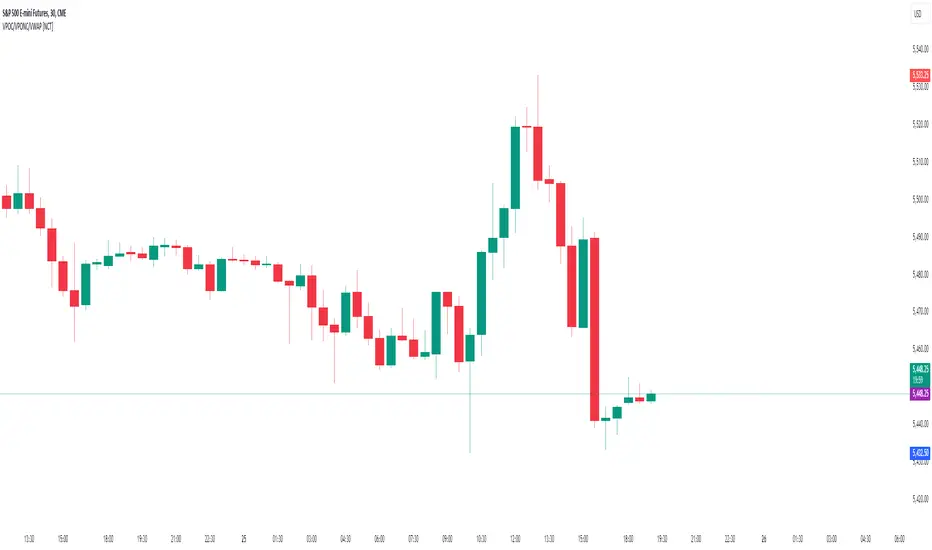
POC IndicatorThis simplified Point of Control (POC) indicator for TradingView is designed to identify and plot the price level where the highest volume of trading occurred over a specified period. The script works as follows:
Input and Initialization: The user specifies a length for the analysis period. Variables highestVolPrice and highestVol are initialized to track the price with the highest volume and the highest volume encountered, respectively.
Volume Analysis Loop: For each bar in the specified period (up to length bars back from the current bar), the script compares the volume of the current bar (volume ) to highestVol. If the current bar's volume is higher, highestVol and highestVolPrice are updated to reflect the volume and closing price of the current bar.
Plotting the POC: Instead of using a horizontal line (hline), which cannot be dynamically updated within the loop, the script uses plot to draw the POC. This plotting function draws a line on the chart that represents the closing price level associated with the highest volume observed within the analysis period.
Resetting Variables: To ensure the indicator updates correctly with each new bar, the script resets highestVol and highestVolPrice at the start of the analysis for each new period. This step is designed to recalculate the POC dynamically as new data comes in.
This approach offers a basic method for visualizing significant price levels where substantial trading activity occurred, potentially indicating areas of strong support or resistance. However, it's a simplified model and does not calculate the true POC based on a detailed volume profile across all price levels within the period.
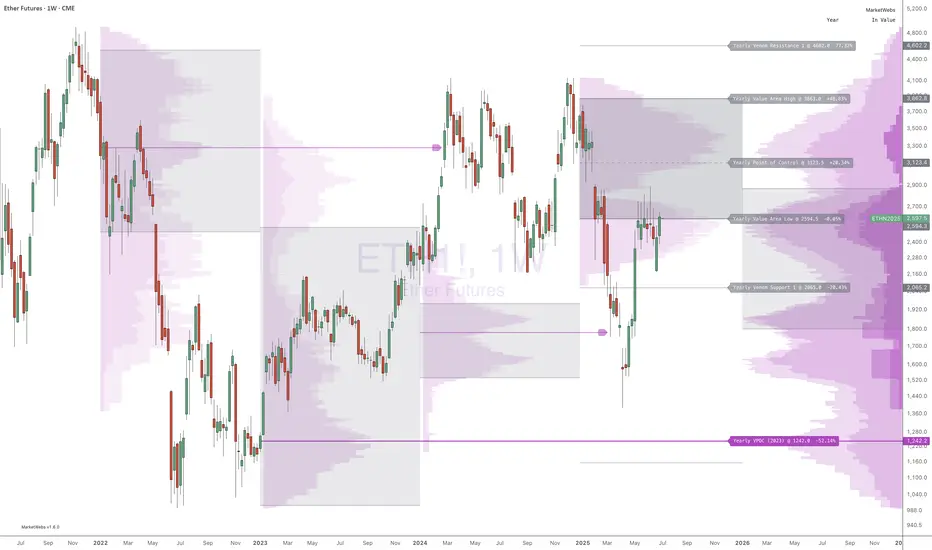
MarketWebsWhat are the MarketWebs?
A technical system based on Auction Market Theory and Market Profiles using Volume, Time, and Price to determine a Technical Roadmap outlining significant support & resistance across Equities, Futures, Cryptos and Forex.
Volume at price (Market Profile) is a powerful way to look at the market. By comparing current price action to the action occurring during previous periods, we can more clearly see the strength or weakness in the current market. Marking and tracking previous periods also allow the trader to identify price levels the market “remembers”.
Uniquely, this script automatically identifies and labels:
Virgin Points of Control (VPOCs) derived from price action leaving behind overhead supply (or underneath demand). VPOCs help determine pivot / stabilization points and often act as magnets when the market is trending.
Price breakouts across multiple time frames based on Auction Market Theory.
Bullish or bearish 80% rules as price enters value. This rule is triggered when: the Value Area has not been fully explored, price has been trading outside of value, and price breaks into value.
Venom Lines which are pivot lines of support and resistance derived from the period’s value area.
When high volatility is expected after a price auction period of significantly suppressed volatility.
What do they show?
1) Value Areas
The MarketWebs calculate precise Value Areas based on the market profile built from the amount of volume traded and time spent at all price levels across a period and then shift them forward for reference in the next period. As a technique developed in the 1980’s OEX trading pit using the previous day’s price action for reference today, this script extrapolates that concept into daily, weekly, monthly, and yearly value areas to compare the current price action to.
This script automatically draws the value areas across multiple time frames, calculating the value areas for the applicable periods: Daily, Weekly, Monthly, and Yearly.
For instance, the Monthly Value Area is based on the previous trading month. When the market is “below value” the trend is weak and price is in an auction market looking to establish a new “value”. The same is true above value, the market is strong. Inside of value however, the market is ranging instead of trending.
By applying multiple copies of the script to the chart, it is possible to show multiple time frame value areas on the same chart.
2) VPOCs
Within every value area there is a price level at which the most activity occurred. This is called the “Point of Control” (POC). It is our belief that the POC inside of the value area doesn’t hold much significance for trading; however – when the market has moved into a new value area period, and the previous POC has been left “un-tested” it becomes a “Virgin Point of Control” (VPOC).
VPOCs are extremely significant levels to the market. As price moves away from them over time the market has a memory for these levels that it will not forget. When the market finally starts to trend towards a VPOC (for example, price is above value for the period, and there is a VPOC above) the level will act as a magnet, pulling the market towards it. More often than not, once the market “tags” this level, it will reverse (note: in strong volume moves or extreme price shocks, it may bust through multiple VPOCs before reversing direction)
3) 80% Rule
Another trading rule from the pit traders, the 80% rule states that if price has been trading outside of the previous value area before that value area has been fully explored, and price then breaks into value, there is an 80% chance that price will continue to the other side of value. This works in both directions, bullish and bearish. This script will highlight when the market has triggered an 80% Rule.
4) Venom Lines
Venom lines are pivot levels of support and resistance based on the calculated value areas. These are reference levels for how extreme the market’s move away from value is in the current period and often mark significant but somewhat weak levels of support and resistance. They are especially useful identifying price targets for stocks making new all time highs.
5) Expected High Volatility
Many traders monitor when price has been consolidating (with low volatility) for an extended period of time. This kind of price action makes abnormally “skinny” Value Areas which indicate that the market is primed for a large move (in any direction) during the following period. This script identifies periods of high volatility expected both in the current period or in the next period as its value area is established.
Setup and Preferences:
Be sure to have your TradingView charts set to “Scale price chart only,” otherwise the chart will try to fit all of the VPOCs and Venoms in your field of view when only the closest levels to current price action are really important.
* Be sure to read through any release notes as they may contain updates to the options depicted.
Price Range Volume Profile++ [Pt]█ Introduction
The Price Range Volume Profile++ (PRVP++) is an advanced, feature-rich indicator specifically designed for volume profile users for in-depth volume analysis. Unlike most other volume profile tools that are limited to a 5000-bar lookback, PRVP++ can utilize all available candles on the chart, offering an unparalleled scope of historical data analysis.
█ Main Features
Full Chart Historical Lookback : PRVP++ sets a new standard with its ability to analyze the entire history of candles available on a chart, far exceeding the typical 5000-bar limit of other tools. This feature allows traders to conduct a comprehensive and detailed study of volume data over extensive time periods.
Volume Profile Analysis : The tool provides an in-depth volume profile analysis, showcasing the distribution of trading activity across different price levels. This is crucial for identifying key areas of interest in the market.
Bull/Bear Strength Profile : A standout feature that displays the relative strength of buyers (bulls) and sellers (bears) at different price levels. This visual representation helps traders gauge market sentiment and power dynamics.
Automatic HVN and LVN Identification : PRVP++ automatically highlights High Volume Nodes (HVNs) and Low Volume Nodes (LVNs), making it easier for traders to identify significant zones of trading activity and potential breakout areas.
Customization and Visual Enhancements : Offers customization for the profile's width, horizontal offset, and a sophisticated gradient color scheme for HVNs and LVNs, enhancing the tool's visual appeal and analytical utility.
█ Input Parameters
Price Range : Sets the percentage distance for the volume profile relative to the current closing price, determining the extent of volume data analysis.
Profile Step Size (Tick Size) : Users can choose automatic sizing or set a specific tick step size, offering flexibility in the granularity of the volume profile.
Volume Profile Options : Includes settings for gradient power and color selections for high and low volume areas, along with a fun mode for random color variations.
Profile Placement and Appearance : Adjustments for profile width, horizontal offset, and the option for background fill to enhance visibility.
Background Fill : Allows users to fill the background of the volume profile range, enhancing the visual impact and readability.
Time Weighted Profile : An option that weights the volume profile to give more emphasis to recent trading activities, highlighting the impact of recent market movements.
Smooth Filter : A feature that smoothens the volume profile to reduce noise and fluctuations, offering a clearer view of dominant volume levels.
High and Low Volume Node Settings : Customizable detection settings for HVNs and LVNs, line styles, label text sizes, and the option to extend lines for clearer market analysis.
Extra Settings : Includes displaying the current price on the profile, a customizable settings table with adjustable location and font size, and table opacity.
Random Color Generation : A feature for dynamically changing the colors used in the volume profile.
█ Possible Use Cases
Long-Term Market Analysis : Due to its ability to analyze all available candles on the chart, PRVP++ is exceptionally suited for long-term market analysis. Traders can study the historical volume profile over extended periods, identifying significant volume trends and shifts that could impact long-term investment strategies.
Identifying Key Support and Resistance Levels : The automatic HVN and LVN identification feature of PRVP++ makes it easier for traders to spot potential support and resistance levels. HVNs often correspond to strong support or resistance zones where significant trading activity has occurred, while LVNs may indicate levels where the price could break through more easily.
Gauging Market Sentiment with Bull/Bear Strength Profile : The Bull/Bear Strength Profile helps traders understand the prevailing market sentiment at different price levels. By analyzing the dominance of buying or selling pressure, traders can align their trades with the market's direction or prepare for potential reversals.
Intraday Trading and Scalping : For intraday traders and scalpers, the time-weighted feature and the ability to adjust profile step size offer valuable insights. By emphasizing recent trading activity and adjusting the granularity of the profile, traders can make more informed decisions based on short-term price movements and volume changes.
Breakout Trading : By utilizing the LVN identification, traders can pinpoint areas with low trading activity that might serve as potential breakout points. This information can be instrumental in formulating strategies to capitalize on sudden price movements.
Volume Gap Analysis : PRVP++ can be used to identify volume gaps, which are areas with significantly low volume. These gaps can act as important indicators for price movements, as prices may move quickly through these levels due to the lack of historical trading activity.
Risk Management and Position Sizing : Understanding the volume profile can aid in better risk management and position sizing. By recognizing areas of high and low volume, traders can set stop-loss orders more effectively and adjust their position sizes according to the perceived strength of support or resistance levels.
Swing Trading : For swing traders, the comprehensive historical lookback and HVN/LVN analysis provide critical information about where to enter and exit trades. Swing traders can utilize these features to identify trend reversals and momentum shifts.
█ Best Practices and Tips
Start with a Clear Understanding : Before utilizing PRVP++, ensure you have a solid grasp of volume profile concepts. Understanding High Volume Nodes (HVNs), Low Volume Nodes (LVNs), and their implications on market behavior is crucial.
Combine with Other Analysis Tools : While PRVP++ is powerful, it's most effective when used in conjunction with other technical analysis tools and indicators. Combining volume profile data with price action analysis, trend lines, and technical indicators can provide a more comprehensive market view.
Customize According to Your Trading Style : Tailor the tool's settings to fit your trading strategy. Day traders might prefer a more detailed profile, while long-term investors may benefit from broader data analysis.
Pay Attention to HVNs and LVNs : HVNs can indicate potential support or resistance areas, while LVNs might suggest breakout points. Monitor these areas closely for trading opportunities.
Utilize the Full Historical Lookback Feature : For a broader perspective, use the full historical lookback feature to understand long-term volume patterns and their impact on current price movements.
Keep an Eye on Bull/Bear Strength : Use the Bull/Bear Strength Profile to gauge market sentiment at different price levels. This can help in predicting potential price movements.
Regularly Update Your Strategy : As market conditions change, regularly review and adjust your use of PRVP++ to ensure it aligns with current market dynamics.
Stay Informed About Market News : Be aware of how economic news and global events might affect the volume and price, as these factors can significantly impact the effectiveness of volume-based strategies.
█ Disclaimers and Risk Advice
No Guarantee of Profits : Trading involves risk, and the use of the PRVP++ tool does not guarantee profits. Always be aware of the potential for loss.
Educational Purposes Only : The information provided by PRVP++ is for educational purposes only and should not be considered financial advice.
Not a Standalone Tool : PRVP++ should not be used as a standalone decision-making tool. Combine it with comprehensive market analysis and personal judgment.
Past Performance Not Indicative of Future Results [/b: Historical data and trends analyzed by PRVP++ do not guarantee future market behavior.
Use Risk Management : Always employ sound risk management strategies, including setting stop-loss orders and managing position sizes to protect your capital.
Personal Responsibility : Trading decisions remain the responsibility of the individual trader. Use PRVP++ as one of several tools in your decision-making process.

Periodic Volume Profile++ [Pt]█ Introduction
The Advanced Pro ++ Version of the Periodic Volume Profile is an advanced TradingView indicator, designed for traders focusing on volume-driven strategies. It provides detailed volume distribution and key levels over selected periods with extensive customization options.
█ Features Overview
Highly customizable and versatile, this tool is essential for a trader's toolkit, offering a variety of settings to suit specific trading needs.
█ Volume Profile
Display Modes: Four options - Off, Total, Up/Down, Gradient.
POC Highlighting: Option to highlight the Point of Control (POC) VP histogram bar.
VP Bar Size Control: Customize the number of ticks per VP bar, including a 'use min tick' option.
Volume Display: Show volume figures on the profile.
Developing VP Color Theme: Different color themes for developing VP.
█ Point of Control (POC)
Historical POCs: Display POCs from a specified number of past periods.
POC Levels: Auto-drawn levels indicating price, period, timeframe, and volume.
Color Customization: Separate color options for closest POCs, older POCs, and NPOCs (Naked POCs).
Closest Historical POC Display: Show nearest historical POC within a customizable range.
Low Volume POC Fading: Fade out low volume POC lines.
█ Value Area and Background Color
Display Options: Off, Custom Color, or Color based on Period Close vs. Open.
Customizable Colors: Tailor the color scheme as per preference.
Value Area High/Low Prices: Display options for VAH and/or VAL.
█ Extra Options
Periodic Candle Bar Display: Show candle bar for each period with customizable colors.
Previous POC, VAH, VAL Display: Display these levels in dashed lines.
The Advanced Pro ++ Volume Profile indicator is a top choice for traders seeking in-depth analysis of volume patterns and market structure, offering unparalleled customization and precision.

Frankie Candles Essentials [LuxAlgo]The Frankie Candles Essentials toolkit is a collection of essential features used by trader Frankie Candles. This toolkit focuses on the relationship between MTF oscillator divergences and volume profiles, allowing the detection of different kinds of reversals. Retracements from the "Golden Pocket" features are also included.
🔶 USAGE
When adding the script to your chart you will be prompted to select the calculation interval of the "Top-Down Volume Profile", simply click on your chart where you want the starting and ending points of the calculation interval.
🔹 Top-Down Volume Profile
The Top-Down Volume Profile is a classical fixed-range volume profile and highlights the amount of traded volume within equidistant price areas. The amount of areas is determined by the "Rows" setting (Note that the volume profile can use up to 250 rows).
The value area (VA) highlights the area where the specified percentage of the total volume is traded, that is the area with the most recorded trading activity relative to a selected percentage.
Finally, the point of control (POC) highlights the price level with the most trading activity.
🔹 Divergences
Users can highlight divergences made by oscillators on their charts. The toolkit includes three indicators such as RSI, MFI, and WaveTrend with MTF support, users can also select external oscillators but these will not support MTF divergence detection.
Once the Top-Down Volume Profile is set historical divergences will be affected by its value area (VA), with bearish divergences located above the upper VA or bullish divergences located under the lower VA being highlighted with a sauce can, a signature display stel of Frankie Candles.
Users can also filter out divergences based on the point of control (POC) using the "Filter According To POC" setting, with bearish divergences located below the POC or bullish divergences located above it being filtered out.
Do note that divergences are detected N bars after their occurrence, where N is the divergence lookback setting
🔹 Golden Pockets
The script includes an MTF Golden Pockets feature displaying Fibonacci retracements on the user chart, these can be used to identify optimal trade entries (OTE) or serve as support/resistance levels.
Golden Pockets are based on maximum/minimum prices in a window determined by the "Golden Pocket Lookback" setting, using longer-term lookbacks will return longer-term divergences, this will also be the case when using HTF golden pockets.
🔶 SETTINGS
🔹 Candle Coloring
Candle Coloring: Determine the candle coloring method used by the indicator. "Simple" will color the candles based on the candle body, while "Golden Pocket" will color candles using a gradient based on the golden pocket rolling maximum/minimum.
🔹 Top-Down Volume Profile
Top-Down Volume Profile: Enable Top-Down Volume Profile.
Rows: Amount of rows used by the Top-Down Volume Profile.
Width (%): Controls the histogram bar width as a percentage of the calculation window specified by the user set anchors.
Value Area (%): Area where the specified percentage of total volume is traded.
Extend To The Right: Extends the calculation window from the first anchor to the most recent bar.
🔹 MTF Divergences
Oscillator: Determines the oscillator and its length used for divergence detection. Options include "RSI", "MFI", "WaveTrend" and "External".
Divergence Lookback: Lookback period used to track oscillator tops/bottoms. Divergence will be detected n bars after an oscillator top/bottom, where n is the specified lookback period.
External Oscillator: External oscillator used for divergence detection if "External" is selected in the "Oscillator" dropdown menu, incompatible with Divergence Timeframe setting.
Divergence Timeframe: Timeframe used to calculate the selected oscillator and detect divergences. Incompatible with external oscillators.
Divergence From: Determines if price tops/bottoms evaluated to detect divergences are based on wicks (high/low price) or candle body (closing/opening price).
Filter According To POC: Filter displayed divergences based on the Top-Down Volume Profile POC.
Show Hidden: Display hidden divergences.
Show Sauce: Display canned source emoji on specific divergences.
🔹 Golden Pockets
Golden Pocket Lookback: Period used to calculate golden pockets, options include "Short-Term", "Medium-Term", and "Long-Term".
Extend: Extend Golden Pockets lines from the most recent bar by the specified amount of bars.
Golden Pocket Timeframe: Timeframe used to calculate the Golden Pockets.
Retracements: Display specific retracements, users can also control the ratio from the provided numerical setting.
Show Coordinate Line: Display a line connecting the top/bottom used to calculate the Golden Pockets.
Invert: Invert top/bottom for the Golden Pockets calculation.

Volume Candle DistributionThe Volume Candle Distribution (VCD) indicator examines the volume distribution across candle type, distinguishes between neutral, bullish and bearish volume pressures.
The VCD indicator calculates and displays the cumulative volume of bullish and bearish candles over a user-defined period, aggregates the volumes of bullish and bearish candles separately and plots them.
Bullish Volume : This is accumulated when the closing price of a candle is higher than the opening price, the VCD adds up the volume of bullish candle within the user-defined period, and consequently subtracts the volume when bearish candle.
Bearish Volume : Conversely, when the closing price is lower than the opening price, the volume of that candle is considered bearish, the VCD sums the volume of bearish candles over the same period, and consequently subtracts the volume when bullish candle.
Neutral Volume : In cases where the opening and closing prices are equal, the volume of that candle is treated as neutral, and the VCD subtracts the volume from both candles.
The 3 Simple Moving Average (SMAs) included is based volume calculated separately for both bullish and bearish volume data, and the sum of them.

Volume Heatmap 2024 | NXT2017 Christmas EditionHi big players around the world,
I wish you a merry christmas time.
Today I have a nice present for you: a new volume heatmap indicator for free using!
HISTORY
My first volume heatmap project got a lot of feedback and a big demand. You can find it here:
In this time pinescript version 4 was the newest one and I worked the first time with arrays.
Today we have pinescript version 5 and some new features. This is why I tried again with matrix function and the results are better than I expected.
HOW IT WORKS
The indicator calculates similar like the volume profile. It looks back and every volume where the close price is on the same row area, the volume will cumulated. How much rows the new chart view is showing, you can choose manually.
The mind behind this is to find high volume levels, where high volume catch the price in a range or get function as support/resistance line.
PICTURES
I hope it helps for your trading. You are welcome to give some comments.
Merry christmas and best regards
NXT2017

Volume Points of Control and No Control [NariCapitalTrading]Overview:
The "Volume Points of Control and No Control" (VPOC/VPONC) is a trading indicator/concept I designed to identify key price levels based on volume activity. It shows (on the price label on the y-axis) where there was the most (red) and the least (blue) volume over a specified lookback period. Read below for interpretation.
Key Features:
Identifies key price levels based on volume
Customizable lookback period and trade timeframe
Plots Volume Point of Control (VPOC) and Volume Point of No Control (VPONC)
Inputs and Calculations:
Custom Trade Timeframe: Allows users to set the desired timeframe for analysis (e.g., Daily, Weekly).
Lookback Period: Users can specify the period over which to analyze volume data.
VPOC Calculation: Determines the price level with the highest volume within the lookback period.
VPONC Calculation: Finds the price level with the lowest volume within the lookback period.
Indicator Usage:
The VPOC is considered a significant level where traders have shown the most interest, often acting as a strong support or resistance level. The VPONC, conversely, is a concept I made up. It represents a price level where 1) in an trending market, this price was accepted quickly, thus suggesting continuation of an trend. 2) price retracements will typically revisit thinly-traded price areas, the VPONC can sometimes signal an area of support in a downtrend.
Chart Representation:
VPOC Label: Plotted on the y-axis in red, indicating the price level with the highest volume.
VPONC Label: Displayed on the y-axis in blue, showing the price level with the least volume.
These labels are dynamically updated based on the user-specified lookback period and trade timeframe.
Footprint Chart + Volume ProfileFootprint charts provide volume information to candlestick charts. This indicator specifically provides the quantity of Market Orders executed on each side of the Order Book, thereby showing you the number of contracts that had hit the bid or the offer - and it does so on each bar.
In addition, it visualises a Volume Profile for each bar, providing you an even better visualisation, contrasted to that which renders the numbers alone.
This Footprint Chart calculates executed orders by getting the change in volume for every price move and pooling them on their corresponding "tick bucket". Their specific "tick bucket" is calculated on the nearest "tick", the size of which you will provide by setting the "Tick Size/ Increment" to whichever tick size you need .
For instance, volume changes on a price of 10.4 on a 1 tick Footprint Chart will be recorded as part of the nearest whole number(10), while on a 3 tick Footprint Chart, it will be recorded as part of 9 as it is the nearest multiple of 3.
Calculating the "tick bucket" this way is most conservative, however, if you would like it calculated differently — Having the volume changes recorded on the succeeding tick, e.g. Recording 10.4 as 12 on a 3 tick Footprint Chart. Simply set the "Tick Basket Assignment" to "Next Tick", While setting the same to "Previous Tick" records volume changes on the preceding tick. Default is "Nearest Tick".
How to read the Footprint Chart?
This Footprint Chart depicts a portion of the Depth of Market, arranged in such a way that the left side represents the bid, while the right side represents the ask. It is therefore natural that orders hitting the bid (Market Sells) are to be placed on the Left Side of the chart while orders hitting the ask (Market Buys) are to be placed on the Right Side. This way, you can visualise how the current price came to be, as well as observe with the several order flow analysis concepts and ideas you can apply. In summary, numbers on the Left represents Sell Orders and numbers on the Right represents Buy Orders.
If, however, you wish to see only the total volume that transacted within the bar, you may do so by toggling the "Split Buy and Sell" option.
Footprint Chart showing only the total volume:
Furthermore, this chart has its own candles, the width of which can be adjusted accordingly.
Volume Profile
This Footprint Chart offers a Stacked Volume Profile and an Unstacked Volume Profile, the former renders a Volume Profile which compares the buys from the sells, the better to visualise levels of activity, the latter renders a standard Volume Profile which shows the total volume that transacted on a price tick.
The type of Volume Profile that this Footprint Chart renders is similar to that of a Periodic Volume Profile, which renders Volume Profiles for every bar on the chart. Furthermore, the width of each Volume Profile bar of this Footprint Chart is relative to the largest volume transacted on the current session, the session beginning from the point you have opened the Footprint Chart until the 500th bar, capped for optimisational purposes, and shall adjust the session start accordingly once this limit had been reached. The Volume Profile bars' width will therefore change agreeably to each significant volume update, and sized relatively with that of the others.
Optimisation
This Footprint Chart utilises several drawings and calculations for attaining its visuals, the arrangement of which makes it more pleasing and easier to understand. Several optimisations have been implemented within the code, e.g. utilising queues, however, if you wish for it to be even more optimised, you can use an "Unstacked" Volume Profile, using larger tick sizes, as well as using 0 decimal placements for the Footprint Chart.
Furthermore, deselecting "Use Stacked Bars" will allow more boxes to be drawn, and will double the amount of boxes the volume profile can use.
Limitations
No historical tick data have yet been made available for use and so this Footprint Chart only has realtime data at its disposal. Historical footprints are therefore not rendered, the boundary of which is delineated by a vertical broken line.
Tips
This Footprint Chart is best viewed on a chart of its own, and it is therefore ideal to clear the chart of other candles by hiding them or utilising a line chart alternatively . In addition, stretch the time scale to its utmost capacity, the better to see properly the Volume Profile, as well as stretch the price scale to a proper height, the better to read the footprint volumes inscribed on the indicator.
Warnings
Changing settings may cause the Footprint Chart to reset. If, in case you have been accumulating Footprint Charts and wish to change some settings for the benefit of your charting, it is best to take a snapshot of your chart prior, for recent changes may cause resets to occur.

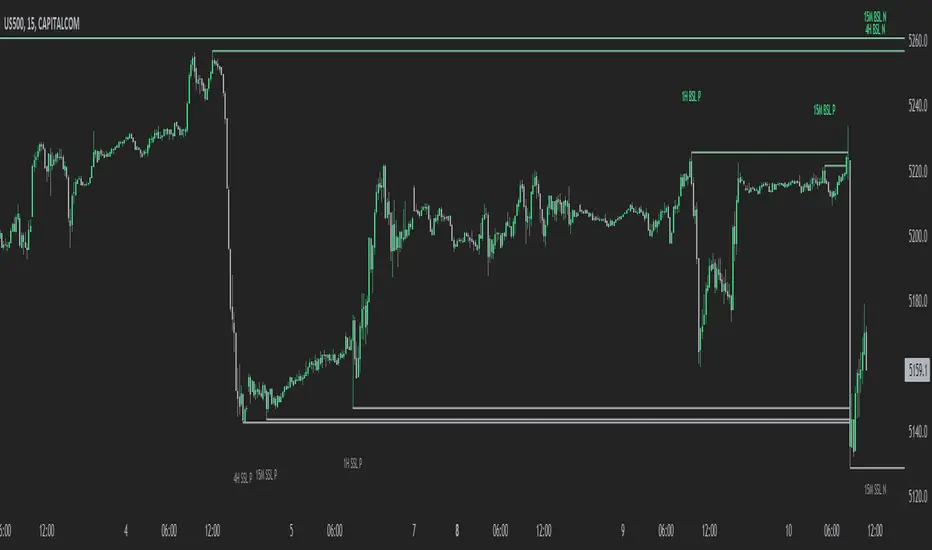
MTF External Range Liquidity - SMC IndicatorsThe Multi-Timeframe External Range Liquidity highlights possible “Key Liquidity Zones” above and below Short-Term highs and lows. Allowing for the filtering out of shorter-term swings and easily identifying levels for possible “liquidity runs” or “stop runs”.
Purged Liquidity
This shows areas where the price has already reached above previous key highs or below previous key lows. Recognizing “Purged Liquidity” areas is useful for historical analysis and understanding prior liquidity-driven movements.
Open Liquidity
These mark possible or potential Open Liquidity Zones where the price might reach above or below short-term key highs and lows.
Multi-Timeframe Analysis
The Multi Timeframe Feature allows traders to have all “key Liquidity Levels” from higher and lower timeframes relative to the current timeframe. (Weekly and down to the 1-Minute Chart) while trading in real-time allowing the trader to keep the higher time frame “levels” in mind when trading on lower time frames.
1W BSL & 1W SSL indicate levels of transposed from the Weekly timeframe to the Daily timeframe or lower.
1D BSL & 1D SSL indicate levels of transposed from the Daily timeframe to the 4H timeframe or lower.
4H BSL & 4H SSL indicate levels of transposed from the 4H timeframe to the 1H timeframe or lower.
1H BSL & 1H SSL indicate levels of transposed from the 1H timeframe to the 15M timeframe or lower.
15M BSL & 15M SSL indicate levels of transposed from the 15M timeframe to the 5M timeframe or lower.
5M BSL & 5M SSL indicate levels of transposed from the 5M timeframe to the timeframes lower than 5M.
How This Can Help with Analysis
Timing Entries
This tool can be used to look for possible entry levels by looking at where the last run on liquidity (Purged Liquidity) above a previous key high or low was. The trader would use this indicator by waiting until the liquidity is purged before looking for a possible trade setup.
This helps in waiting for entries and may avoid or reduce the number of entries where the trade would get stopped due to an early entry.
Setting Possible Targets
This indicator can be used to look for higher time frame “Open Liquidity” key levels above short-term highs or below short-term lows as potential targets.
Other Key Features
Alerts on selected time frame “key levels”
Choose to show and hide levels on any timeframe.
Choose the number of the Purged and Open Liquidity desired to show on the chart.
Highlights the Daily, Weekly, and Monthly Highs and Lows.
Liquidity composition / quantifytools- Overview
Liquidity composition divides each candle into sections that are used to display transaction activity at price. In simple terms, an X-ray through candle is formed, revealing the orderflow that built the candle in greater detail. Liquidity composition consists of two main components, lots and columns. Lots and columns can be used to visualize user specified volume types, currently supporting net volume and volume delta. Lots and columns can be used to visualize same or different volume types, allowing a combination of volume footprint, volume delta footprint and volume profile in one single view. Liquidity composition principally works on any chart, whether that is equities, currencies, cryptocurrencies or commodities, even charts with no volume data (in which case volatility is used to approximate transaction activity). The script also works on any timeframe, from minute charts to monthly charts. Orderflow can be observed in real-time as it develops and none of the indications are repainted.
Example: Displaying same volume types on lots and columns
Example: Displaying different volume types on lots and columns
Liquidity composition supports user specified derivative data, such as point of control(s) and net activity coloring. Derivative data can be calculated based on either net volume or volume delta, resulting in different highlights.
With net volume, volume delta and derivative data in one view, key orderflow events such as delta imbalances, high volume nodes, low volume nodes and point of controls can be used to quickly identify accumulation/distribution, imbalances, unfinished/finished auctions and trapped traders.
Accessing script 🔑
See "Author's instructions" section, found at bottom of the script page.
Key takeaways
- Liquidity composition breaks down transaction activity at price, measured in net volume or volume delta
- Developing activity can be observed real-time, none of the indications are repainted
- Transaction activity is calculated using volumes accrued in lower timeframe price movements
- Lots and columns can be used to display same or different volume types (e.g. volume delta lots and net volume columns) in single view
- Users can specify derivative data such as volume delta POCs, net volume POC and net activity coloring
- For practical guide with practical examples, see last section
Disclaimer
Orderflow data is estimated using lower timeframe price movement. While accurate and useful, it's important to note the calculations are estimations and are not based on orderbook data. Estimates are calculated by allotting volume developing on lower timeframe chart to its respective section based on closing price. Volume delta (difference between buyers/sellers) is calculated by subtracting down move volumes (sell volume) from up move volumes (buy volume). Accuracy of the orderflow estimations largely depends on quality of lower timeframe chart used for calculations, which is why this tool cannot be expected to work accurately on illiquid charts with broken data.
Liquidity composition does not provide a standalone trading strategy or financial advice. It also does not substitute knowing how to trade. Example charts and ideas shown for use cases are textbook examples under ideal conditions, not guaranteed to repeat as they are presented. Liquidity composition should be viewed as one tool providing one kind of evidence, to be used in conjunction with other means of analysis.
- Example charts
Chart #1: BTCUSDT
Chart #2: EURUSD
Chart #3: ES futures
- Calculations
By default, size of sections and lower timeframe accuracy are automatically determined for all charts and timeframes. Number of lower timeframe price moves used for calculating orderflow is kept at fixed value, by default set to 350. Accuracy value dictates how many lower timeframe candles are included in the calculation of volume at price. At 350, the script will always use 350 lower timeframe price movements in calculations (when possible). When calculated dynamic timeframe is less than 1 minute, the script switches to available seconds based timeframes. Minimum dynamic timeframe can be capped to 1 minute (as seconds based timeframes are not available for all plans) or dynamic timeframe can be overridden using an user specified timeframe.
Example: Calculating dynamic lower timeframe
Main chart: 4H / 240 minutes
Accuracy value: 100
Formula: 240 minutes / 100 = 2.4 minutes
Timeframe used for calculations = 2 minutes
Section size is automatically determined based on typical historical candle range, the bigger it is, the bigger the section size as well. Like dynamic timeframe, automatic section size can be manually overridden by user specified size expressed in ticks (minimum price unit). Users can also adjust sensitivity of automatic sizing by setting it higher (smaller sections, more detail and more noise) or lower (less sections, less detail and less noise). Section size and dynamic timeframe can be monitored via metric table.
Volume at price is calculated by allotting volume associated with a lower timeframe price movement to its respective section based on closing price (volume is stored to the section that covers closing price). When used on a chart with no volume data, volatility is used instead to determine likely magnitude of participation. Volume delta (difference between buyers/sellers) is calculated by subtracting down move volumes (sell volume) from up move volumes (buy volume). Volumes accrued in sections are monitored over a longer period of time to determine a "normal" amount of activity, which is then used to normalize accrued volumes by benchmarking them against historical values.
Volume values displayed on the left side represent how close or far volume traded at given section is to an extreme, represented by value of 10 . The more value exceeds 10, the more extreme transaction activity is historically. The lesser the value, the less extreme (and therefore more typical) transaction activity is. Users can adjust sensitivity of volume extreme threshold, either by increasing it (more transaction activity is needed to constitute an extreme) or decreasing it (less transaction activity is needed to constitute an extreme).
Example: Interpreting volume scale
0 = Very little to no transaction activity compared to historical values
5 = Transaction activity equal to average historical values
10 = Transaction activity equal to an extreme in historical values
10+ = The more transaction activity exceeds value of 10, the more extreme it is historically
Accuracy of orderflow data largely depends on quality of lower timeframe data used in calculations. Sometimes quality of underlying lower timeframe data is insufficient due to suboptimal accuracy or broken lower timeframe data, usually caused by illiquid charts with gaps and inconsistent values. Therefore, one should always ensure the usage of most liquid chart available with no gaps in lower timeframe data. To combat poor orderflow data, a simple data quality check is conducted by calculating percentage of sections with volume data out of all available sections. Idea behind the test is to capture instances where unusual amount of sections are completely empty, most likely due to data gaps in LTF chart. E.g. 90% of sections hold some volume data, 10% are completely empty = 90% data quality score.
Data quality score should be viewed as a metric alerting when detail of underlying data is insufficient to consider accurate. When data quality score is slightly below threshold, lower timeframe chart used for calculations is likely fine, but accuracy value is too low. In this case, one should increase accuracy value or manually override used timeframe with a smaller one. When data quality score is well below threshold, lower timeframe chart used for calculations is likely broken and cannot be fixed. In this case, one should look for alternative charts with more reliable data (e.g. ES1! -> SPY, BITSTAMP:BTCUSD -> BINANCE:BTCUSDT).
Example : When insufficient data quality scores can/cannot be fixed
- Derivative data
Point of control
Point of control, referring to point in price where transaction activity is highest, can be calculated based on the volume type of lots or columns (based on net volume or volume delta). Depending on the calculation basis, displayed point of controls will vary. POC calculated based on net volume is no different from traditional POC, it is simply the section with highest amount of transaction activity, marked with an X. When calculating POC based on volume delta, the script will highlight two point of controls, named leading and losing point of control . Leading POC refers to lot with highest amount of volume delta, marked with an X. If leading POC was net buy volume, losing POC is marked on section with highest net sell volume, marked with S respectfully. Same logic applies in vice versa, if leading POC is net sell volume, losing POC is marked on highest buy volume section, using the letter B.
Net activity
Similarly to point of control calculation, net activity can be calculated based on either volume types, lots or columns. When calculating net activity based on net volume, candles will be colorized according to magnitude of total volume traded. When calculating net activity based on volume delta, candles will be colorized according to side with most volume traded (buyers or sellers). Net activity color can be applied on borders or body of a candle.
- Visuals
Lots, columns, candles and POCs can be colorized using a fixed color or a volume based dynamic color, with separate color options for buy side volume, sell side volume and net volume.
Metric table can be offsetted horizontally or vertically from any four corners of the chart, allowing space for tables from other scripts.
Table sizes, label sizes and offsets for visuals are fully customizable using settings menu.
- Practical guide
OHLC data (candles) is a simple condensed visualization of an auction market process. Candles show where price was in the beginning of an auction period (timeframe), the highest/lowest point and where price was at the end of an auction. The core utility of Liquidity composition is being able to view the same auction market process in much greater detail, revealing likely intention, effort and magnitude driving the process. All basic orderflow concepts, such as ones presented by auction market theory can be applied to Liquidity composition as well.
The most obvious and easy to spot use case for orderflow tools is identifying trapped traders/absorption, seen in high transaction activity at the very highs/lows of a candle or even better, at wicks. High participation at wicks can be used to identify forced orders absorbed into limit orders, idea behind being that when high transaction activity is placed at a wick, price went one direction with a lot of participation (high effort) and came right back up (low impact) within the same time period.
Absorption can show itself in many ways:
- Extreme buy volume sections at wick highs or buy side POC at wick highs
- Multiple, clustered high buy volume sections (but not extreme) at wick highs
- Positive net volume delta into a reversal down
- Extreme sell volume sections at wick lows or sell side POC at wick lows
- Multiple, clustered high sell volume sections (but not extreme) at wick lows
- Negative net volume delta into a reversal up
- Extreme net volume sections at or net volume POC at wick highs/lows
- Extreme net volume into a reversal up/down
For accurate analysis, orderflow based events should be viewed in the context of price action. To identify absorption, it's best to look for opportunities where an opposing trend is clearly in place, e.g. absorption into highs on an uptrend, absorption into lows on a downtrend. When price is ranging without a clear trend or there's no opposing trend, extreme activity at an extreme end of a candle might be aggressive participants attempting to initiate a new trend, rather than getting absorbed in the same sense. With enough effort put into pushing price to the opposite direction at overextended price, a shift in trend direction might be near.
Price action based levels are a great way to get context around orderflow events. Simple range highs/lows as a single data point serve as a high probability regimes for reversals, making them a great point of confluence for identifying trapped traders.
Low to zero volume sections can be used to identify points in price with little to no trading, leaving a volume null/void behind. Typically sections like these represent gaps on a lower timeframe chart, which can be used as reference levels for targets and support/resistance.
Net volume can be used for same purposes as above, but for determining general intention of market participants it's a much more suitable tool than volume delta. According to auction market theory, low/no participation is considered to reject prices and high participation is considered to accept prices. With this concept in mind, unfinished auctions occur when participation is high at highs or high at lows, idea behind being that participants are showing willingness and interest to trade at higher or lower prices. Auction is considered finished when the opposite is true, i.e. when participants are not showing willingness to trade at higher/lower prices. In general, direction of unfinished auctions can be expected to continue shortly and direction of unfinished auctions can be expected to hold.
While shape of volume delta and net volume are usually similar, they're not the same thing and do not represent the same event under the hood. Volume delta at 0 does not necessarily mean participation is 0, but can also mean high participation with equal amount of buying and selling. With this distinction in mind, using volume delta and net volume in tandem has the benefit of being able to identify points in price with a lot of up and down price movement packed into a small area, i.e. consolidation. Points in price where price hangs around for an extended period of time can be used to identify levels of interest for re-tests and breakout opportunities.

Volume Profile PlusThis indicator provides a high-resolution and high-precision implementation of Volume Profile with flexible range settings. Its key features include:
1. Support for a high resolution of up to 2,500 rows.
2. Capability to examine lower timeframe bars (default 5,000 intra-bars) for enhanced precision.
3. Three range modes — "Visible Range", "Anchored Range", and "All Range".
4. Highlighting of Point of Control and Value Area.
5. Extensive customization options allowing users to configure dimensions, on-chart placements, and color schemes.
🔵 Settings
The settings screen, along with the explanations for each setting, is provided below:
🔵 High Resolution using Polyline
Inspired by @fikira, this indicator utilizes the newly introduced `polyline` type in PineScript to plot the volume profile. It employs a single polyline instance to represent the entire histogram. With each polyline instance supporting up to 10,000 points and each histogram row requiring 4 points, this indicator can accommodate 2500 rows, resulting in a significantly higher resolution compared to conventional volume profile indicators that use `line`s or `box`es to draw the histogram.
🔵 High Precision Data-binning using Lower Timeframe Data
Conventional volume profile indicators often face one or both of the following limitations:
1. They only consider volume within the chart's current timeframe.
2. They assign each bar's total volume to a single price bucket based on the bar's average price, rather than distributing volume across multiple price buckets.
As a result, when the number of bars in the chart is low, those indicators may provide imprecise results, making it difficult to accurately identify significant volume nodes and the point of control.
To address these limitations and enhance accuracy, this indicator examines data from lower timeframes and distributes the volume to fine-grained price buckets. It intelligently selects an appropriate lower timeframe to ensure precise output while complying with a maximum specified number of bars to maintain good performance.
🔵 Three Range Modes
This indicator offers users the flexibility to choose from three range modes:
1. Visible Range (Default Mode): In this mode, the volume profile calculation begins at the time of the left-most bar displayed in the current viewport. As the user scrolls through the viewport, the volume profile updates automatically.
2. Anchored Range: This mode allows the user to set the start time either by using the datetime input boxes or by dragging the anchor line on the chart.
3. All Range: In this mode, the volume profile calculation is based on all the historical bars available in the chart.

MONEY ZONEA volume profile is an advanced charting tool that displays the traded volume at different price levels over a specific period. It helps you visualize where the majority of trading activity has occurred.
This indicator is a Market Profiling tool used to analyse the Point of Control (POC) and Value Area (VAH/VAL) on the daily, weekly and monthly timeframes. It also optionally displays historical Value Areas to help find confluence with past data.
The Point of Control describes the price level where the most volume was traded. A Naked Point of Control (also called a Virgin Point of Control) is a previous POC that has not been traded.
The Value Area is a range of prices where the majority of trading volume took place on the prior trading day. In specific, this area is the range where 70% of the prior day’s volume happened. The value area is approximately one standard deviation above and below the average highest volume price. With this knowledge, there are specific probabilities of market behavior we can understand to digest the value area. The value area gives us an idea of where the smart money is playing ball and where the institutions are guiding the market. From this data, we can derive intra-day strategies that capitalize on market behavior.
🔹 Point of Control (PoC)
Point of Control (POC) – The price level for the time period with the highest traded volume
🔹 Value Area (VA)
Value Area (VA) – The range of price levels in which the specified percentage of all volume was traded during the time period.
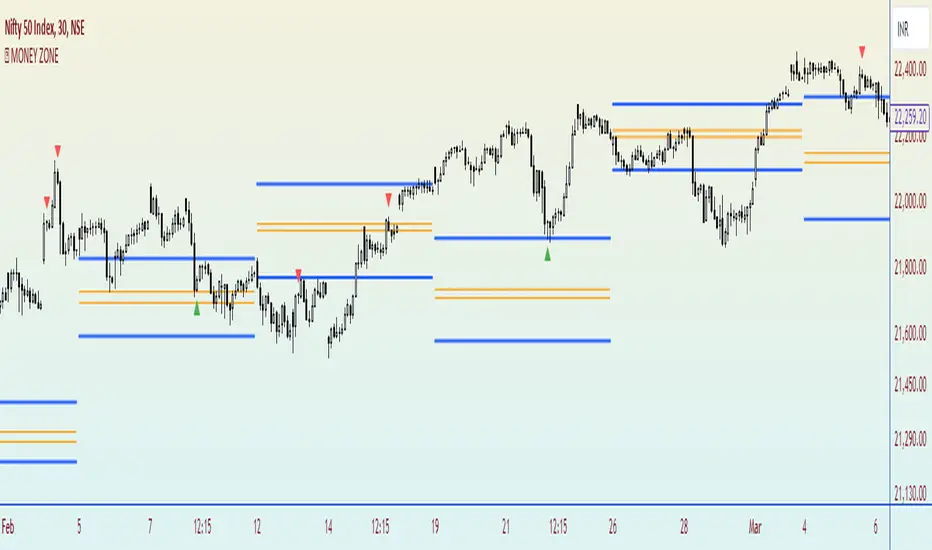
Oscillator Volume Profile [Trendoscope®]The Oscillator Volume Profile indicator is designed to construct a volume profile based on predefined oscillator levels. It integrates volume data with oscillator readings to offer a unique perspective on market dynamics.
🎲 Selectable Oscillators:
Users can select from an array of oscillator options for the basis of the volume profile, including:
Relative Strength Index (RSI)
Chande Momentum Oscillator (CMO)
Center of Gravity (COG)
Money Flow Index (MFI)
Rate of Change (ROC)
Commodity Channel Index (CCI)
Stochastic Oscillator (Stoch)
True Strength Index (TSI)
Williams %R (WPR)
The length parameters - Length, Fast Length, Slow Length allows users to define the period over which the chosen oscillator is calculated, tailoring the sensitivity of the indicator to their trading strategy.
🎲 Dynamic Overbought/Oversold Ranges:
This indicator enhances traditional concepts by introducing dynamic overbought and oversold levels. These adaptable thresholds are calculated using various methods, including:
🎯 Highest/Lowest Range Method : This method establishes the range based on the highest and lowest values of the oscillator within the last N bars.
🎯 Moving Average Range Method : The range is derived from a moving average of the oscillator, providing a smoothed threshold that reflects more recent market conditions.
In addition to these methods, the indicator incorporates a unique 'Sticky Border' feature:
🎯 Sticky Border: With this option enabled, the dynamic ranges maintain their levels until the oscillator breaks out of the range. Once a breakout occurs, the levels are recalculated and updated. This mechanism ensures that the borders remain consistent and relevant, only adjusting to significant market movements that warrant a recalculation.
Users can select their preferred method for determining dynamic ranges, allowing for a customized approach that aligns with their analysis and trading strategy. The sticky border feature further refines this functionality, offering continuity until a decisive market move occurs.
🎲 Volume Profile Calculation Parameters:
🎯 Trend Filter: The indicator provides a versatile trend filter with four selectable options:
Uptrend: The volume profile is calculated when the oscillator indicates an uptrend.
Downtrend: The volume profile is calculated when the oscillator indicates a downtrend.
Any: The volume profile is calculated regardless of the trend.
External: Users can input values from an external indicator. The volume profile is then calculated only when the external indicator's value is non-zero, integrating external analysis into the volume profile construction.
🎯 Precision: Users have the option to define the precision for calculating the volume profile, which is crucial due to the varying scales of different oscillators (e.g., some oscillators range from 0 to 100, while others from -1 to 1). Selecting an appropriate precision ensures that the volume profile is accurately aligned with the minimal price range significant to the chosen oscillator. This setting requires user intervention for optimal configuration, as automatic calculation is not feasible due to the diverse nature of oscillator ranges.
🎯 Number of Bars: Users can select a specific number of bars for volume profile calculation, or opt to include all available historical bars for a comprehensive profile.
🎲 Selecting the right precision:
Users must select the right precision based on their choice of indicator. For example, RSI values range from 0-100. Hence, the default precision of 1 work fine on RSI as the volume profiles are plotted from 0 to 100 at the interval of 0.1
But, the default precision of 1 will not be ok on TSI because TSI values range from -1 to 1. Hence, using 1 as precision will result in very less volume profile lines as shown below.
Due to this, it is necessary to increase the precision for oscillators such as TSI where the range between highest and lowest value is far less. Once we set the precision to 2, we can see more appropriate volume profile division.
🎲 Note of thanks:
This publication uses polyline feature for drawing volume profiles. The advantage of using polyline is that we can overcome max 500 lines issue that we face by using the regular line objects. More details of polyline can be found in the tradingview blog post
Further, using polyline for display of volume profiles is inspired by the publications of fikira and KioseffTrading
