Stochastic RSI (STOCH RSI)

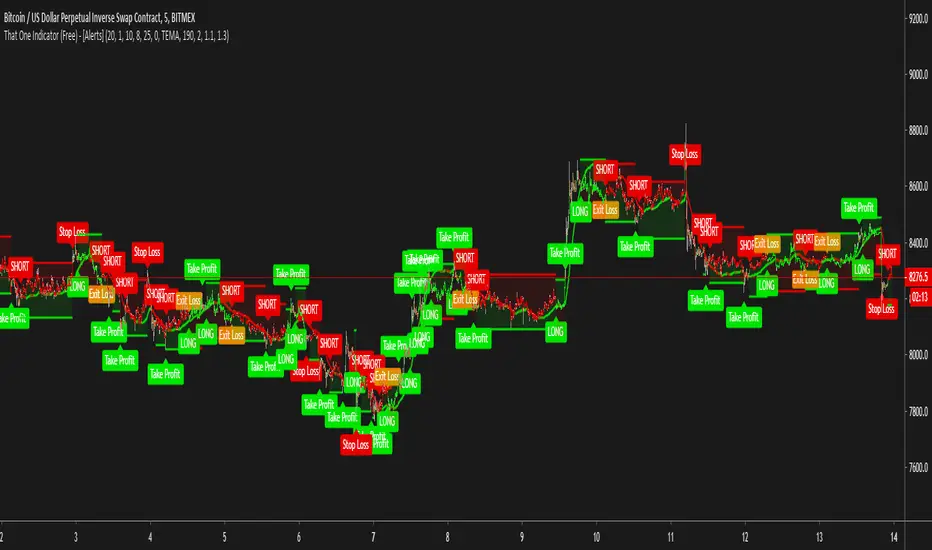
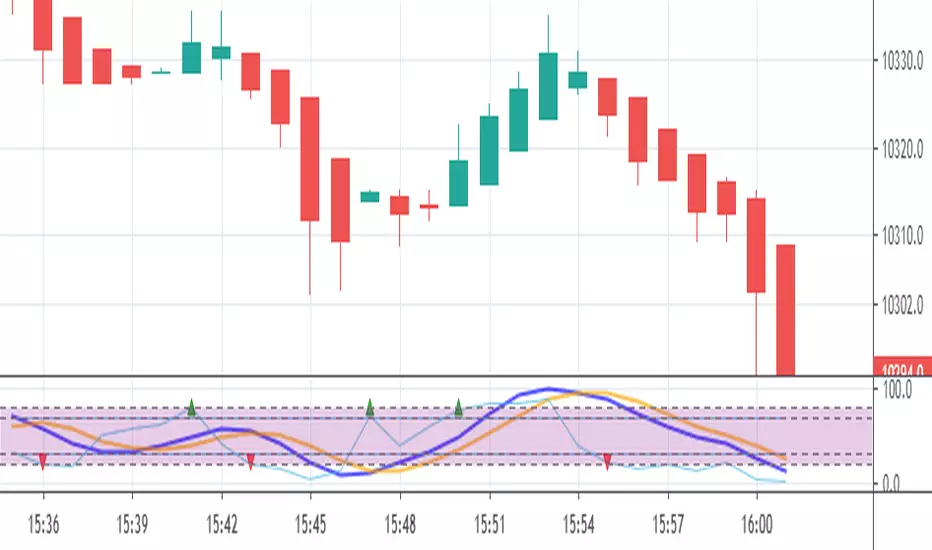
That One Indicator (Free) - [ALERTS]This script comes with the following indicators:
Bollinger Bands
Stochastic
Moving Average Trend Confirmation Filter (EMA, SMA)
Long/Short Alerts
Stop Loss Alerts
And a few more indicators in the back-end to increase accuracy
This script works really well as a scalper on lower Time Frames as well as on higher Time Frames. Besides that you can also trade it on pretty much any coin or asset.
This script is not repainting. We advise to use alerts on “Once Per Bar Close” .
If you’d like to automate this script you can do that by using AutoView, ProfitView, ProfitTrailer, CryptoHopper etc.
Alerts are set very clearly as Long and Short to avoid confusion.
A new script is being published soon with a lot more functionality, which includes noise filtering, all MA Types, RSI and other types of volatility measurements to filter out “less profitable” trades.
Feel free to leave a comment and share it with your friends.
RSI , Products of Nha Son Pleikugiao dịch forex bằng RSI. công cụ tuyệt vời nhất. Mọi người có thể sử dụng hoặc copy chiến lược của mình trên copyhotforex.

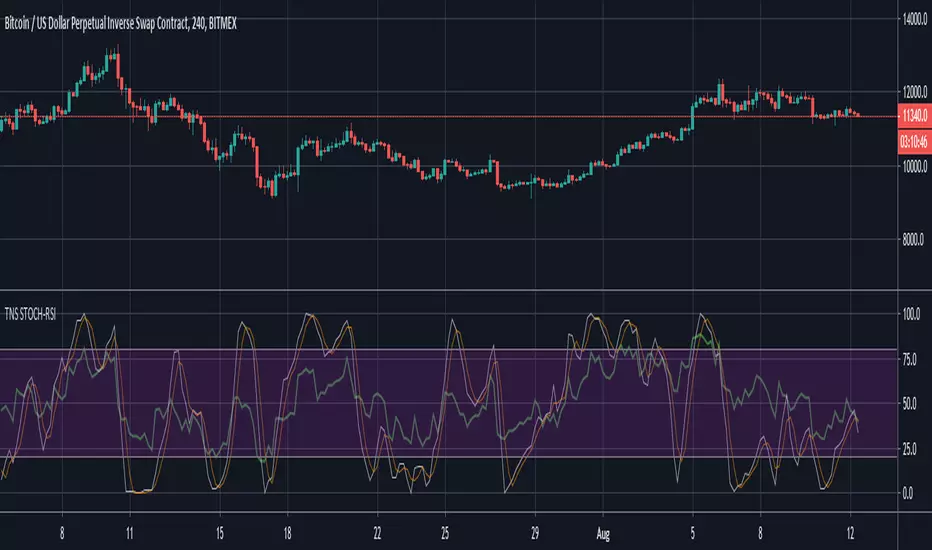
Assassin Multi StochrsiAuto change timeframe stochrsi.
1h with 4h
45m with 3h
3h with 8h
1d with 1 week
5and 15m with 1h and 4h.
auto change with timeframe

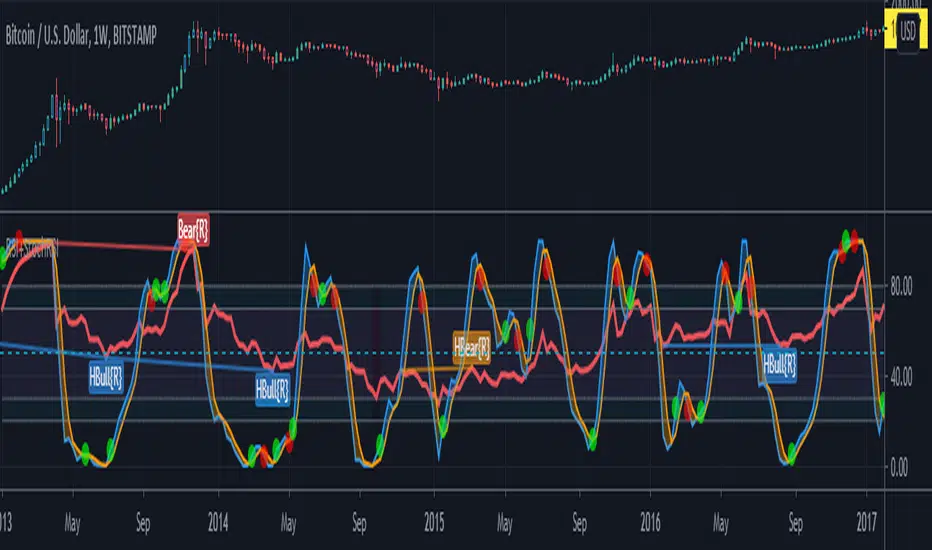
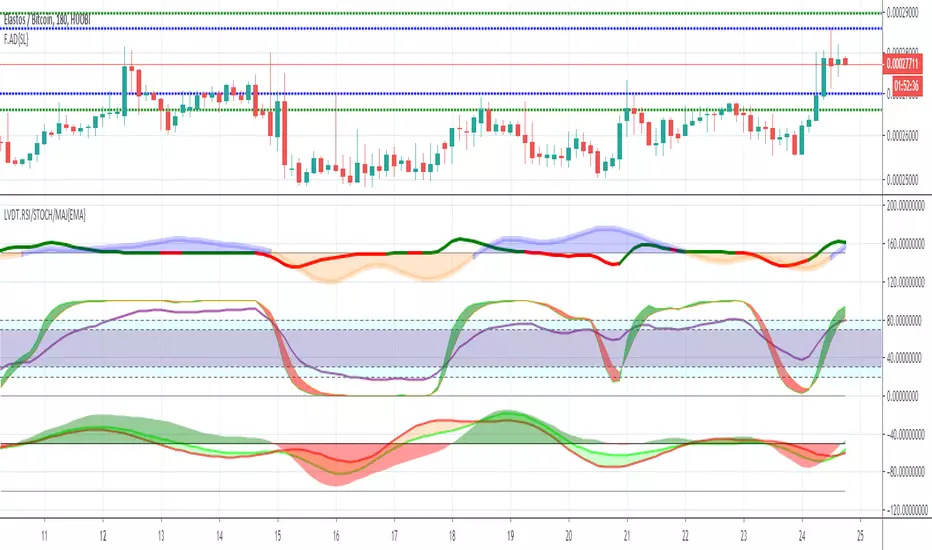
LIVIDITIUM RSI/STOCH/MAJ Oscillator Set {EMA}LVDT RSI oscillator
LVDT STOCHASTIC-RSI oscillator
LVDT MAJ (Momentum/Acceleration/Jerk) oscillators + signals ( Default = Disabled)
~JuniAiko
(=^~^=)v~
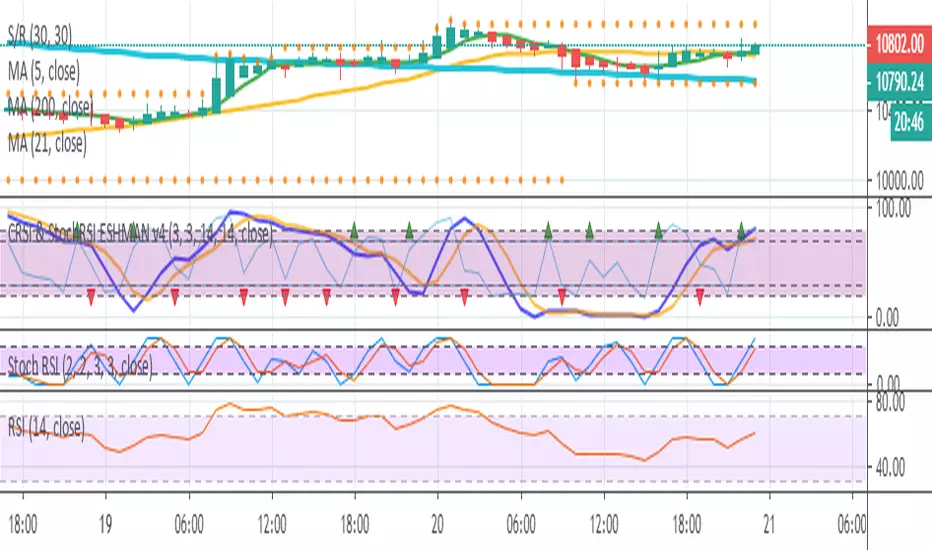
CRSI & StochRSI ESHMAN v4Indicator based on CRSI & StochRSI. This indicator is created to back a strategy, may not be useful without underlying strategy.
Publisher take no responsibility for your loss. Use at your own risk.
CRSI & StochRSI ESHMAN v3This indicator was created to back a strategy. uses CRSI and StochRSI. Indicator may not be useful without the underlying strategy.
Publisher take no responsibility for your loss. Use at your own risk.
Added crossover and crossunder.
CRSI & Stoch RSI EshmanThis indicator is combination of CRSI and Stoch RSI. This indicator is created to back a strategy to catch all Long and Short rallies. There are additional confirmations required for trade which are only mentioned in the underlying strategy.
The publisher take no responsibility of your loss. Use at your own risk.

Function StochRSI Stochastic Relative Strength Index developed by Tushar Chande and Stanley Kroll.
This script has been written to eliminate the period variable.(Integer)
Thus, it can be used comfortably in adaptive period scripts ! (For example : Adaptive Moving Average , KAMA , FAMA .. etc. )
All efforts goes to ChaosTrader () ,
RicardoSantos () ,
Hpotter for barcolor codes (iff) ()
I hope it will help your new ideas . Best regards ! Noldo .


Market Cycle & Scalping entry / exitCycle indicator is an oscillator commonly used to identify market trends and provide buy and sell signals to traders. The Cyle indicator is based on the assumption that currency trends accelerate and decelerate in cyclical patterns that may reflect the dominant price cycle of any stock, during any time frame. It works best on a 1 min chart for quick scalp plays.

Bilateral Stochastic RSI/MFI [AL] @Version=3 Hi, this is a Stochastic RSI/MFI converted from Alex Grover's (www.tradingview.com) idea for the Stochastic calculation.
It also includes the cycle calculation and filtering form Anooj Patel
And the Divergence plots from Just UncleL www.tradingview.com
There are probably a few i have forgotten but thanks to all of the community who share and help us all learn!!

Hashem Extended StochasticExtended Stochastic with All Zones.
From Neutral to Danger Zones.
The Most Complete and Extended Stochastic Indicator.

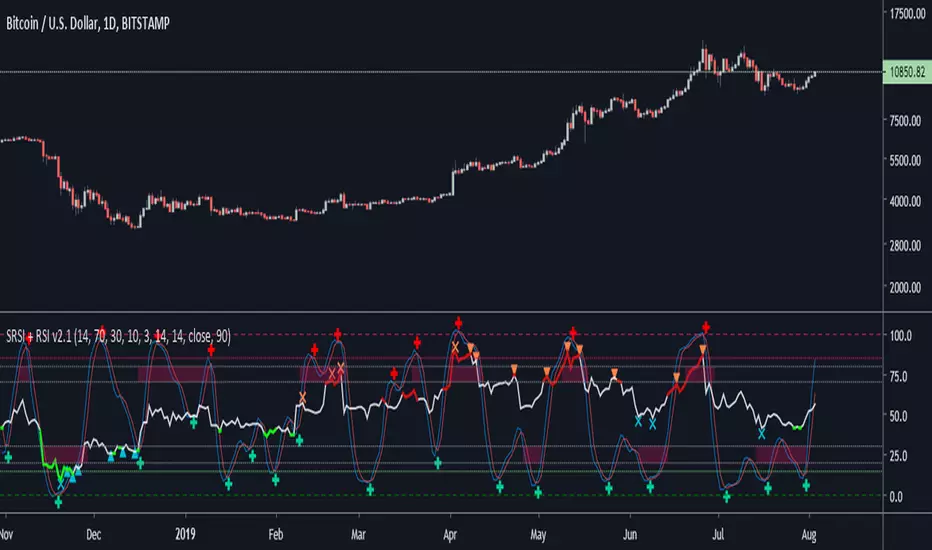
(bullyena) Stoch RSI + RSIFeatures:
RSI and Stoch RSI in one indicator
RSI divergence signals
Stoch RSI crosses signals
RSI exhaustion
RSI OS/OB colors
Alerts for:
RSI divergence
Stoch RSI crosses
Assassin MTF Stochrsiauto change stochrsi timeframe.
1h: 1h and 4h
4h: 4h and daily
1d: 1d and weekly
all argument can change.


StochRSI 𝝙Enhanced version of StochRSI inspired by my premium RSI Delta script.
Check my premium advanced indicators:

