Probability Distribution HistogramProbability Distribution Histogram
During data exploration it is often useful to plot the distribution of the data one is exploring. This indicator plots the distribution of data between different bins.
Essentially, what we do is we look at the min and max of the entire data set to determine its range. When we have the range of the data, we decide how many bins we want to divide this range into, so that the more bins we get, the smaller the range (a.k.a. width) for each bin becomes. We then place each data point in its corresponding bin, to see how many of the data points end up in each bin. For instance, if we have a data set where the smallest number is 5 and the biggest number is 105, we get a range of 100. If we then decide on 20 bins, each bin will have a width of 5. So the left-most bin would therefore correspond to values between 5 and 10, and the bin to the right would correspond to values between 10 and 15, and so on.
Once we have distributed all the data points into their corresponding bins, we compare the count in each bin to the total number of data points, to get a percentage of the total for each bin. So if we have 100 data points, and the left-most bin has 2 data points in it, that would equal 2%. This is also known as probability mass (or well, an approximation of it at least, since we're dealing with a bin, and not an exact number).
Usage
This is not an indicator that will give you any trading signals. This indicator is made to help you examine data. It can take any input you give it and plot how that data is distributed.
The indicator can transform the data in a few ways to help you get the most out of your data exploration. For instance, it is usually more accurate to use logarithmic data than raw data, so there is an option to transform the data using the natural logarithmic function. There is also an option to transform the data into %-Change form or by using data differencing.
Another option that the indicator has is the ability to trim data from the data set before plotting the distribution. This can help if you know there are outliers that are made up of corrupted data or data that is not relevant to your research.
I also included the option to plot the normal distribution as well, for comparison. This can be useful when the data is made up of residuals from a prediction model, to see if the residuals seem to be normally distributed or not.
ส่วนเบี่ยงเบนมาตรฐาน

[BCT] Configurable DistributionTrading, like any "game of chance" is best studied and practiced using statistics.
Distributions are a simple and intuitive way to summarize your data and identify whether they follow a pattern (e.g. Normal aka Gaussian distribution, or otherwise)
Use cases:
- Confirm or infirm the indicator / strategy / time series you are looking at follows a known distribution
- Identify an edge you can consistently target
- Investigate changes over time
- Slice the distribution by quartiles or equal sized "buckets" you can use to set adequate limits in your strategies
to apply this script to your indicator, add this indicator to the chart along with the one you want to extract the distribution of. On this script's settings, switch from 'close' to the name of your indicator.
Example: add a log return calculation, add this script, select 'log return' in place of 'close' to obtain the example above.
Features:
- "zoom" - it's a multiplier that zooms in; note that the extremes will be "cropped out" of the picture, but are added to the first and last bar so as to maintain a correct count.
- "quartiles" - typically quartiles are by 4 but you can change it to any number. The table below the chart shows cutoff values for your indicator.
- "bins" - is the number of bins for the distribution.

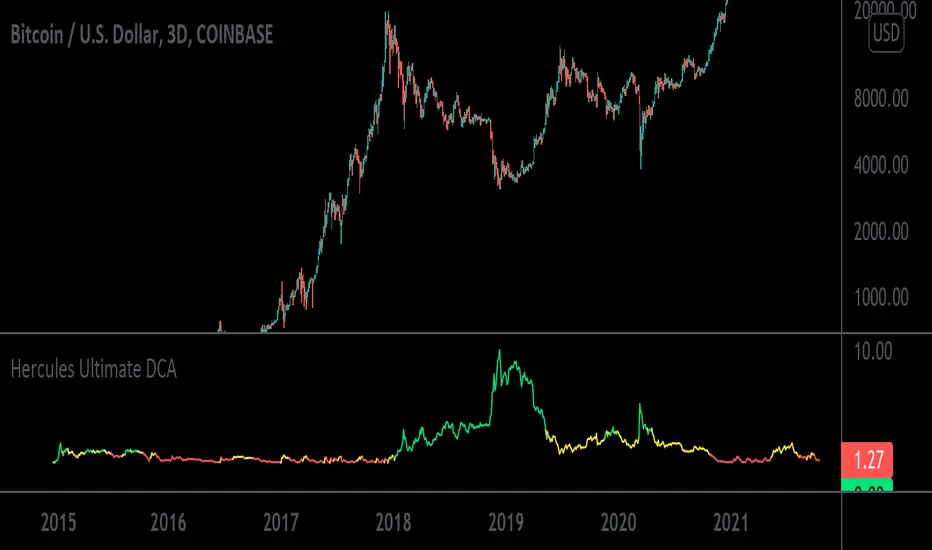
Hercules Ultimate DCA™The Problem Most People Face When Trading & Investing:
If anyone tells you they know where the market is going, they’re either lying or they’re time travelers.
The truth is NOBODY knows whether the markets will move up or down tomorrow, next week, next year, or over any period of time.
If we all knew, we’d all be rich. What would suit most Investors is to Invest consistently over long periods of time into sound financial products.
When Creating This Investing Tool We Had 5 Requirements in Mind:
1. To create a tool that ANYONE with little to no experience could use to outperform 95% of traders and speculators.
2. To ignore the Charts, Candlesticks, Indicators, and Volatility in any market so you can rest easy at night, never having to look at the price of your asset and still remain profitable.
3. To create a tool that tells you exactly HOW MUCH to invest every day or week which takes the stress away in guessing which direction the market will go.
3. To minimize your risk and and exposure to downside even if you started buying a crypto at or near the top of a market.
4. To buy a crypto at or near the bottom of every single major swing or trend.
5. To make Investing Easy, Simple, and Fun for the average joe.
We achieved that goal with the Hercules Ultimate DCA™ Tool!
WHO Created it & HOW was it Created?
This tool uses complex math and an algorithm designed by a Quantitative Military Mathematician (who wishes to remain anonymous, so we’ll call him Satoshi) over a period of 5 and a half months.
To start, we wanted to keep things simple, and extensively researched 6 of the top investing strategies of all time:
1. Buy and Hold
2. Active Investing
3. Dollar Cost Averaging
4. Index Investing
5. Growth Investing
6. Value Investing
Most of the strategies above work well depending on your goals or how risk adverse you are, however most DO NOT check off all of the requirements we mentioned above. Comprehensive home-work and price-action history in Cryptocurrency Markets led us to the Dollar Cost Averaging (DCA) Strategy.
According to Fidelity,
“Dollar Cost Averaging is a strategy where you invest your money in equal portions, at regular intervals, regardless of which direction the market or a particular investment is going. In other words, your purchases occur regardless of the changes in price for the stock or other investment, potentially helping reduce the impact of volatility on the overall purchase.”
With this in mind our High IQ math friend got to work and formulated over 17 Different Variable Algorithms on the DCA Strategy before arriving to the one we named Hercules Ultimate DCA™.
WHY the Hercules Ultimate DCA™ Works BETTER Than Anything Else.
Rigorous backtesting & forward-testing led us to create what we believe is the most effective and efficient strategy to extract the most money from the markets while at the same time minimizing nearly all the risk when investing your hard earned money in small increments in a truly effortless way.
The Hercules Ultimate DCA™ is essentially a DCA strategy put on steroids because no two investments are alike.
As we mentioned above, a traditional DCA approach assumes you purchase the same dollar amount of any asset at scheduled times, no matter where the price of your purchased asset is.
Example: If you have $1,000 dollars and decided to invest 50 dollars per week into Bitcoin, you would invest over a period of 20 weeks before you run out of money. Now, let’s assume the price of bitcoin is 50k during your first week, you would invest $50 dollars. Then next week the price rises to 60k, you would still invest $50 Dollars. The third week, if the Price of BTC rose to 70k, you would invest $50 dollars, so on and so forth. This approach is flawed because although you would still do better than many speculators and traders over a long period of time, it essentially leaves you penniless at the end of twenty weeks with no gunpowder left to buy BTC if it drops to all-time lows.
The Hercules Ultimate DCA™ works so well because it tells you to invest less as the price goes up and far more if the prices drops. What feels counterintuitive to most investors is typically what provides the most returns. Take the example above. If you have $1,000 dollars to invest weekly and Bitcoin currently sits at 50k, you would start by investing $50 dollars. Then next week, let’s say BTC rises to 60k, you would now invest $30 dollars. And your third week, BTC reaches 70k, you would now invest $10 dollars. Not only does strategy preserve your capital but it tells you to invest less into an asset at all time highs and far more into an asset at lows.
Now obviously the math in this tool is more complex, but it’s also more cost effective. At the time of writing this, the current Crypto Market has tanked from all-time-highs. Bitcoin currently sits at a price of $32,000 and is 51% down from its high of $64,900 dollars.
Just using this tool over the last 6 years, you would have invested a total of $5758.71 dollars and accumulated 4.328 Bitcoins for an average purchase of $1330.34 dollars. Your current Portfolio value would be $138,519.77 for a whopping percentage gain total of 2305%.
In other words, even with this massive crypto dump, you’d be rolling handsomely in your profits and you’d feel pretty smart too.
What’s more unique is that the Hercules Ultimate DCA™ will ALWAYS tell you to Invest More Dollars at the Literal Bottom of ANY market.
Dips in a market you believe in are far more exciting and will provide far more returns. The only way this tool fails is if the user (you) choose a market that goes to zero or is a rugpull.
How Do You Use the The Hercules Ultimate DCA™?
Step 1: Scroll to your “Invite-Only Scripts” in your indicators tab on Tradingview, then click on the indicator titled, “Hercules Ultimate DCA.”
Step 2: You should see the Indicator Populate at the Bottom of your chart with two lines, the Green line indicating how much you should buy that day, and the Blue line indicating how much of the asset you’ve purchased.
Step 3: (If you haven’t already) Make sure you turn on the Indicator Label. Navigate to the top right of the Crypto Product you would like to purchase and you will see a small settings gear. Once open, navigate on the left-hand side to the “Scales” tab and find the “Indicator Last Value Label.” Make sure it’s turned on and you will see the direct price.
Step 4: The amount you invest will now populate on the right hand side of the indicator with a number. That’s the exact dollar amount you invest in a disciplined manner no matter how large or small the number may seem.
Step 5: Get familiar with the indicator by opening the settings on the indicator itself. You will notice on the first tab it has a multiplier. If you increase it to 2, then the indicator will tell you to invest double the amount. If you input 10, then it will tell you to invest 10x the amount.
Step 6: Choose a Chart Timeframe and time of day to invest. If you choose to go with a once weekly investment then we recommend you increase your multiplier. If you choose a daily investment (and lack the necessary capital to invest large amounts daily) then we recommend keeping your multiplier down to lower numbers incase we see a lot of volatility. For most folks, once weekly on a 10x multiplier is most convenient. Set your chart to a weekly time-frame and increase your multiplier to 10. Then each week around the same time, you must invest.
Step 7: STAY DISCIPLINED. This method and tool only works if you invest the exact amount it tells you to invest over sustained periods of time.
Step 8: Enjoy Investing Made Easy 🙂
Sigma Spikes [CC]Sigma Spikes were created by Adam Grimes and this is one of the best volatility indicators out there. This indicator not only gives you positive or negative volatility but with my version I can identify any sudden changes from the underlying trend. Buy when the line turns green and sell when it turns red.
Let me know if there were any other indicators you wanted to see me publish!
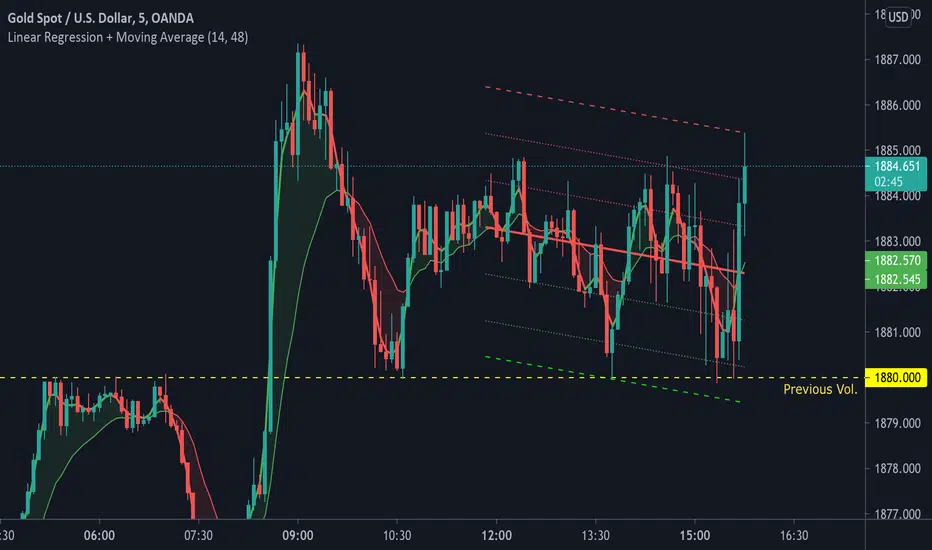
Linear Regression + Moving Average1. Linear Regression including 2 x Standard Deviation + High / Low. Middle line colour depends on colour change of Symmetrically Weighted Moving Average . Green zones indicate good long positions. Red zones indicate good short positions. (Custom)
2. Symmetrically Weighted Moving Average. Colour change depending on cross of offset -1. (Fixed)
3. Exponentially Weighted Moving Average. Colour change depending on cross with Symmetrically Weighted Moving Average. (Custom)
Intrangle - Straddle / StrangleIntrangle is an indicator to assist Nifty / Bank Nifty Option Writers / Sellers to identify the PE / CE legs to Sell for Straddle and Strangle positions for Intraday.
Basic Idea : (My Conclusion for making this Indicator)
1) Last 10 Years data says Nifty / Bank Nifty More than 66% of times Index are sideways or rangebound (within 1% day) .
2) Mostly, First one hour high and low working as good support and resistance.
Once First one hour complete, this indicator will show Strangle High (CE), Strangle Low (PE) and Straddle (CE/PE).
Straddle:
If you want to do straddle strategy, sell at the money strike (CE/PE) when price comes near to the straddle line (black line),
Strangle:
If you want to do Strangle strategy, sell Strangle High (CE) and Strangle Low (PE) when price comes near to the straddle line (black line). Both Strangle High and Low will be out of the money when price near to the straddle line (black line).
Adjustment: option adjustment to be done based on the price movement. Adjustment purely up to the user / trader.
Note1: If price not comes to near straddle line after first hour, better to stay light…
Note2: If first hour not giving wide High / Low, don’t use strangle strike based on this indicator. Straddle can be done any day with require adjustment / hedge. This Indicator is purely for education purpose, user / trader has to be back-tested before their start using it.
This indicator will work in Nifty / Bank Nifty only. Best Time frames are 3/5/15 Mins. This is purely made for Intraday
Happy Trading 😊

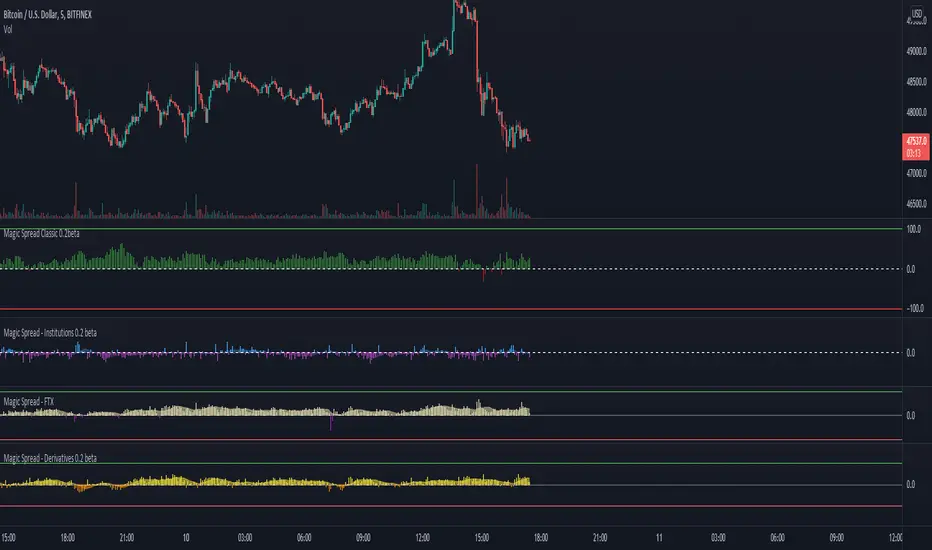
Magic Spread
Bullish above 0
Bearish below 0
Buy signal above 100
Sell signal below 100
The higher the number and the volume the stronger the signal is.
In extreme market behavior, counter trend signal are early sign of weakness that can take more or less time before reversing the trend.
Signal in the direction of the trend are more efficient.
Of course it work better as confluence, and should be used with other TA. Find support and resistance levels, and use this as confirmation.
e.g. :
A buy signal at support in an uptrend are very powerful.
A buy signal at support in large uptrend but a in a strong pullback can lead a significant bounce and forthcoming reversal but can take few LL before totally reversing.
A buy signal at resistance in an uptrend should mean imminent break-out but could be follow by a retrace / retest.
Coefficient of variation (standard deviation over mean)Shows the coefficient of variation defined as standard deviation over mean (for the specified window).
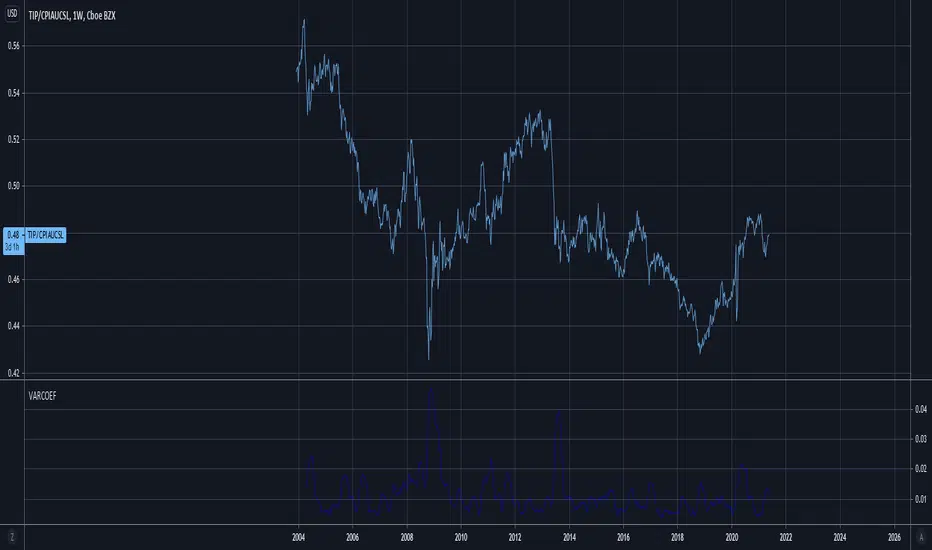
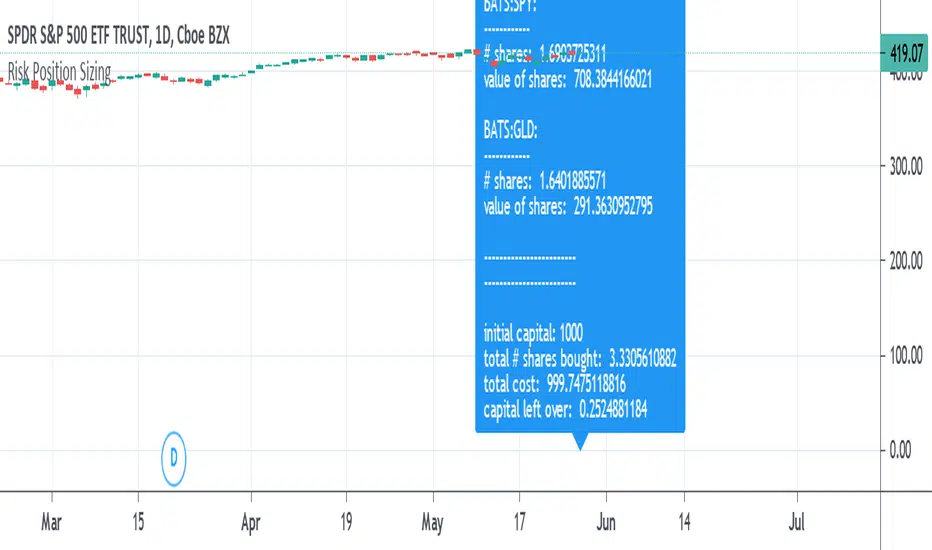
Risk Position Sizing tool using Coefficient of VariationA way to manage portfolio risk using relative standard deviation, also known as coefficient of variation. This tool tells you how much of each stock in shares and in value to buy adjusted for their volatility risk for a given starting account capital. A problem many people have is how to diversify an account and adjusting it for the risk involved in each equity. Many would put in an equal amount of capital value into each share but is it really equal if some equities have more risk than others? A solution is to adjust the portfolio by giving less weight to those that are more volatile or risky. It's done by using a starting percent of the account, preferably a small percent of it, and buying up shares with that same amount for each equity. Each equity will also be divided by the COV to risk adjust the portfolio by giving less weight to the more volatile stocks. This is done until as much of the initial capital in the account as possible is spent.
COV is how far away the price is from the mean or average. The further the price is from the mean the more risk or volatility there is. It uses standard deviation in its calculation. The problem with SD and ATR is that they are not relative to the past or to other equities to compare to. An application where COV can be used is risk portfolio management formulas. This does not take into account correlation or other equation parts in some portfolio management formulas but only the risk or volatility, the default volatility length is mostly arbitrary, and the lower risk stocks may end up being the slowest in performance.
The text label will show how many shares will be bought and how much value each equity will have. At the end it will show the initial capital that was started off with, the total shares bought, the total value of all the shares, and the amount of capital left over. If the sources are not blank then they will be used, to blank them you will need to reset the settings to default otherwise they might still be read. If you want to add more than the given 10 equity spaces to the portfolio then you will need to add in the code manually and add it to the chart. The denominator is perhaps the important part in these types of risk position sizing tools, you can change to other things such as risk-reward ratio instead of volatility or change the volatility type, etc.
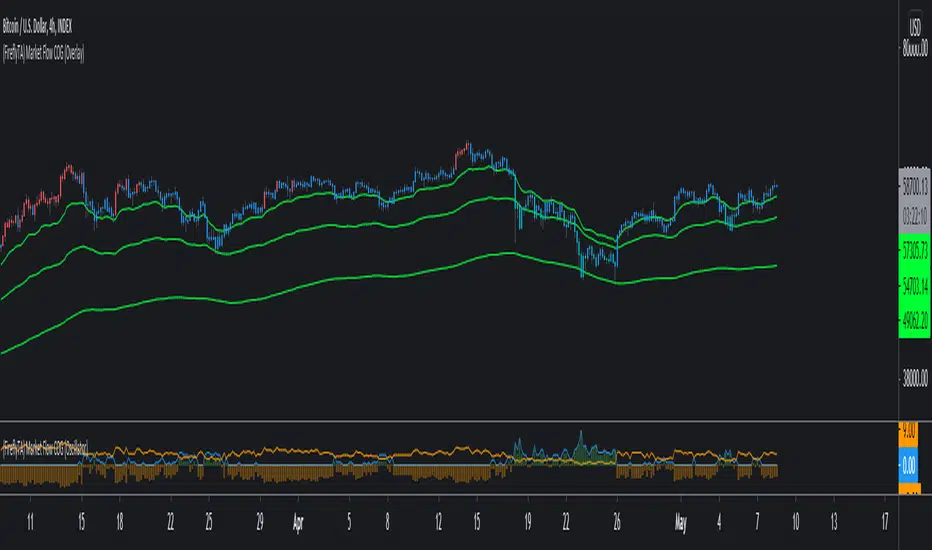
(FireflyTA) Market Flow COG (Overlay)Market Flow COG (Overlay)
Market Flow COG in the "Overlay" version offers you a variety of modules to do analysis on the market flow . I'm using my own definition of market flow since I'm actively doing scientific research on that topic and developing concepts and tools around it.
This indicator is best used together with Market Flow COG (Oscillator) , which is also public.
----------------------
About Market Flow
The market flow is a concept describing the directional force driving price movement that a market experiences based on term-specific (short-, mid- and long-term) momentum as well as dynamic range support and resistance.
In a strong uptrend for example, market flow is upwards, so dynamic range S&R; (i.e. Bollinger Bands) is flowing upwards, too. This is increasing the probability to see continuation after dips. In a shifting trend, it is possible to observe market flow still continuing upwards, because the the flow is only changing slowly. Momentum takes a while to run out and exert pressure into the other direction. This phenomenon can be observed on all timeframes in high-volume markets, even more so on the higher timeframes.
Given the complex nature of market flow , there is still a lack of tools available to properly examine it and to derive appropriate trading decisions.
----------------------
About Market Flow COG
This indicator allows you to look at various different aspects to market flow . Additional ones might be added in future updates. In this first release, the following are included. Browse the update notes below for further modules added later.
Center of Gravity (COG)
Deviation Bands
Trend EMAs
----------------------
About "Center of Gravity"
The COG is an entity that is pulling price back to it frequently (this is why it is called Center of Gravity) as the law of mean reversion dictates. Mean reversion can be loosely broken up into mean reversion on multiple timeframes, and the COGs are included for ULT (ultra low, 15-60m), L (low, 1h-4h), M (medium, 6h-12H) and H (higher, 1D+) timeframes. As this entity is a new development in TA there is still a lack of scientific evidence that it is reliable. However, if you look at the charts, you will notice that price action will respect this entity and circle around it on the appropriate timeframes most of the time.
The COG is similar to a Bollinger Band, it is using volatility as its main component. However, COGs are aggregated entities looking at more timeframes at the same time, so besides the Time X Volatility perspective that is provided by Bollinger Bands, this entity adds a third dimension by looking at multiple timeframes. The COG is the mean of all the BBs that are included in the calculation, which can be a large number. This makes a COG a meta-analytic entity that is more sensitive to market price action.
The COG helps you in identifying how far and for how long price has been overextended to one side beyond the means. In theory, the probabilities increase dramatically to see a mean reversion to the COG. Watching price interacting with the COG should make clear that the correlations are significant, however there might be differences based on the markets used. The COGs have primarily been tested with the BTCUSD market and for crypto in general.
A way to trade based on COGs is to look for weakness (if price is above the COG) or strength (if price is below the COG) in price action while it is approaching S&R.; If signs of accumulation or distribution arise, and the distance to the COG is meaningful (as well as being maintained for a few candles), it can provide additional backing for your long/short scalping and swing trading ideas. I'd recommend to always use the COG in combination with your knowledge on price action.
By using all COGs at the same time for ULTF, LTF, MTF and HTF you can get a feeling for where price is in the context overall market flow .
----------------------
Deviation Bands
The Deviation Bands are fib-based deviations of the COG that is chosen with the 'mode' setting (i.e. LTF). When this module is enabled, the deviation bands are plotted around the COG of that timeframe mode. The deviations can be adjusted manually as well by changing the values in the indicator UI. The main purpose of these bands is to identify the structure of price movements in relation to the COG distance, i.e. analyzing how long price can maintain levels in an area >X or
[kai]mATRThis indicator is for calculating the volatility of any interval
mTR (green line): TR is extended to calculate multiple bars at once with magnification setting.
mATR (red line): ATR is extended to calculate multiple bars at once with magnification setting.
dev (blue line): standard deviation
If you turn on "divide source" in the settings, it will be the price volatility.
dev will be the same as BBW
このインジケーターは任意の区間のボラリティを計算するための物です
mTR(緑線) : TRを倍率設定で複数のバーをまとめて計算する用に拡張したものです
mATR(赤線) : ATRを倍率設定で複数のバーをまとめて計算する用に拡張したものです
dev(青線) : 標準偏差
設定で「divide source 価格変動率」をONにすると価格変動率になります
devはBBWと同じになります

Projected Bollinger Bands - Quadratic RegressionBased on the work of Alex Groove : https://www tradingview com/script/YnoXd2AY-forecasting-quadratic-regression/
and also based on https://www tradingview com/script/YnoXd2AY-forecasting-quadratic-regression/ by capissimo
Notes:
1. This Bollinger Bands uses the QREG as its middle line (not MA as the original Bollinger Bands) so this should be acknowledged.
2. This indicator forecasts 3 candles (periods) ahead.
3. The label's position is quite messy, so you need to adjust the chart zoom in order to make the indicator doesn't overlap anything.
4. You need to manually set the time frame in the indicator settings because i'm not able to make the indicator recognizes it automatically
I'm trying to make the Bollinger Bands Forecasting from Quadratic Regression, and i'm really sure that there are a lot of mistakes here and there, so i 'm hoping corrections coming from you guys...
CHEERS!!!

Bollinger Oscillator Extreme + ADXSHORT DESCRIPTION
This study is an improved, flexible, fully-customizable version of the one proposed by Steve Karnish of Cedar Creek Trading, who aimed to create an oscillator based on Bollinger Bands , with the goal of spotting divergencies that occurs outside the bands yet providing valuable entries on the crossings trough a smoothed signal.
IMPROVINGS
Made a Zero Line normalization, where 0 is essentially the BBs basis MA, whereas +100 -100 represents those classic 2 Stdev;
Added two levels of interest based on golden ratio working with the two above to get such an Overbought/Oversold Area. Those levels slightly move apart from a 1.5 Stev.
Made possible to set EMA as basis average instead John’s classic SMA ;
While I kept the original “CCT Oscillator” as a reliable divergence-hunter, I get from it the “Smoothed Oscillator” with a triple average smoothing. You can only play with the first smoothing step by “Oscillator Smoothing” while following are fixed.
Despite little differences occurs, you can consider the Smoothed Oscillator itself as the Signal on the original CCT Oscillator.
Derived the “Signal” that works on the Smoothed Oscillator. You can play with different smoothing length.
Add a customizable ADX which helps weighting trend strength, weakness, choppiness . (mirrored on the Zero Line for aesthetics only)
Add a “BB Width” representation so as you can stay in touch with BB volatility , squeezes, and so on. It is a non-analitic data (not 100 normalized). Use “BBW Multiplier” to match visual reading.
HOW TO USE (NOT TO USE)
The indicator works well when strong directional moves occurs and even better in a sideways market (wide trading range). So there are three main evaluable application:
During an Up-trend, spotting negative divergencies on CCT Oscillator in the Oversold Area (better above +100) tell us that a correction or a reversal will probably occur. It’s time to consider a stop profit or look for a good re-entry after the pull-back.
During a Down-trend, spotting positive divergencies on CCT Oscillator in the Overbought Area (better below -100) tell us that a correction or a reversal will probably occur. It’s time to consider a stop profit or look for a good re-entry after the pull-back.
In a Sideway Market, look for both positive and negative divergencies on CCT Oscillator in the Oversold/Overbought Areas, trading in the range, better with the confirmation from such a Stochastic and a Volume based indicator.
>>> If you're not a pro you would better left counter-trend and mean-reversal setups to “trading titans”. <<<
“OK! And what about signals!?” you tell. :D There are many ways to get signals from crossings and it’s up to you to find what work better to you needs. You can start testing the original Steve Karnish method, using the “CCT Oscillator”/“Smoothed Oscillator” crossings (a 9 period smoothing on a 20 period BB could be a reasonable begining).
Whipsaws makes it difficult? Give a try to “Smoothed Oscillator”/“Signal” crossings. Observe how the price act when “Smoothed Oscillator” penetrate Overbought Area from above or Oversold Area from below after a divergence took place.
Test a lot BB Length-Signal Smoothing combos.
Test with EMA instead using John’s SMA .
Never forget the divergencies’ reliability is time-correlated yet timeframe-correlated too (the longer the better!).
Never forget that the Zero Line (as the basis of BBs) tends to act as resistance/support.
I do the best I can to realize such a flexible tool. Now is up to you to find what better suit your needs.
MEDTRONIC Daily
MORE SUGGESTIONS
This script won’t be an out of the box stategy as no other indicator by itself, tough if you tell it could become a piece of the puzzle.
So that his is basically a price-based indicator you would better consider to pair it with a volume-based or an absolute-momentum based one .
Most important is you first focus on the market in order to detect strong uptrend/downtrend or sideways, better using a supertrend, moving averages (or whatever works better for you) paired with a momentum indicator .
As literatures explains Bollinger Bands (such many others indicators) do their best in ranging markets, yet this version could be as useful when a strong directional move takes place.
THIS WORK TAKES HOURS OF RESEARCH, DEVELOPMENT, TESTING…
SHARING IS INTENDED FOR EDUCATIONAL PURPOSE ONLY. NOT FOR PROFESSIONAL USE.
WILL APPRECIATE ANY FEEDBACK, QUESTION, SUGGESTION! (*)
(*) Please don’t ask me for “magic settings” which do not exist at all, nor for “kaleidoscopic effects” cause I’m a big fan of such a minimalistic yet professional layouts.
FOLLOWUP TO CHECK UPDATES!

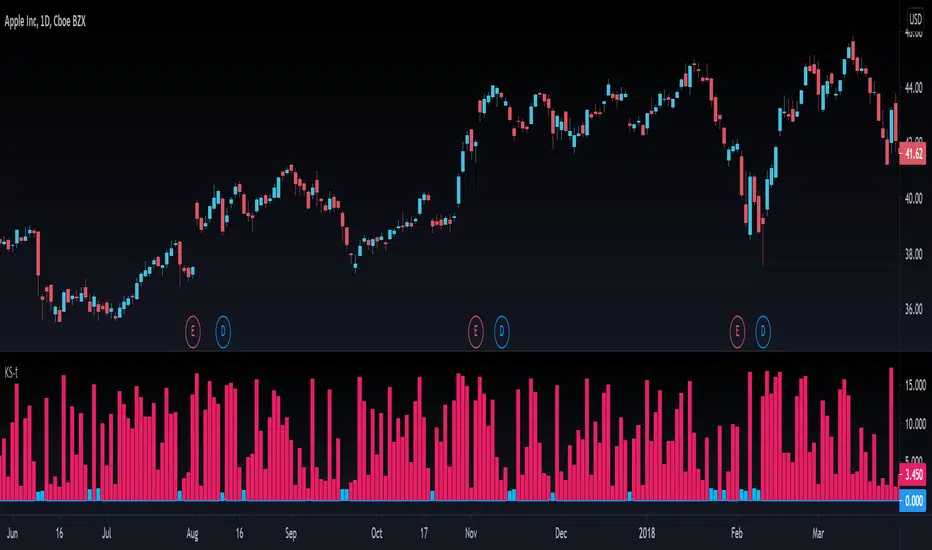
Kolmogorov-Smirnov TestThe Kolmogorov–Smirnov test aims to tell you if the distribution of prices (or log returns) tends to follow a normal distribution or not. You can read about this test on Wikipedia . It seems to be a basic but trusted measure in the quantitative trading world.
When KS-t columns are blue, then it's safe to assume normal distribution. When they are red, the normal distribution assumption is proven wrong by the magnitude of the KS-t value.
In the plotting tab of the script, you can activate another option that displays the probability of the distribution being actually normal. It's values are bounded between 0 and 1, like all probabilities.
This test can be useful when using statistical concepts for trading markets, like standard deviations, z-scores, etc because they all depend on the assumption of prices (or log returns) being normaly distributed.
If you see something wrong, don't hesitate to message me.
Happy trading to all.
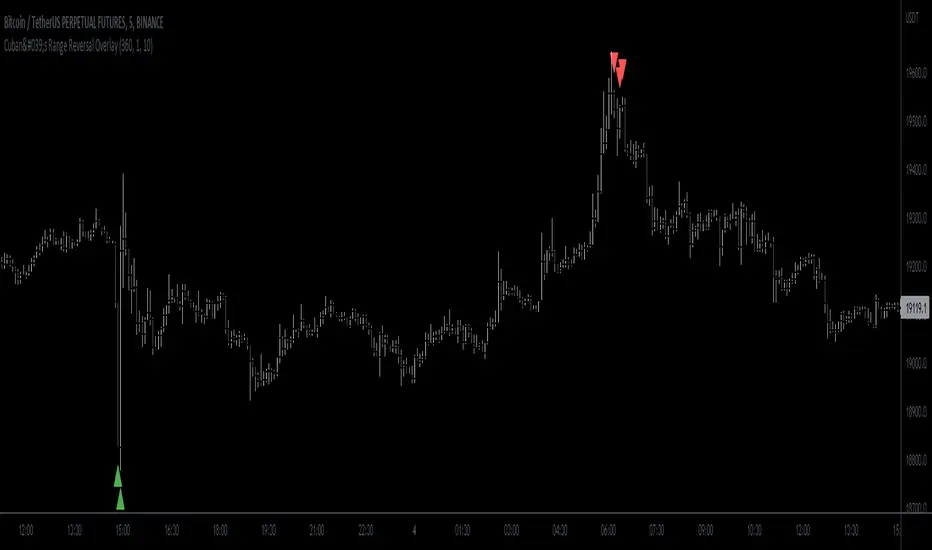
Cuban's Range Reversal OverlayBeen a minute since a public script!
This one looks at the range and recommends potential reversal depending on degree of overextension.
Originally intended for low timeframe short time horizon reversals but works well on higher timeframes as well.
Oscillator included in the image so you can see under the skirt and check what's happening.
Best Volume Indicator - BTCIn order to make more sense of trading volume in crypto …
Based on the Better Volume Indicator (curtesy of Emini-Trading (emini-watch.com) and the TradingView Adaption by LazyBear ().
My tweaks/adaptations:
- altered the calculation of low volume (c11) in the LB adaptation since it represents the original code better (in my opinion)
- takes volume of multiple exchanges into consideration
- added standard-deviation bands in order to identify peak amount of trading volume
- added three EMA's in order to assess the amount of trading volume even better
- changed the color coding of the original Better Volume Indicator (my preference)
volume climax up = green (instead of red)
volume climax down = red (instead of white)
low volume = yellow
churn = blue (instead of green)
climax + churn = purple
"normal" volume = gray (instead of cyan)

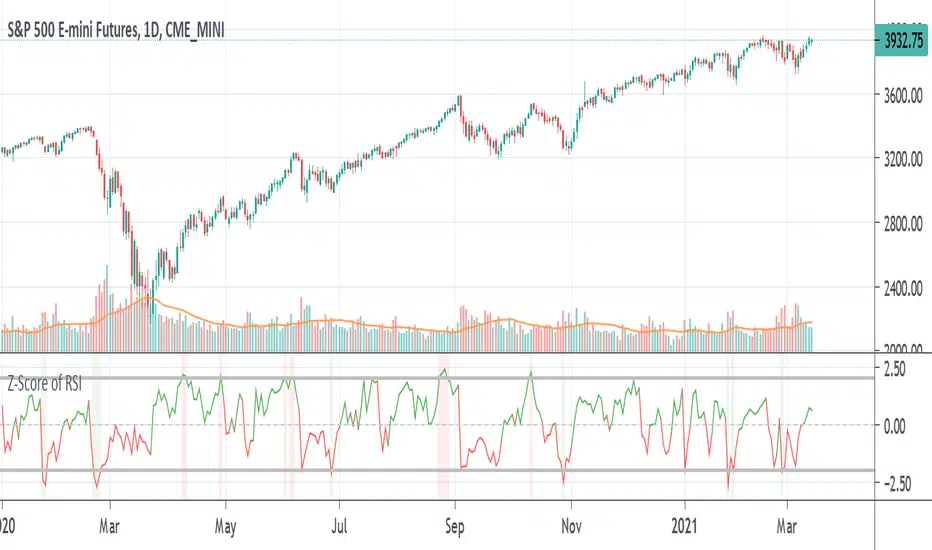
Z-Score of RSIA way to see whether RSI is overbought or oversold inside its Bollinger Bands in the form of an oscillator. Z-score tells you how far the data is from the mean in terms of standard deviations. The numbers shown in the indicator are the number of standard deviations away from the average or mean. Like Bollinger Bands, if it is above the standard deviation border lines then it is considered to be outside the distribution or Bollinger Band. If it is above the upper border line then is it is overbought, if it is below the lower border line then is is oversold.
Example of how standard deviation works: 1 standard deviation contains 68% of the data, 2 SD (the default for BB) contains 95% of data, 3 SD for 99%, etc. If the data goes past that, it is considered to be outside the distribution. In statistics, data that is within the distribution is considered to be "significant".
The z-score line is colored green if it is above zero and red if it is below zero. Above zero means that the RSI is above the average line or the middle line of the Bollinger Bands, and vice-versa if it is below. A red vertical bar is shown when the the z-score is above the upper border line to show that it is overbought and a green vertical bar is shown when the z-score is below the lower border line to show that it is oversold. This is the equivalent of when the RSI is above and below its Bollinger Bands.
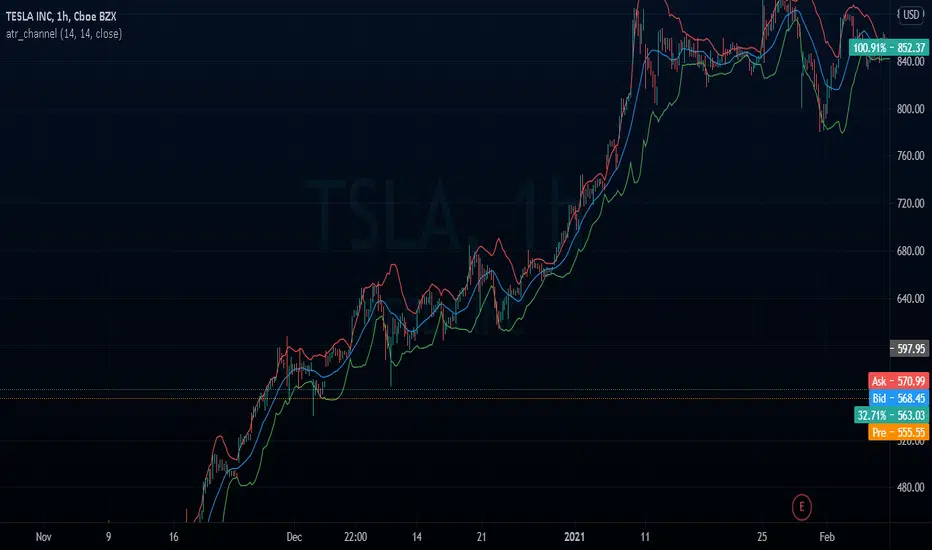
atr_channelThe original bollinger bands have a fixed deviation of 2%, this channel calculates the ATR % (Atr Percentage) and places the upper and lower bands
Price Action IndexI've created a simple oscillator which I think does a good job of easily showing you when price is worth watching or not. I think all too often you get stuck looking at something like an RSI and end up trading noise.
From my observations and experiences, I've found that there are 2 major catalysts for price movement--
Price is either trending and reaches a top or bottom, or
Price is consolidating and ready to make a move in some direction
These movements can be seen quite well from a Bollinger Band, which is what mostly gave me the inspiration. When I watch a chart with a BB on it I see that either you're looking to trade price moving out of a squeeze or riding price up/down the band until it crosses over and makes a move to the moving average.
My solution was to multiply the direction of price by the strength of its deviation.
Price gets converted into a signal between -1.0 (bottom of the range) and 1.0 (top of the range)
Standard Deviation gets converted into a stochastic signal between 0 (next to no deviation from mean) and 100 (highest deviation in lookback)
These 2 get multiplied by each other
The result tells you if price action is trending bullish and if its approaching max strength (perhaps Overbought), example: Price is hitting highs (1.0) and deviation is also at its highest (100) = 100, opposite for bearish
Result can also tell you if price is at the top of the range but the deviation is so tiny and we're mostly pinned to the mean (1.0 * 5 = only 5)
How to Trade this Indicator--
If the indicator is stuck near the middle and purple:
- Don't make directional trades or you'll be eaten alive by the chop
- Good idea to sell options, Iron Condors/Butterflies, etc
- Wait for a move to breakout --> the purple will fade away and give way to a direction
--- As in all trading scenarios, be mindful of fakeouts/short moves to one direction that very quickly get reversed
If the indicator is heading higher:
- This would indicate there is a bull trend going on, get long
- If we are reaching the overbought area, this is an ideal place to take profits or look at spreads like Bearish Call Spreads (sell calls)
- I think you can make your own determination of when to sell by either selling when we're in the overbought area (if it reaches there) or staying bullish so long as it is above the zone
If the indicator is heading lower:
- Bear trend, shorting is possible
- Can use this as a contrarian signal to buy lows
A couple of charts with the indicator and a purple squeeze box I've drawn (can sometimes get noisy in real-time, but hindsight is 20/20)--
Bitcoin on Daily with default 20 length
Gamestop on 30 minute time frame with 100 length
Please feel free to use this indicator for your trading or your own indicators. This particular script is very stripped down/bare bones from what I have been working on as an ongoing project. If TradingView ever returns scripts you can sell, I would probably open that up for a small premium.

Origin VWAP: OVWAPDraw a VWAP support/resistance line anchored to the origin of the data series (like a daily VWAP, but from the beginning of time, never resetting).
Ideally the origin would be the first bar after the IPO. Tradingview (or your connected broker) doesn't always have a complete dataset, and in that case the OVWAP will be 'wrong', but converging to the correct value over time.
You can try to simulate this with the built-in VWAP indicator but it has several bugs and limitations. Firstly, the longest time period is century, but it is not 100 years, ie. a rolling century but the beginning of the century: 21 years ago. Secondly, even if your dataset is less than 21 years, if you use a lower time frame then the built-in VWAP's origin becomes the left-most loaded bar (about 5,000 bars ago) - it will draw the wrong value. The new Anchored VWAP drawing tool can't be used on lower time frames as it won't draw the line at all unless it sees the point where you anchored it.
You may want to cut 'n paste this code to use in some larger strategy. Unfortunately that's probably not possible. This script uses the 'resolution=' option of 'study()' set to '1W', so the whole script runs at the 1 week resolution. You would think it would be possible to instead use the 'security()' function to request data at the '1W' resolution, but it just resamples the current data set and so is limited to the rightmost 5,000 bars.
Look in the options to enable standard deviation lines.

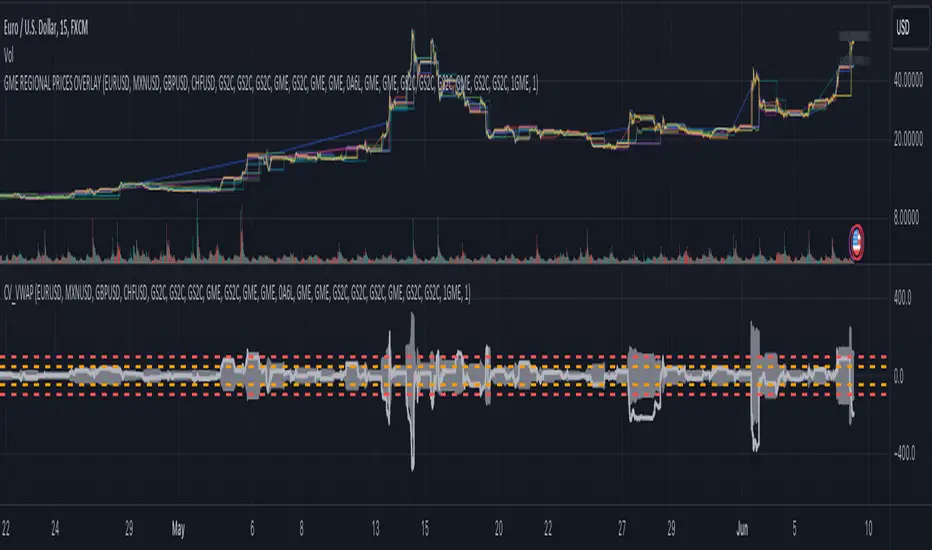
CV_VWAP_GMECoefficient of variance GME ‰
Gray area: Regional price variance of GME in per milles
Light gray thick line: NYSE:GME deviation from global mean
1. Select a chart 24-hour ticker like FX_IDC:USDEUR
2. Select a timescale (5 min, 15 min, ...)
3. Monitor the regional price variance
Exchanges included: NYSE, XETR, BMV, FWB, SWB, BITTREX, FTX
Currency conversion: Forex
Adapted from Detecting the great short squeeze on Volkswagen, Godfrey, K. (2016, February 18).
Coefficient of Variation - EMA and SMA StDevYet another way to try and measure volatility. An alternative to using ATR is Standard Deviation, it can be used to measure volatility or what is also known as risk. SD measures how dispersed or far away the data is from the mean. It's commonly seen in risk management formulas or portfolio diversification formulas. The problem however is that the numbers that ATR and SD give off from one equity might not be relative to others or its own past. For example, SPY can give a large number despite not being as volatile as other equities while others being compared to can have smaller volatility numbers and still be more volatile looking.
A solution I thought of is to use percentages that are relatable to different equities. I found out another name for this idea comes from statistics and is known as coefficient of variation, also known as relative standard deviation. This helps see the volatility as a percentage and not just a number that only relates to what is being seen at the moment. I put in a border line on the zero level to see where zero is at but also to edit in case there is such a thing as a percentage number that can be too high or too low for volatility to be looked at if needed. The average and standard deviation formulas can use either simple moving average or exponential moving average.

Enhanced Sigma by Cryptorhythms [CR] - AdvancedEnhanced Sigma - Advanced Volatility-Normalized Returns Analysis
The Enhanced Sigma indicator measures volatility-adjusted price returns to identify statistical extremes, regime changes, and mean reversion opportunities. By normalizing returns against their standard deviation, the indicator reveals when markets are experiencing unusual moves relative to recent volatility—highlighting potential exhaustion points, capitulation events, and statistical anomalies.
█ OVERVIEW
Sigma (σ) represents how many standard deviations current returns deviate from normal behavior. Readings beyond ±2.0 indicate statistically unusual moves, while extreme readings beyond ±3.0 occur less than 1% of the time under normal distribution. This version adds multi-layered analysis including regime detection, multi-timeframe confirmation, and adaptive thresholds.
█ KEY FEATURES
Return Calculation Methods
The indicator supports multiple return calculation approaches:
- Simple Returns — Standard percentage change calculation
- Log Returns — Logarithmic returns for better statistical properties
- Geometric Returns — Square root based calculation
- Percentage Returns — Scaled percentage format
Volume Weighting
Optional volume weighting emphasizes high-volume moves while dampening low-volume noise. When enabled, returns are weighted by normalized volume to give more significance to moves occurring on institutional participation.
Threshold Methods
Two threshold calculation approaches:
- Fixed Thresholds — Manual static levels
- Percentile-Based — Adaptive thresholds calculated from historical distribution
Percentile-based thresholds automatically adjust to changing volatility regimes over configurable lookback periods.
Statistical Significance Testing
Built-in t-test functionality determines whether current sigma readings are statistically significant or merely random noise. Configurable confidence levels (80-99.9%) filter out insignificant moves. Non-significant readings are visually dimmed.
Multi-Timeframe Analysis
Analyzes sigma across multiple timeframes simultaneously. Confluence signals trigger when all timeframes (current, 3x, 5x) align at extremes—indicating stronger conviction and reduced false signals. MTF sigma values are plotted as reference lines.
Regime Detection
Automatically classifies current volatility environment into four regimes:
- Low Volatility — Market in compression
- Normal — Standard volatility conditions
- High Volatility — Elevated movement
- Extreme — Unusual volatility expansion
Regime classification uses percentile ranking and statistical deviation analysis.
Adaptive Threshold System
Three methods for automatic threshold adjustment:
- ATR-Based — Adjusts based on Average True Range ratio
- Volatility Regime — Tightens in low volatility, widens in high volatility
- Range Expansion — Responds to recent sigma range changes
When enabled, thresholds dynamically scale with market conditions to maintain consistent sensitivity.
Cluster Analysis
Detects and scores clusters of threshold breaches within rolling windows. High cluster scores can indicate capitulation or exhaustion phases. Visual labels "C" show active clusters.
Mean Reversion Signals
Generates entry and exit signals based on extreme sigma readings returning to mean:
- Long Entry — Triggered on oversold extremes
- Short Entry — Triggered on overbought extremes
- Exit Signals — When sigma normalizes or time-based exit reached (marked as gray "X")
Optional statistical significance filter ensures only high-probability setups generate signals. Position tracking displays unrealized P&L.
Distribution Histogram
Displays sigma value distribution as a horizontal histogram showing Point of Control (POC)—the most frequently occurring sigma level. Configurable bin size and lookback period.
Statistics Dashboard
Real-time table displaying:
- Current sigma value and percentile rank
- Statistical measures (mean, std dev, skewness, kurtosis)
- Volatility regime classification
- Extreme event frequency
- Bars since last extreme
- Position status and P&L (when mean reversion enabled)
█ VISUAL ELEMENTS
Threshold Lines
- Aqua/Cyan lines — Positive (high) thresholds
- Fuchsia/Magenta lines — Negative (low) thresholds
- Solid lines — Short-term dynamic thresholds
- Circles — Long-term dynamic thresholds
- Crosses — Percentile-based static thresholds (when enabled)
Sigma Histogram
Primary histogram uses momentum-based coloring:
- Purple shades — Negative sigma (declining)
- Cyan shades — Positive sigma (advancing)
- Darker shades indicate weakening momentum
- Brighter shades indicate strengthening momentum
Statistically significant threshold breaches are highlighted with intensified colors.
Shape Markers
- Small triangles — Statistically significant threshold breaches
- Diamonds — Multi-timeframe confluence signals
- Large triangles with text — Mean reversion entry signals (LONG/SHORT)
- X markers — Mean reversion exit signals
- Labels — Cluster detection alerts
█ ALERTS
The indicator includes comprehensive alert conditions. Use confirm on bar close if repainting is enabled.
█ HOW TO USE
Identifying Extremes
Sigma readings beyond ±2.0 indicate unusual moves. Look for:
- Threshold breaches with statistical significance markers (triangles)
- Multi-timeframe confluence (diamonds) for stronger signals
- Cluster formation indicating potential exhaustion
Regime-Aware Trading
Use regime detection to adjust expectations:
- In Low Volatility regimes, smaller sigma moves may be significant
- In Extreme regimes, higher thresholds prevent overtrading
Mean Reversion Strategy
Enable mean reversion signals for systematic entries:
- LONG signals appear after statistically significant oversold extremes
- SHORT signals appear after statistically significant overbought extremes
- Exit signals trigger on return to mean or time-based stops
Distribution Analysis
Use the histogram to identify:
- POC level — Where sigma spends most time (equilibrium)
- Current position relative to distribution
