Moving Average Compendium===========
Moving Average Compendium (16 MA Types)
===========
A selection of the most popular, widely used, interesting and most powerful Moving Averages we can think of. We've compiled 16 MA's into this script, and allowed full access to the source code so you can use what you need, as you need it.
-----------
From very simple moving averages using built-in functions, all the way through to Fractal Adaptive Averages, we've tried to cover as much as we can think of! BUT, if you would like to make a suggestion or recommendation to be added to this compendium of MA's please let us know! Together we can get a complete list of many dozens of types of Moving Average.
Full List (so far)
---
SMA - Simple Moving Average
EMA - Exponential Moving Average
WMA - Weighted Moving Average
VWMA - Volume Weighted Moving Average
DEMA - Double Exponential Moving Average
TEMA - Triple Exponential Moving Average
SMMA - Smoothed Moving Average
HMA - Hull Moving Average
ZLEMA - Zero-Lag Exponential Moving Average
KAMA - Kaufman Adaptive Moving Average
JMA - Jurik Moving Average
SWMA - Sine-Weighted Moving Average
TriMA - Triangular Moving Average
MedMA - Moving Median Average
GeoMA - Geometric Mean Moving Average
FRAMA - Fractal Adaptive Moving Average
Line color changes from green (upward) to red (downward) - some of the MA types will "linger" without moving up or down and when they are in this state they should appear gray in color.
Thanks to all involved -
Good Luck and Happy Trading!
Sma

Historical Volatility Percentile + SMAHistorical Volatility Percentile tells you the percentage of the days from the past year (252 trading days) that have lower volatility than the current volatility.
I included a simple moving average as a signal line to show you how volatile the stock is at the moment.
I have included simple colors to let you know when to enter or exit a position.
Buy when price higher than EMA & historical volatility higher than SMA
Sell when price lower than EMA & historical volatility higher than SMA
Please let me know if you would like me to publish any other indicators! I always love to hear from you guys.

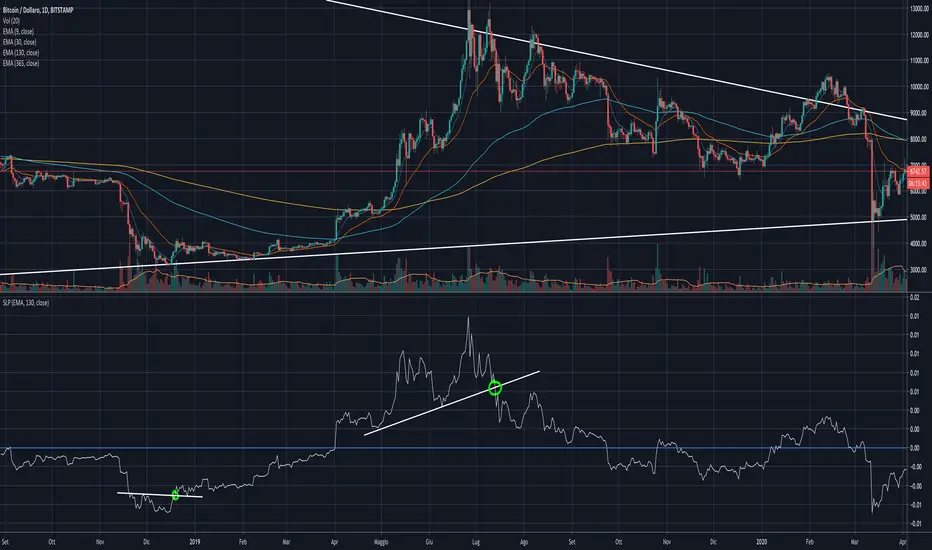
Moving Average SlopeA simple calculation and plotting of the slope of a Moving Average.
You'll be amazed looking at how accurate it is signaling early entries and exits from trend follower positions, just by applying some basic TA to it (support, resistance, trend lines).
Have a look:
In the settings, you can choose to use it on EMA on SMA, and the length of the MA involved.
I recommend using it on a medium-long sampling MA, to minimize noise.
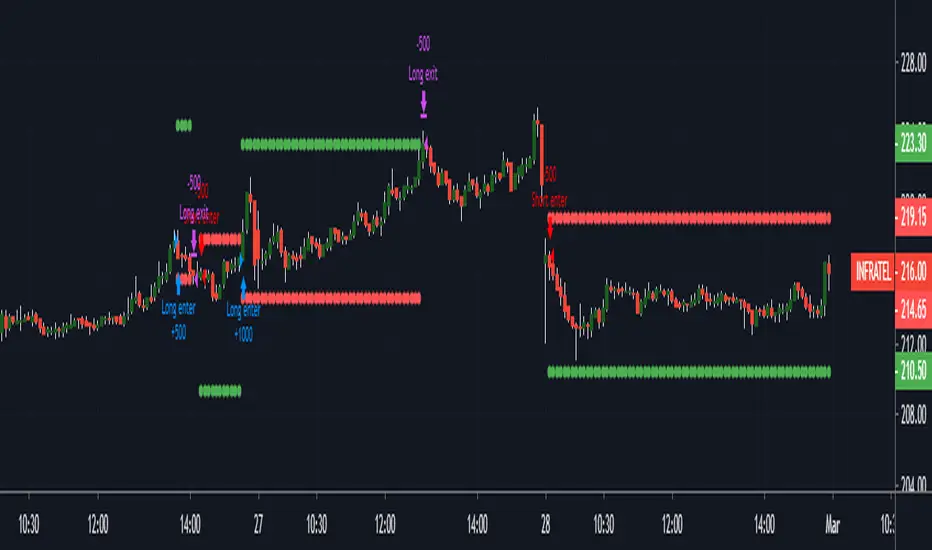
MARUSIA TRADING STRATEGIES [VCRYPTO]Description of MARUSIA TRADING STRATEGIES
«MARUSIA» is a compilation of several strategies.
You may choose the one which best suits your trading habit from options menu.
The strategies are based on indicator’s and bar’s closing level analysis on different timeframes.
At the time being there are 3 types of strategies for BTC on 1H and 3H tf.
+++ BTC 1H 90% Success +++ (Beginner)
Instrument - BTC, timeframe – 1H, exchange – Bitmex.
The advantage of the strategy is a high quantity of profitable trades (90% at the time of publishing).
The Trading View backtest results from 2019:
+ 303% net profit
+ 90% profitable trades
+ 6% drawback
+++ BTC 1H Mega Scalper +++ (Intermediate)
Instrument - BTC, timeframe – 1H, exchange – Bitmex.
The advantage of the strategy is more frequent trades with a good probability of success.
The Trading View backtest results from 2019:
+ 792% net profit
+ 64% profitable trades
+ 5% drawback
+++ BTC 3H Mega Scalper +++ (Expert)
Instrument - BTC, timeframe – 3H, exchange – Bitmex.
The advantage of the strategy is more frequent trades with a good probability of success.
The Trading View backtest results from 2018:
+ 1637% net profit
+ 79% profitable trades
+ 4,4% drawback
HOW TO USE
1. Choose the strategy from the strategy’s option menu on the chart. Pay attention to the instrument and timeframe you are using the selected strategy for.
2. Wait until you see green (above bar) or orange (below bar) label. To receive an alert when these labels (or signals) appear on the chart use ALERT INDICATOR for this strategy.
3. On the opening of the next bar enter the position if the label on the previous bar hasn’t disappeared. Green – for Buy, orange – for Sell. In this case you will see Buy/Sell signal on the chart.
4. Putting TRAILING STOPS
4.1. You should put a trailing stop when the price moves to profit up or down for 1% from your entry. For example, if you are long at 7255 USD and price moves up to 7328 USD (7255*1.01), put trailing stop with a trailing value 0,4% of your entry price, which is 29 USD (7255*0.004).
4.2. Every time when there is a long or short position, you may see a green info label with entry price, trail stop activation level and trail value. You may use this information instead of making a calculation by yourself. Only if your entry is the same as in the label.
5. Position closing maybe by reaching your trailing stop (in this case you may reenter the position on the next bar, if there is a signal label as per step 2 on the bar where your trailing stop is triggered) or when there is a signal for opposite direction.
6. If the signals appear differently than described as above, just refresh the website of Trading View. This happens because mostly take profits are shown only after the current bar is closed.
• The Buy/Sell signal label may move up or down on the bar with price’s movement. Don’t worry it doesn’t mean that your entry is changing.
• The lines on the chart are weekly price levels – the price levels of the previous week –
Green – open, Red – close, Blue – high, Brown – low, Black – hl2 (average of high and low). You may use them as support and resistance levels.
***
+ Trading View backtest results
+No repaint
+ Several strategies to choose which suits your trading habit
+Free testing
+Support with a call
Pm to get access to the strategy.
____________________________________________________________________________
Описание к стратегии "MARUSIA TRADING STRATEGIES "
Сборник нескольких стратегий серии "Marusia"
Выбор конкретной стратегии осуществляется из удобного меню
Основа наших стратегий - совмещение индикаторного анализа и анализа уровня закрытия свечей на разных временных интервалах (анализ уровней).
+++ BTC 1H 90% Success +++ (Beginner)
Стратегия работает на инструменте Bitcoin (BTC) по котировкам биржи BITMEX на 1 часовом таймфрейме (1H).
Основное преимущество данной стратегии - супервысокая успешность сделок (более 90% на момент публикации).
Данная стратегия представляет собой гибрид среднесрочных стратегий по частоте сделок (с 2019 по 12.04.2020 - 204 сделки, в среднем одна сделка раз в 2 дня) и элемент высокочастотных (скальп) стратегий - необходимо выставление использование скользящего стоп-приказа (trailing stop-loss), расчетные данные по которому появляются прямо на экране при открытии сделки.
Статистика по данной стратегии, подтвержденная бэктестом в Trading View
С 2019 года до момента публикации стратегии бектест показывает следующие данные:
+ 303% чистой прибыли
+ 90% успешных сделок
+ 6% макс. единовременная просадка
+++ BTC 1H Mega Scalper +++ (Intermediate)
Стратегия работает на инструменте Bitcoin (BTC) по котировкам биржи BITMEX на 1 часовом таймфрейме (1H)
Основное преимущество данной стратегии - высокочастотные сделки с хорошей вероятностью успеха.
С 2019 года до момента публикации стратегии бектест Trading View показывает следующие данные:
+ 792% чистой прибыли
+ 64% успешных сделок
+ 5% макс. единовременная просадка
+++ BTC 3H Mega Scalper +++ (Expert)
Стратегия работает на инструменте Bitcoin (BTC) по котировкам биржи BITMEX на 3 часовом таймфрейме (3H)
Основное преимущество данной стратегии - высокочастотные сделки с хорошей вероятностью успеха
С 2019 года до момента публикации стратегии бектест Trading View показывает следующие данные:
+ 1637% чистой прибыли
+ 79% успешных сделок
+ 4,4% макс. единовременная просадка
***
Инструкиция по использованию:
1. Вы открываете график с включенной стратегией. Обратите внимание на инструмент и таймфрейм стратегии.
2. Ожидаете появления на графике зеленого (снизу) или оранжевого (сверху) флажка.
Для получения уведомления появления значков (сигналов) используйте АЛЕРТНЫЙ ИНДИКАТОР для данной стратегии.
3. На открытии следующей свечи входите в сделку, если флажек из п.2 остался и не пропал (зеленый флажек - покупка, оранжевый - продажа)
4. Выставление trailing stop-loss
4.1 Trailing stop-loss выставляется, когда цена прошла 1% в профит от цены выхода в сделку (например: покупка 7255 и когда цена будет 7328 (7255*1,01) выставляется плавающий стоп-лосс (trailing stop-loss) в размере 0,4% от цены входа "29" (7255*0,004).
4.2. Как только будет закрыта свеча, на которой Вы вошли в сделку - вы увидете значения из п.4.1 на экране рядом с графиком (вы можете их использовать без самостоятельного расчета, но тогда есть риск, что если цена на свече входа достигнет значения из п. 4.1 - то сделка закроется, а вы это увидите только на следующей свече, когда значение цены может быть менее выгодное)
5. Выход из сделки осуществляется либо по trailing stop-loss (тогда вы можете перезайти в сделку на открытии следующей свечи, если на свече, на которой произошло закрытие по trailing stop-loss появились флажки из п.2), либо по появлению противоположного флажка, тогда вход в сделку, в соответствии с п. 2 и 3
7. Если Вы увидели, что сигналы отличаются от написанного в данной инструкции - просто обновите страницу с Trading View в браузере и все встанет на свои места.
* На свече захода в сделку сигнал "buy/sell" может "плавать" по свече, но если Вы выполнили п.1-3 Вам неочем беспокоиться. Не обращайте на него внимание.
***
Основные отличия от стратегий наших коллег:
+ Результаты бэктеста в платформе Trading View – прозрачная статистика по сделкам, которую вы можете посмотреть самостоятельно
+ Построен на принципах non-repaint basis – сигналы не исчезают (при правильном соблюдении инструкции по использованию)
+ Каждая стратегия серии построена на своем уникальном принципе - вы можете выбрать для себя оптимальный набор стратегий
+ Бесплатный тестовый период
+ Поддержка с возможностью организации телефонного звонка
Для предоставления доступа к данной стратегии - пожалуйста пишите в личные сообщения. Мы быстро с Вами свяжемся.
6 SMA&look back 20SMA strategy6 SMA&look back 20SMA strategy
The moving average is calculated based on historical prices and is a backward indicator,Unable to forcast future prices.
But the moving average still represents the price trend, so we can forcast by moving average.
Each point of the 20-day SMA is calculated based on the closing price of the past 20 days.
Therefore, we can know that the closing price of the first 20 days directly affects the latest point of SMA.
The last 20 days are the prices included in the calculation, which directly affect the trend of the latest points.
For example,if the day before the 20th is a sharp fall, the latest SMA becomes an upward trend;If the day before the 20th is a sharp rise, the latest SMA becomes a downward trend,it showing the opposite trend
Recommended to use the daily trend.
Good Luck
移動平均線是根據歷史價格計算,屬於落後指標
但是移動平均線仍代表價格趨勢,因此我們可以通過移動平均線進行預測。
20天均線的每個點都是基於過去20天的收盤價計算的。
因此,我們可以知道前20天的收盤價直接影響SMA的最新點。
最近20天是計算中包括的價格,它直接影響最新點的趨勢。
例如,如果20日之前的一天是急劇下跌,則最新的SMA成為上升趨勢;如果20日之前的一天是急劇上漲,則最新的SMA成為下降趨勢,呈現相反的趨勢。
參考老王對SMA扣抵值的簡易版應用
使用20MA的扣抵蹺蹺板來判斷今日可能是UP或DOWN
建議使用日線
祝好運
CBG MultiAverages ColorsThe latest version of my multiple moving averages. Now includes up to 14 moving averge lines plus a separate slow and fast moving average that can be assigned a different MA type.
In the screen shot is the fast/slow set to Hull with 15/50 periods. It is overlaid on top of my Key Numbers indicator.
7 moving averages in 1 indicator, including the Hull Moving Average .
SMA
EMA
Weighted
Hull
Symetrical
Volume Weighted
Wilder
Linear Regression
Lots of other features like background shading and paint bar colors.
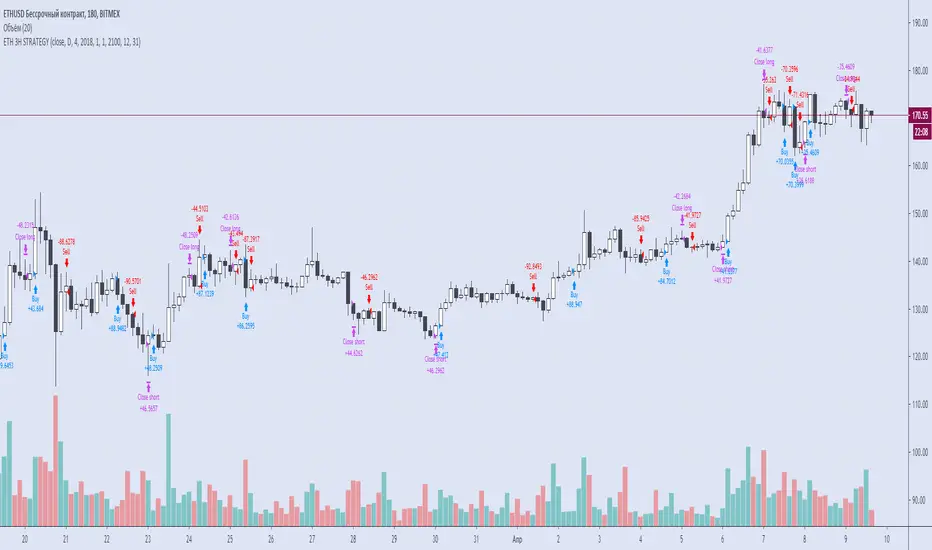
VITALIY ETHEREUM 3H STRATEGY [VCRYPTO]DESCRIPTION OF VITALIY ETH 3H STRATEGY
This strategy is made for trading ETHEREUM ( ETH ) using data from BITMEX exchange on 3 hour timeframe.
There is also a special indicator for the strategy to receive alerts on your tradingview platform which is very handful to enter the market as soon as there is a buy/sell signal.
Strategy is based on Pine script v.4 and it uses several indicators and oscillators to generate a buy/sell signal for ETH .
There is no repaint, which means that a signal will not disappear when price goes in wrong direction. I.e when a signal is generated, it
will be listed in trade history after bar's close and wont be changed.
And this is one of the advantages of the strategy over other 90% strategies.
The profitability curve of the strategy also has a stable growth, which means that the strategy is profitable at any phase the market,
not only at any particalar moment.
The strategy is a SWING strategy, which means that a signal for opening a position (buy or sell) at the same time closes previous position.
Because of its specificity the strategy doesn’t have take profit/stop loss options and it is not recommended to use leverage.
Your risc is limited by time interval from opening one position and opening another one when the price reverses.
The strategy has a backtest statistics on TradingView. 2018 – 141%, 2019 – 171%, until Apr. 6th, 2020 – 103%, from 2018 till Apr. 6th, 2020 - 417% of net profit
Max drawdown (the sum of non-profitable trades until receiving a profitable trade) during a year not more than 12.44%.
The strategy is published for testing and will be free to use during this period of time.
To get access to the strategy after testing finishes write in comments and pm me.
______________________________________________________________________________________________________________________
ОПИСАНИЕ VITALIY ETH 3H STRATEGY
Стратегия работает на инструменте Ethereum (ETH) по котировкам биржи BITMEX на 3 часовом таймфрейме (3H), а также имеет удобные алерты для сигналов на покупку/продажу.
Это позволит Вам заниматься своими делами, не следя за тем, что происходит на рынке, но в нужное время совершить сделку, получив предупреждение на телефон / компьютер.
Стратегия построена на последней версии Pine Script, в ее основе лежит совокупность множества индикаторов и правил, которые в определенный момент дают сигнал на покупку или продажу ETH. Стратегия основана на "non-repaint" базисе, таким образом, если стратегия показала вход в сделку (по итогу закрытия свечи) - то данная сделка так и остается без изменений и записывается в историю сделок. Это выгодно отличает данную стратегию от 90% таковых в Trading View и дает уверенность, что появившийся сигнал на сделку не исчезнет в случае, если рынок пойдет в противоположную сторону. Данный фактор означает, что статистика по данной стратегии не будет "нарисована", как в большинстве других стратегий. Также, не маловажным фактором является поступательная кривая доходности, что означает, что стратегия будет зарабатывать на всех фазах рынка, а не только в определенный момент времени.
Данная стратегия относится к сегменту SWING стратегий, когда один сигнал является одновременно закрытием одной сделки и открытием противоположной.
В связи со спецификой стратегии она не использует стоп-ордера, поэтому предполагает торговлю строго без плечей. Если вы хотите снизить риск по данной стратегии, то можете заходить в сделки пониженным объемом средств.
Ваш риск ограничен временным интервалом от момента, как цена пошла в противоположную сторону, до момента пока стратегия не дала сигнал на перекладку в новую сделку.
Статистика, подтвержденная бэктестом в Trading View, за последние пару лет: 2018 - 141%, 2019 - 171%, на 06.04.2020 - 103%, с 2018 по 06.04.2020 - 417%. Это данные по Чистой прибыли на вложенный капитал. Максимальная просадка ("Max drawdown" по данным Trading View) за период с 2018 по 06.04.2020 не превысила 12,44%
Для предоставления доступа к данной стратегии - пожалуйста пишите в комментариях запрос с копией в личные сообщения. Мы быстро с Вами свяжемся.
Multi Timeframe Moving Averages This indicator allows you to view a moving average ( EMA or SMA ) of your choosing on other time frames than what you are currently on. You just need to edit the script and plot MAs that you want to see.
This is based on awesome work of @millerrh at but now instead of read inputs, I just plot what I desire with correct labels.
The reason I used that was that I wanted to see daily MAs in 15min, 5min and 1min charts.
To use the script add to your chart and edit it, you can add or remove any MA you want at end of file and then add it to your chart again.
The code off course is open source.

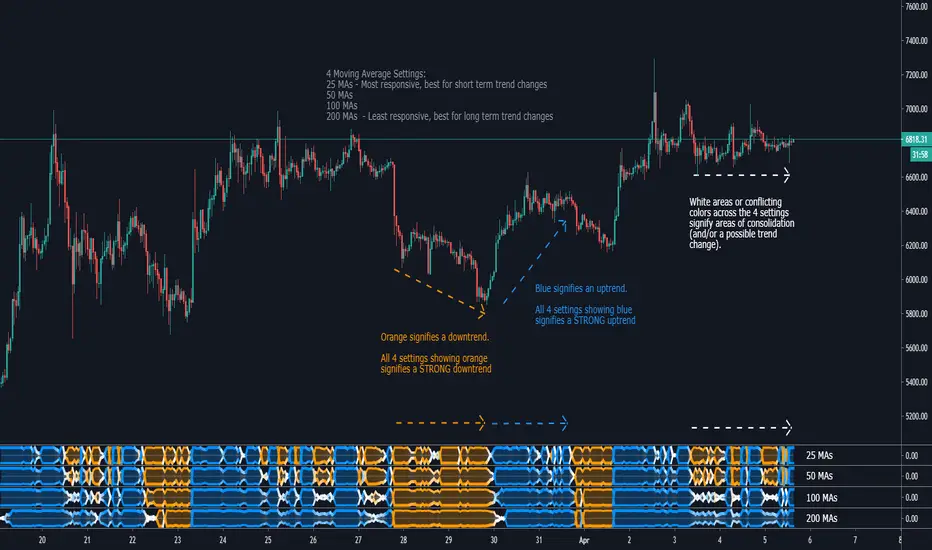
Life StrandA visual representation of 25, 50, 100, or 200 moving averages and their position relative to price action.
Reading this Indicator:
Blue represents that the majority of MAs are below price action, indicating a bullish trend. The wider the Strand, the stronger the trend. All 4 Settings showing blue indicate a strong bullish trend.
Orange represents that the majority of MAs are above price action, indicating a bearish trend. The wider the Strand, the stronger the trend. All 4 Settings showing orange indicate a strong bearish trend.
White areas signify some MAs are above while others are below price action, indicating periods of consolidation or trend change.
The 25 MA setting is most responsive to PA and shows change of trends quickly. The 200 MA setting is the least responsive but gives a solid look at the long term trend and ignores the ups and downs in a longer trend.
Currently Supported MAs:
Simple Moving Average (SMA)
Exponential Moving Average (EMA)
RSI Moving Average (RMA)
Weighted Moving Average (WMA)
Volume Weighted Moving Average (VWMA)
Jurik Moving Average (JMA)
Trading Strategy:
I prefer to have all 4 Life Strands open (25, 50, 100, 200) and look for confluence of all 4 for confirmation of PA direction. All 4 are orange for 2-4 candles, strong indication of bearish movement. Same can be said for blue. When the 4 settings have conflicting colors (ie 2 are blue, 2 are orange), that PA becomes a no trade zone for me. Confirmation is key, as is with any indicator.
ScalpyScalpy is made up of a 2 main parts.
- The cloud comprising of a 10 period SMA and a 30 period SMA.
- When the cloud is green you should be looking for long entries.
- When the cloud is red you should be looking for short entries.
- Price is most bullish above a green cloud and most bearish below a red cloud.
- Being within the cloud indicates indecision.
The blue and white lines on the indicator show the relationship between price and momentum.
They can be used to spot reversals in two ways:
- The first is a divergence between price (blue line) and RSI (white line)
- If the price makes a lower low but the RSI makes a higher low this shows the trend is weakening and may be reversing soon (as can be seen by the two yellow lines on the chart).
The second is a simple crossover:
- When the white line crosses the blue line to the upside this signals a long entry.
- When the white line crosses the blue line to the downside this signals a short entry.

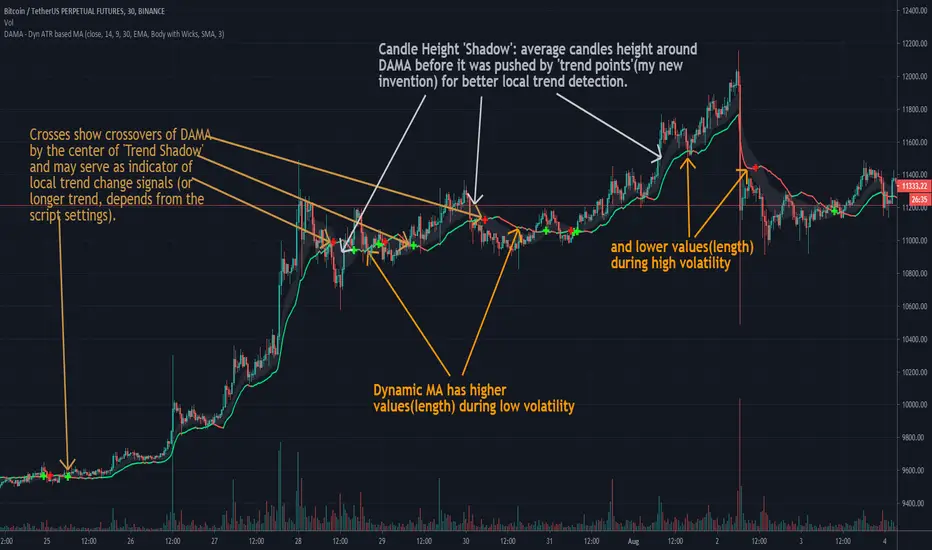
DAMA - Dyn ATR based MAEnglish description:
This is my approach to self fixing moving average that uses ATR to establish which MA length to use, considering current price volatility.
It has four settings values:
- ATR Length
- MA Length From
- MA Length To
- Choose Moving Average (2 options: SMA and EMA)
This script is invite-only for the members of our trading group (info in signature).
---------------------------------------------------------------------------------------------------
Polish description:
Niniejszy skrypt jest moim podejściem do zaprogramowania automatycznie ustalającej się średniej kroczącej, która przy wykorzystaniu ATR ustala z ilu świec wstecz obliczać cenę średnią, biorąc pod uwagę zakres zmienności ceny z danego okresu.
Skrypt posiada cztery ustawienia:
- ATR Length (długość Average True Range)
- MA Length From
- MA Length To
- Choose Moving Averaga (2 opcje: SMA i EMA)
Skrypt jest publikowany na zasadzie invite-only(konieczność przydzielenia dostępu na TradingView), a zatem dostępny jest tylko dla aktywnych użytkowników naszej grupy traderskiej, do której link można znaleść w mojej sygnaturze poniżej.
Briz 1D XMAs LOCKED to 1D - BitcoinA crazy bunch of MAs coded the way I wanted - Never was meant to be published but maybe it will help other tightwads out there that need many MAs in one indicator. These SMAs and EMAs are locked to the 1 day time frame. The PURGATORY line is a 666 day MA from 12 hour - thus, 333 1D. There is also a high and low Mayer Multiple built in, a Tilson MA, and a bubble top SMA.

ZLMA - Low-Lag Moving Average Based On An Alternative SMA DesignThere can be many ways to make a simple moving average, you can either sum the current and the n-1 previous data points and divide the result by n , or you can do it more efficiently by first taking the cumulative sum of your data points, and subtracting the current cumulative sum result with the cumulative sum results n bars ago, then divide the result by n . This can be described by the following formulas:
a(t) = a(t-1) + price(t)
b(t) = (a(t) - a(t-n))/n
This method is the one used in order to allow the user to use a series as SMA period, more info here:
Today we use this design in order to provide a pretty efficient low-lag moving average where the amount of lag of the moving average can be increased/decreased by the user.
THE INDICATOR
length control the period of the moving average, with larger value of length returning larger filtering amount. The lag setting in the other hand control the amount of lag of the moving average, with larger value of lag returning a moving average with less lag. The lag setting can't be lower than 1 or greater than 2, but values lower than 1 and greater than 0 would just return a moving average with larger filtering amount while values greater than 2 would create crazy wild overshoots.
In blue lag = 1.8, in red lag = 1.4, when lag = 1 the moving average is equal to a simple moving average of period length. Remember that larger values of lag will return greater over/undershoots.
Approximate amplitude response of the moving average, like all low-lag moving averages you can see frequencies amplified (the ones on the left greater than 1) .
SUMMARY
We proposed a low-lag moving average based on the cumulative/change SMA design where the lag of the moving average can be controlled by the user. There are tons of low-lag moving averages already, and they don't necessarily provide different results from each others, however this one is still relatively interesting as you can switch from a simple MA from a low-lagging one, other indicators are ready using this design and will be posted soon.

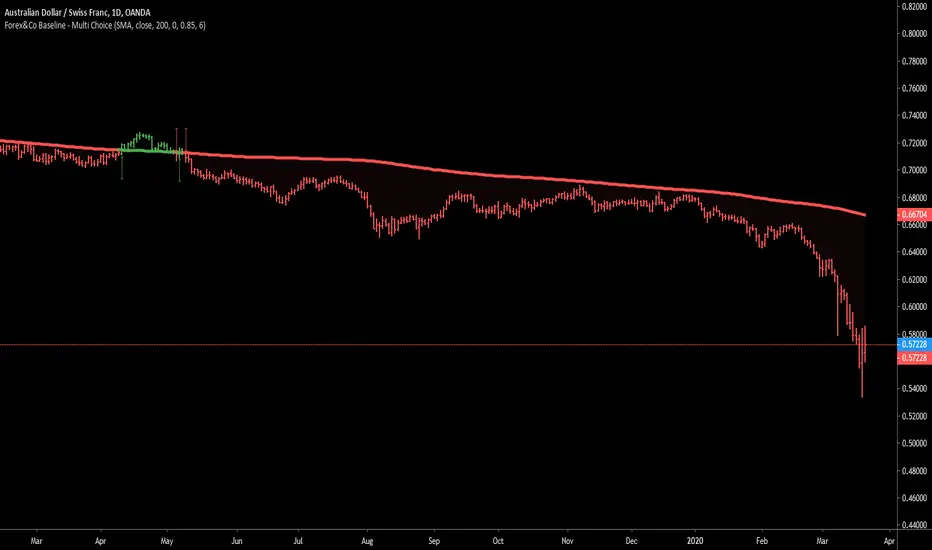
Forex&Co Baseline - Multi ChoiceBest baseline indicator with multiple choice and bar colour. Easy to use and very effective.
Moving Averages Linear CombinatorLinearly combining moving averages can provide relatively interesting results such as a low-lagging moving averages or moving averages able to produce more pertinent crosses with the price.
As a remainder, a linear combination is a mathematical expression that is based on the multiplication of two variables (or terms) with two coefficients (also called scalars when working with vectors) and adding the results, that is:
ax + by
This expression is a linear combination , with x/y as variables and a/b as coefficients. Lot of indicators are made from linear combinations of moving averages, some examples include the double/triple exponential moving average, least squares moving average and the hull moving average.
Today proposed indicator allow the user to combine many types of moving averages together in order to get different results, we will introduce each settings of the indicator as well as how they affect the final output.
Explaining The Effects Of Linear Combinations
There are various ways to explain why linear combination can produce low-lagging moving averages, lets take for example the linear combination of a fast SMA of period p/2 and slow simple moving average of period p , the linear combination of these two moving averages is described as follows:
MA = 2SMA(p/2) + -1SMA(p)
Which is equivalent to:
MA = 2SMA(p/2) - SMA(p) = SMA(p/2) + SMA(p/2) - SMA(p)
We can see the above linear combinations consist in adding a bandpass filter to the fast moving average, which of course allow to reduce the lag. It is important to note that lag is reduced when the first moving average term is more reactive than the second moving average term. In case we instead use:
MA = -2SMA(p/2) + 1SMA(p)
we would have a combination between a low-pass and band-reject filter.
The Indicator
The indicator is based on the following linear combination:
Coeff × LeadingMA(length) - (Coeff-1) × LaggingMA(length)
The length setting control both moving averages period, leading control the type of moving average used as leading MA, while lagging control the type of MA used as lagging moving average, in order to get low lag results the leading MA should be more reactive than the lagging MA. Coeff control the coefficients of the linear combination, with higher values of coeff amplifying the effects of the linear combination, negative values of coeff would make a low-lag moving average become a lagging moving average, coeff = 1 return the leading MA, coeff = -1 return the lagging MA. The leading period divisor allow to divide the period of the leading MA by the selected number.
The types of moving average available are: simple, exponentially weighted, triangular, least squares, hull and volume weighted. The lagging MA allow you to select another MA on the chart as input.
length = 100, leading period divisor = 2, coeff = 2, with both MA type = SMA. Using coeff = -2 instead would give:
You can select "Plot leading and lagging" in order to show the leading and lagging MA.
Conclusion
The proposed tool allow the user to create a custom moving averages by making use of linear combination. The script is not that useful when you think about it, and might maybe be one of my worst, as it is relatively impractical, not proud of it, but it still took time to make so i decided to post it anyway.

Multi moving average (by S. G. Lee)- Multi moving average with one indicator
- You can choose SMA/EMA
- You can change length
- You can change color, thickness

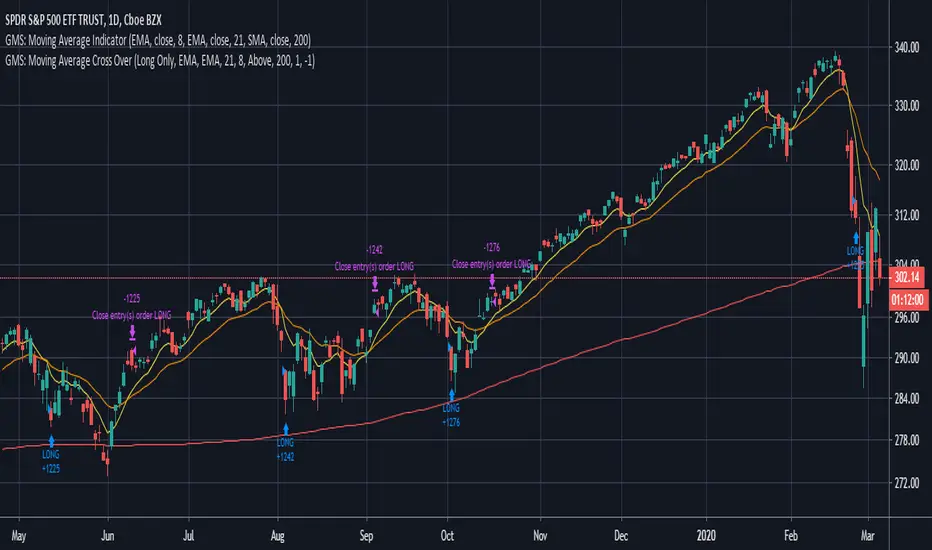
GMS: Moving Average IndicatorThis is a moving average indicator built the way I would want it. There are 3 moving averages with On/Off toggles. It makes it easier than having to add each one separately over and over. Now it's nice and easy all in one spot!
- The moving averages are SMA, EMA, WMA, VWMA and can select anyone for each of the 3 moving averages.
- You can also select the data used for the moving averages (OHLC etc.)
Source code should be open, so feel free to take a look and use it for you own project or ideas.
I hope this helps!
Andre

GMS: Moving Average Crossover StrategyThis is a moving average crossover system built the way I would want it to be.
- The moving averages included are SMA, EMA, WMA, VWMA.
- You can select either for the first moving average or the second moving average.
- You can also select to see the Long trades, Short trades, or both at the same time.
- There is also a simple moving average trend filter. When this is selected, it only applies to the entries of a trade and not the exit. There are situations where the entry is above the trend filter and the exit is below.
The source code should be open so feel free to adapt it, make it more efficient, or take some part for your own project!
I hope it helps,
Andre
MACD AND SMA COMBINATION StrategyHello Everyone This Strategy Base on MACD AND SMA COMBINATION
By Default 3 Percentage TP AND 1 Percentage Sl & quantity 500
By Default Backtesting Starting Time 1 Jan 2020 and end time 31 Dec 2020
You Can also change everything.
In future, I will Enhance this Strategy
if you have any suggestion Mention There Thank you so much
Multiple Timeframe Five Moving AveragesThis allows you to plot up to 5 moving averages on your chart at once. You can either use the chart's current timeframe or select a custom timeframe for your 5 moving averages (for example, you can see the 200DMA on your 4h chart without having to adjust the moving average length). You can also choose amongst SMA , EMA , and HULLMA for each MA.

[fikira] Volume + MTF MAVolume normally has 1 Moving Average (standard orange coloured)
This script gives 1 extra Moving Average (default blue coloured)
BOTH MA can be shown with Multi Time Frames,
based on the most excellent work of "PineCoders"
(MTF Selection Framework functions)!
This can provide more insights, also the crossovers can be interesting!
So, default there are 2 MA's of the present Time Frame + extra 2 TF's of these MA's
(default 2 and 4 times of the present TF)
All can be enabled/disabled,
Only 1 MA:
With labels and values:
Here 2 MA but + only 1 extra TF:

[fikira] Fibma/Fibema StrategyMy strategy regarding the Fibma/Fibema lines (also see my Fibma/Fibema study)
You can enable/disable each strategy to see what
works best in what timeframe
Thanks!
[fikira] Fibonacci MA / EMA's (Fibma / Fibema)I've made SMA/EMA's NOT based on the principle of the 2(1+1), 3(2+1),
5(3+2), 8(5+3), 13(8+5), 21(13+8), 34(21+13), 55(34+21), ... numbers,
but based on these following Fibonacci numbers:
0,236
0,382
0,500
0,618
0,764
1
Ending up with 2 series of Fibma / Fibema:
"Tiny Fibma / Fibema":
24, 38, 50, 62, 76, 100
"Big Fibma / Fibema":
236, 382, 500, 618, 764, 1000
IMHO it is striking how these lines often act as Resistance/Support,
although (except the 50, 100 & 500) they are not typical MA/EMA's.
They perform very well on every Timeframe as well!
Week:
3 Days:
1 Day:
4h:
1h:
Even on the 15 minutes:
Or 5':
Things to watch for:
Price compared to the Tiny or Big Fibma / Fibema (below or above)
Price compared to important Fibma / Fibema (for example below or
above MA 236, MA 764, MA 1000, ...)
Crossing of Fibma / Fibema 24/76, 236/764 and 38/62, 382/618
(bullish crossover = Lime coloured "cloud", bearish crossunder = Red coloured "cloud"),
...
I've made a change in barcolor if the close crosses the "Big Fibma / Fibema 500"
If price closes above MA/EMA 500, the first bar is yellow coloured,
if price stays above this level, candles are coloured lime/orange (= very bullish)
If price closes under MA/EMA 500, the first bar is purple,
if price stays under this level, candles are standard coloured (= very bearish)
Strategy will follow,
Thanks!
