Daily/MTF Moving Averages (EMA20, EMA55, SMA50, SMA100, SMA200)Script to plot common daily/alternative timeframe moving averages on when viewing securities at other resolutions.
There's lots of different MA scripts out there, but I couldn't find one that just represented the standard support/resistance indicators that were typical for my markets. So, this is the DIY. :)
Sma
Levels - [Silver-Wong]Draw a line on the right with indicator of what is set :
- EMA
- WMA
- MA
- Ichimoku Tenkan
- Ichimoku Kijun
In all inportant EMAs and timeframes
- MA/EMA/WMA 13, 20, 50, 100, 200
- 1H, 4H, 12H, Daily, Weekly

Combo Strategy 123 Reversal & EMA & MA Crossover This is combo strategies for get a cumulative signal.
First strategy
This System was created from the Book "How I Tripled My Money In The
Futures Market" by Ulf Jensen, Page 183. This is reverse type of strategies.
The strategy buys at market, if close price is higher than the previous close
during 2 days and the meaning of 9-days Stochastic Slow Oscillator is lower than 50.
The strategy sells at market, if close price is lower than the previous close price
during 2 days and the meaning of 9-days Stochastic Fast Oscillator is higher than 50.
Second strategy
The Moving Average Crossover trading strategy is possibly the most popular
trading strategy in the world of trading. First of them were written in the
middle of XX century, when commodities trading strategies became popular.
This strategy is a good example of so-called traditional strategies.
Traditional strategies are always long or short. That means they are never
out of the market. The concept of having a strategy that is always long or
short may be scary, particularly in today’s market where you don’t know what
is going to happen as far as risk on any one market. But a lot of traders
believe that the concept is still valid, especially for those of traders who
do their own research or their own discretionary trading.
This version uses crossover of moving average and its exponential moving average.
WARNING:
- For purpose educate only
- This script to change bars colors.

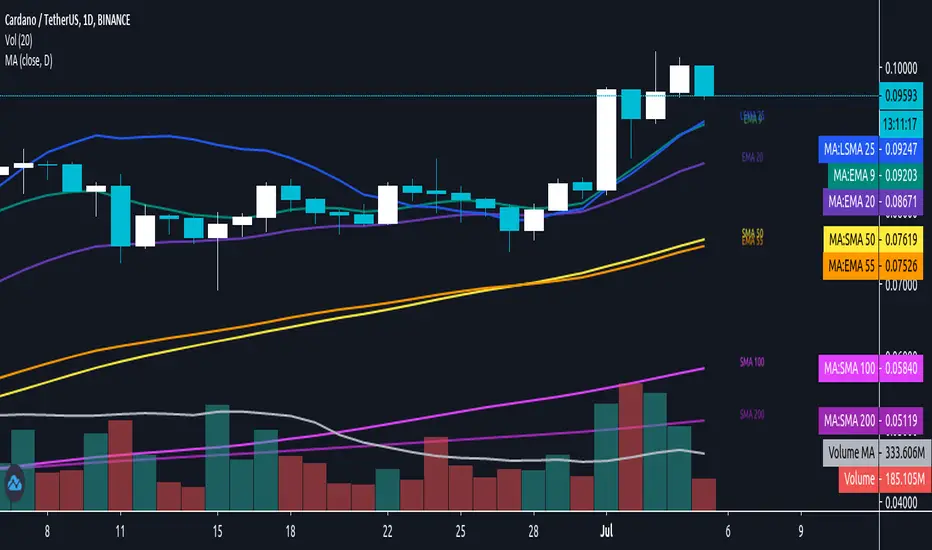
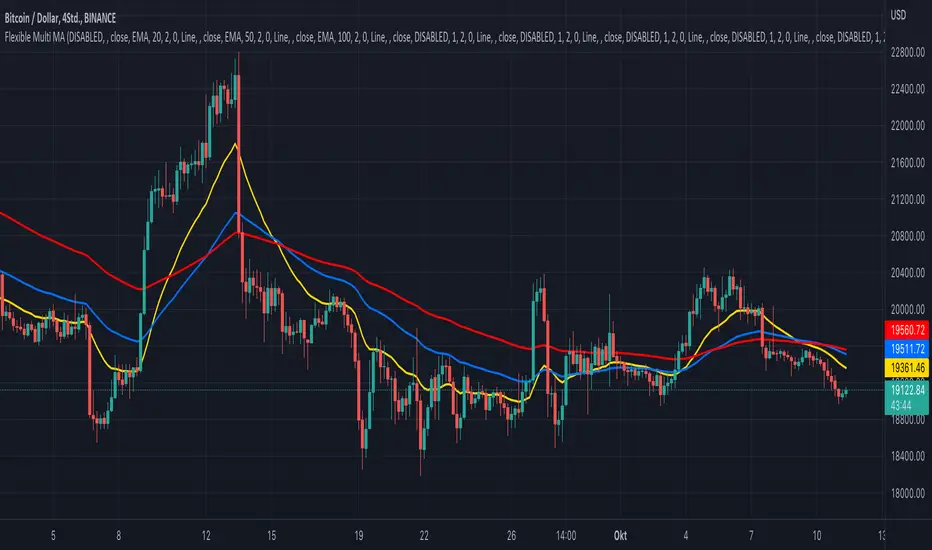
KINSKI Flexible Multi MA (EMA, SMA, RMA, WMA, VWMA, KAMA, HMA)This Multi Moving Average (MA) indicator is more flexible than any other indicator of this type offered so far. You can define up to 10 different Moving Average (MA) lines based on different calculation variants.
The following MA types can be configured.
- EMA: Exponentially Moving Average
- SMA: Small Moving Average
- RMA: Rolling Moving Average
- WMA: Weighted Moving Average
- VWMA: Volume Weighted Moving Average
- KAMA: Kaufman's Adaptive Moving Average
- HMA: Hull Moving Average
Which settings can be made?
- Selection for calculation formula ("Calculation Source"). The default value is "close".
- for each MA line the "Length" and the "Type" can be defined
- furthermore you can make layout adjustments via the "Style" menu
The Complex"Red Line" vs Simple"White Line" Moving Average "BetaThis is my 2nd real attempt at an indicator for tradingview...
I have made this using the BTC/USD chart for coinbase, but this should work for any chart on the site/app...
It seems to go well with the "MACD" if you do change the input for the MACD, I know it shows up with "The Complete vs Simple Moving Average" two times... And they do give different outputs, so it's up to you to see what fits you best... One way you can use it is, use one line as a get "Ready" and the other one to "Sell" on any time frame, but I look longer and then look shorter to make my calls, I hope that makes sense to you as a reader...
So let me know what you think about this and happy trading...
Justin

Daily Moving Averages on Intraday ChartShows the Daily Simple Moving Averages on the Intraday Chart
This will include the 200 day SMA, 50 day SMA and 20 day SMA automatically on the intraday chart.
Daily SMA time periods can be adjusted in the settings.
Based on the following script:
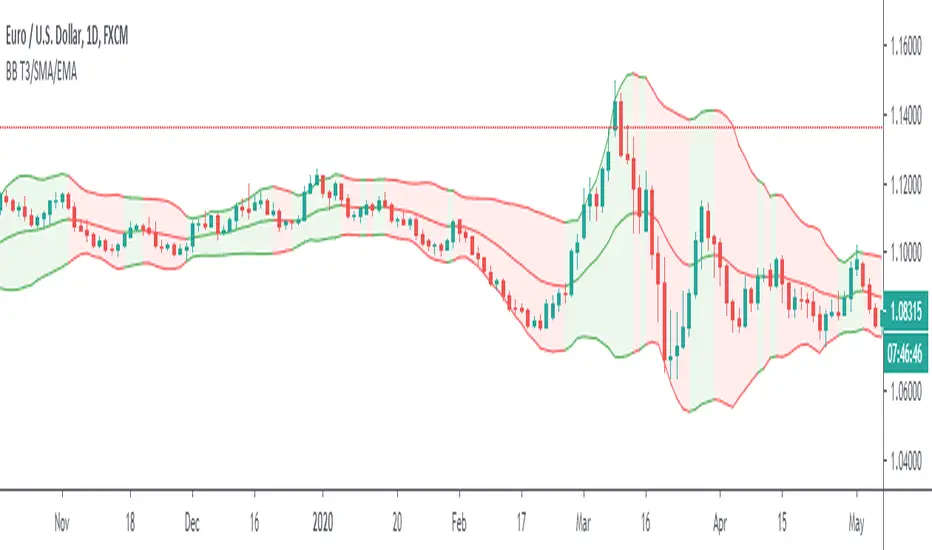
Bollinger Bands T3/SMA/EMAThis is Bollinger Bands script with an option to choose three different moving averages. The simple moving average is the original settings used by Mr Bollinger. Exponential is a popular choice as it adds more value to the recent price movements. T3 is a lot faster at adapting to the recent price. Compared to exponential, it gives even more value to the recent prices and furthermore, it is smoother. I use it to polish my True Range scripts.
Another upgrade is the ability to have a different colour of the channel when the baseline moves up or down.
Back to calculation? Is it better to use T3 with Bollinger? My opinion is that it depends on the trader. Both of them give you slightly different information and it is essential to look at the historical behaviour and answer for yourself. Will I use T3 calculation? Well, I built this script to find out if I want to.
Have a great trade!
SMA/EMA SR mtf Clusters v0.9SMA and EMA endings to identify support and resistance with a good chart overview.
Unfortunately the scaling of TradingView in intraday charts is not good.


SMA custom range Candle patterns (Mercenario)Custom SMA with custom range in pips
It recognises candle patterns
hammer
engulfing
three black crows and white soldiers
and HE
hammer entry, for strategy, hammer with candle confirming trend

MA * Fibo levels (canal)Some updates to the scrypt "MA * Fibo levels (auto)"
In the previous scrypt we drew lines using either highs or lows of the candles due to the positiveness or negativeness of given percentages.
But, after some research it seems easier to use CANALS to buy or sell rather than LINES. So these canals are the intervals between SMA(highs) and SMA(lows) multiplied by FIBO coefficients. However, lines can be also used as stop-losses if the price goes out of the canal, and wait until the price reaches the other canal.
Good luck in trading!
If the scrypt was useful let me know!
Any feedbacks and ideas are welcomed!

Hello VWAP "Beta"This is my 1st indicator, and my attention is to plot the VWAP "Volume-weighted average price" using the SMA "Simple Moving Average" over time... IE over the last 50,100,200 bars and just the VWAP... All of them in just one line... I have made it when I have been using the BTC/US chart, but it should work for stocks/forex or any other chart that you want to use...
I am not completely sure about this indicator and I do want to add more to this, that is how come I am posting to the community to show what I have done and people can use it and if they are open to it give me feedback or tips to make it better...
Happy trading...

MA-KIRILDIM-SANAThis is a lower block indicator. It helps us to follow the moving average crosses in the lower section in a single indicator without adding any moving averages in the main window.
When MA1 breaks MA2 up, the background color turns green or otherwise, the background becomes red. If you want, you can follow the lines of moving averages in here.
Three averages can be used in the system.
- SMA(Simple Moving Average)
- EMA(Exponential Moving Average)
- WMA(Weighted Moving Average)
Thanks

X+ - SMA/EMA Suite with MTF
I often use a mix of EMAs and SMAs in my analysis and turning them on and off and adding and removing them from the chart becomes a bit of a burden.
In this script you'll find the most common EMAs and SMAs that I use on just about every chart I look at.
If the feature ever becomes available to save settings as templates from within the script, then I will do that but for now there are two work-arounds.
www.dropbox.com
Work-Around 1: Create the suite that you want recalled by selecting what Moving Averages you want and then SAVE AS AN INDICATOR TEMPLATE. This has a fairly quick recall and you'll be able to access one that says "all EMA's" or "all SMAs" or "SMA/EMA for H4 Chart with MTF". Whatever you want.
That may work for some traders but others don't want the fuss of having their other indicators in the way or being added or removed from their templates, etc.
Work-Around 2: Add two instances or even three, whatever. I personally use two because the select on and select off can be a hassle when dealing with so many options.
I essentially use one that I have selected when I am looking at Daily or Higher Charts and then I hide that one an unhide the other one that is already setup for lower timeframe charts, from the M1 to the H4.
This allows me to run two full suites. I was looking for a way to save settings like we can with the Fibonacci tool but I simply could not find a solution. So, this will have to do.
The MTF - Multi-Time-Frame
I have it coded to display the 20 SMA from the M30, H1 and H4 Charts - no matter what timeframe you are currently viewing.
I also have the 200 EMA from the same charts (M30, H1, H4)
The Settings can be changed but the readout on the scales will stay 20 and 200.
www.dropbox.com
You can change the SMA and the EMA to whatever you want as well as the Source, an offset if desired and the timeframe from which it will display from.
Above is a screenshot of an H4 Chart with only the MTFs. So you will see the 20 SMA from the M30 as well as the H1 and H4. They have a checkered style to them that can be customized in the settings. Those are White and Black.
The Green and Black are the 200 EMAs from the M30 and the H1 and H4.
www.dropbox.com
If you want to be able to see the Label on the scale, you can head to Settings/Scales and Tick on "Indicator Name Label"
www.dropbox.com
www.dropbox.com
I have a pretty specific color format that I follow but I do a lot of teaching. For me, it's far easier to have the readout of what line is what right on the chart:
7 EMA is the 7 EMA and not just "EMA" or something even longer that takes up a good portion of your screen when you turn on the indicator name label option.
Anyway, I hope somebody finds a use for this and if so, Awesome.
Above are just some ideas of how I use it.
CBG Swing HighLow MAThis indicator will show the swing high and lows for the number of bars back. It's very easy to use and shows good support and resistance levels.
I then took it a step further and added a moving average with all the standard types in my indicators:
SMA
EMA
Weighted
Hull
Symmetrical
Volume Weighted
Wilder
Linear Regression
I then added Bollinger Bands to show the standard deviation from the midline.
Finally, I added a simple bar coloring scheme: green if above the upper BB, Red if below and orange if in the middle.
I am just testing this out so please use with caution. If anyone in the community wants to run some backtests, that would be great and we would all appreciate it.
Of course you can keep it all simple and turn off all the moving averages and bollinger bands.
Enjoy! :-)

EMA,SMA,VWAPSMA EMA and VWAP all in one for you free accounters out there! The ultimate chart inspired by RizeSenpai created by Bitcorns-trader aka FACE aka ( ͡° ͜ʖ ͡°)

SMMA 5-13 crossCrossing the Smoothed Moving Averages with settings 5 & 13 give you confident signal for selling or buying.
IMPORTANT: Signal is always late.
SELL : Short SMMA (5) cross the Long SMMA (13) from top
BUY : Short SMMA (5) cross the Long SMMA (13) from down

TS - Trend Moving AveragesOverview
Simple trend indentification indicator based on a mix of SMA & WMA components.
Default settings built for the 1D chart with an optional 3rd fast MA that can be toggled.
Can be used alongside more advanced Tradespot indicators
Access
PM me, our indicators come as a wider package.

ALMA Function [FN] - Arnaud Legoux Moving AverageThis hasn't been done before. People know the ALMA moving average, TradingView, of course, has a built-in function for the ALMA = alma(). But, when you use built-in functions, you can't have a series as a length. Pinecoders put out a bunch of functions for various routines wherein the built-in doesn't allow for a series as a length. I got some help from @everget (awesome dude) to do the dev() function as well... can't find the ALMA anywhere. So, here it is. It seems to match the built-in indicator. To double-check me, just put the ALMA built-in over this and they should match. Let me know if you find an issue.
That's it. ALMA is cool. I'm going to use it as the average for the CCI. Good day.

GMS: Keltner ChannelsBasically I wanted to make this into one indicator instead of three while adding in some extra options as well... So this is just a Keltner Channel with three channels, all of which have the same length. I have also added in an option to select the moving average for the channel, the original is based on the EMA.
The source code should be open so take a look around and enjoy!
Andre

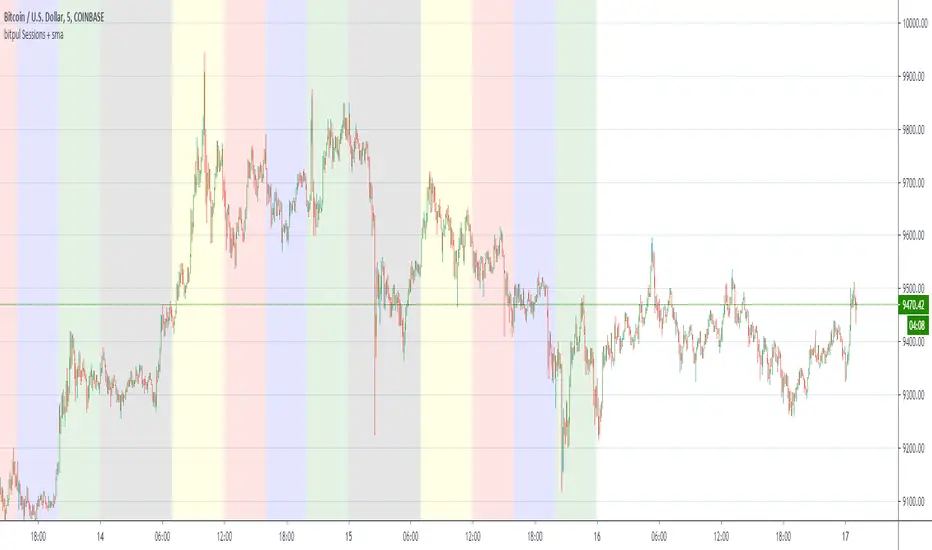
bitpul Sessions + sma [MHMK]Background colors that show open-close of the major market sessions ( Tokyo, London, joint time, New York, free time).
I added two sma to get more confirmation for the reversal - You can hide smas
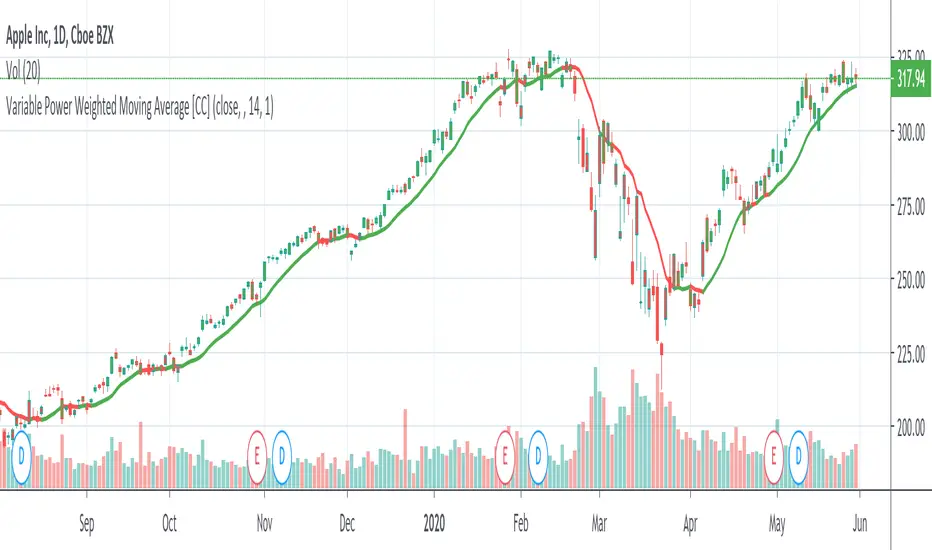
Variable Power Weighted Moving AverageThe Variable Power Weighted Moving Average was created by RedKTrader so make sure you follow them! This is a very handy indicator where you can change the weights of the weighted moving average yourself!
For an easy guide here are common values to use to convert this indicator into other indicators:
Power = 0 = Simple Moving Average
Power = 0.5 = Square Root Weighted Moving Average
Power = 1 = Weighted Moving Average
Power = 2 = Squared Weighted Moving Average
Try it out and let me know what you think!
Let me know if you have other ideas for me or if you want something custom done!