Bollinger Bands with 4 Moving AveragesCombines Bollinger Bands (BB) with up to four optional Moving Averages (MA) to read volatility, trend direction, and dynamic support–resistance in one overlay.
How It Works
BB: basis = MA(length, type) with standard deviation mult. upper = basis + dev, lower = basis − dev.
MA1–MA4: additional averages you can toggle (default only MA4/200 enabled).
Key Features
Flexible basis MA type for BB: SMA / EMA / RMA (Wilder) / WMA / VWMA.
Four optional MAs with independent length, color, and width (defaults: 7, 25, 99, 200; only 200 on by default).
Offset to shift BB for visual testing.
Overlay on price with shaded band between Upper–Lower.
Inputs & Defaults
BB Length = 20, StdDev = 2.0, Source = close.
Basis MA Type = SMA.
MA4 active (200), MA1–MA3 off (7/25/99 ready).
Offset = 0.
Practical Use
Use BB for volatility context: squeeze → potential breakout; expansion → strong trend.
Treat Basis / Upper / Lower as dynamic levels:
Pullbacks to Basis often become decision zones in trends.
Upper/Lower touches = relative extremes.
Add MA4(200) for primary bias; enable MA1–MA3 for finer timing.
Typical behavior:
Price > MA200 and rising basis → bullish bias; watch pullbacks to basis/MA25-like zones.
Price < MA200 and falling basis → bearish bias; watch rejections at basis/MAs.
Common Signals (not financial advice)
Breakout + BB expansion confirms momentum.
Squeeze + basis break can preface volatility expansion.
Confluence: Lower touch + fast MA in uptrends → mean-reversion setups; inverse for downtrends.
Notes
MA1–MA4 are SMA in the code; BB basis follows the selected MA type.
Test across timeframes; tune length and mult to the asset.
Disclaimer
Visual tool only. Combine with risk management, multi-timeframe confirmation, and a tested plan.
ค่าเฉลี่ยเคลื่อนที่แบบง่าย (SMA)

EMA/SMA Market Indicator V1 (Situational Awareness Uptrend)Red condition (highest priority in code)
Background = red if any of these are true:
Close < 10MA
OR Close < 20MA
OR (10MA and 20MA slopes ≤ threshold → “flat/down”)
Green condition (only if not red)
Background = green if:
(Close > 10MA or Close > 20MA)
AND Close > 50MA
Otherwise = nothing (transparent)
If neither red nor green is true → background is off.
So when is there no background?
Close is not below 10MA
Close is not below 20MA
MAs are not both flat/down
AND the price fails the “green test” (ex. under 50MA, or not above 10/20).
Disparity Index with 4 EMAsDisparity Index with 4 EMAs
(ema - close ) / ema * 100
or
(ema - close0 / close * 100

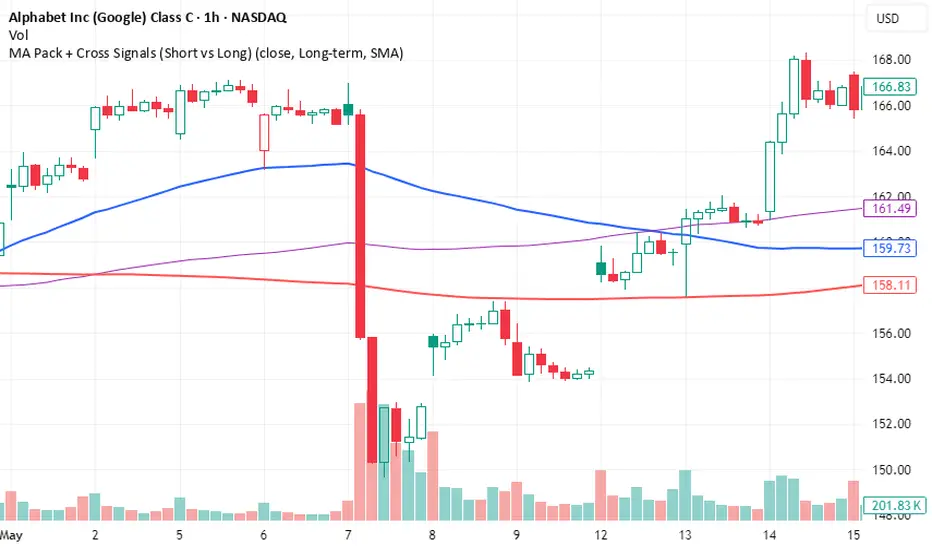
MA Pack + Cross Signals (Short vs Long)Overview
A flexible moving average pack that lets you switch between short-term trend detection and long-term trend confirmation .
Short-term mode: plots 5, 10, 20, and 50 MAs with early crossovers (10/50, 20/50).
Long-term mode: plots 50, 100, 200 MAs with Golden Cross and Death Cross signals.
Choice of SMA or EMA .
Alerts included for all crossovers.
Why Use It
Catch early trend shifts in short-term mode.
Confirm institutional trend levels in long-term mode.
Visual signals (triangles + labels) make spotting setups easy.
Alert-ready for automated trade monitoring.
Usage
Add to chart.
In settings, choose Short-term or Long-term .
Watch for markers:
Green triangles = bullish cross
Red triangles = bearish cross
Green label = Golden Cross
Red label = Death Cross
Optional: enable alerts for notifications.
Multi EMA and Key Levels IndicatorKey Features:
Daily and Previous Day Levels
Plots today’s high and low.
Plots the previous day’s high (Y HOD) and low (Y LOD), with labels anchored to the price axis.
Premarket (Globex) High and Low
Tracks premarket session highs and lows (defined as 5:00 PM to 8:30 AM Chicago time).
Updates dynamically during the session and plots “GLOBEX HIGH” and “GLOBEX LOW” lines with labels.
Exponential & Simple Moving Averages
User can select 3 EMAs (default 8, 21, 200).
Plots EMAs with distinct colors.
Plots the 200-day SMA for longer-term trend context.

Trend Pro V2 [CRYPTIK1]Introduction: What is Trend Pro V2?
Welcome to Trend Pro V2! This analysis tool give you at-a-glance understanding of the market's direction. In a noisy market, the single most important factor is the dominant trend. Trend Pro V2 filters out this noise by focusing on one core principle: trading with the primary momentum.
Instead of cluttering your chart with confusing signals, this indicator provides a clean, visual representation of the trend, helping you make more confident and informed trading decisions.
The dashboard provides a simple, color-coded view of the trend across multiple timeframes.
The Core Concept: The Power of Confluence
The strength of any trading decision comes from confluence—when multiple factors align. Trend Pro V2 is built on this idea. It uses a long-term moving average (200-period EMA by default) to define the primary trend on your current chart and then pulls in data from three higher timeframes to confirm whether the broader market agrees.
When your current timeframe and the higher timeframes are all aligned, you have a state of "confluence," which represents a higher-probability environment for trend-following trades.
Key Features
1. The Dynamic Trend MA:
The main moving average on your chart acts as your primary guide. Its color dynamically changes to give you an instant read on the market.
Teal MA: The price is in a confirmed uptrend (trading above the MA).
Pink MA: The price is in a confirmed downtrend (trading below the MA).
The moving average changes color to instantly show you if the trend is bullish (teal) or bearish (pink).
2. The Multi-Timeframe (MTF) Trend Dashboard:
Located discreetly in the bottom-right corner, this dashboard is your window into the broader market sentiment. It shows you the trend status on three customizable higher timeframes.
Teal Box: The trend is UP on that timeframe.
Pink Box: The trend is DOWN on that timeframe.
Gray Box: The price is neutral or at the MA on that timeframe.
How to Use Trend Pro V2: A Simple Framework
Step 1: Identify the Primary Trend
Look at the color of the MA on your chart. This is your starting point. If it's teal, you should generally be looking for long opportunities. If it's pink, you should be looking for short opportunities.
Step 2: Check for Confluence
Glance at the MTF Trend Dashboard.
Strong Confluence (High-Probability): If your main chart shows an uptrend (Teal MA) and the dashboard shows all teal boxes, the market is in a strong, unified uptrend. This is a high-probability environment to be a buyer on dips.
Weak or No Confluence (Caution Zone): If your main chart shows an uptrend, but the dashboard shows pink or gray boxes, it signals disagreement among the timeframes. This is a sign of market indecision and a lower-probability environment. It's often best to wait for alignment.
Here, the daily trend is down, but the MTF dashboard shows the weekly trend is still up—a classic sign of weak confluence and a reason for caution.
Best Practices & Settings
Timeframe Synergy: For best results, use Trend Pro on a lower timeframe and set your dashboard to higher timeframes. For example, if you trade on the 1-hour chart, set your MTF dashboard to the 4-hour, 1-day, and 1-week.
Use as a Confirmation Tool: Trend Pro V2 is designed as a foundational layer for your analysis. First, confirm the trend, then use your preferred entry method (e.g., support/resistance, chart patterns) to time your trade.
This is a tool for the community, so feel free to explore the open-source code, adapt it, and build upon it. Happy trading!
For your consideration @TradingView

SATHYA SMA SignalThis indicator overlays 20, 50, and 200 Simple Moving Averages (SMAs) on the chart. It generates bullish signals when the 20 SMA crosses above the 200 SMA before the 50 SMA, with both above 200 SMA. Bearish signals occur when the 20 SMA crosses below the 200 SMA before the 50 SMA, with both below 200 SMA. Signals appear as distinct triangles on the chart, helping traders identify trend reversals based on systematic SMA crossovers and order of crossing.

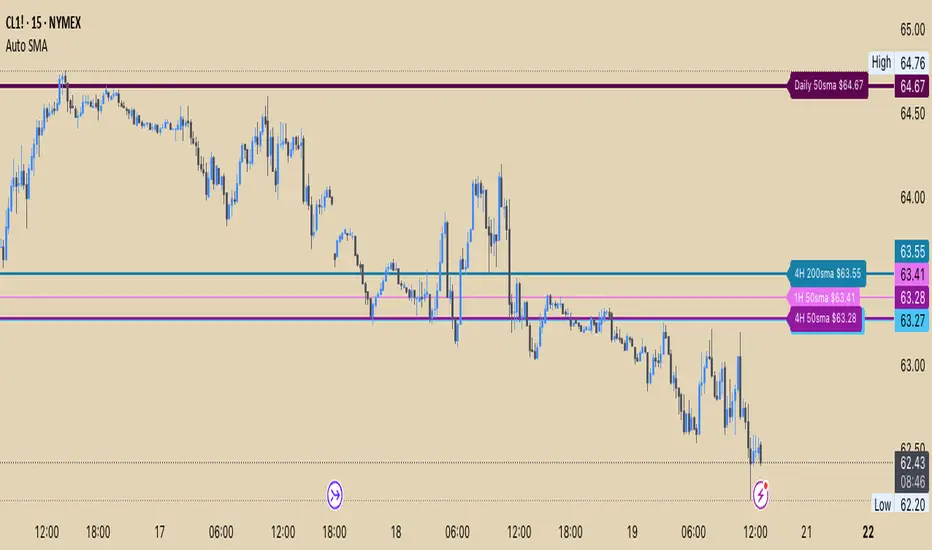
Auto SMA 50&200 (D,4h,1h)Auto SMA 50&200 (Daily, 4hr,1hr)
About this Indicator:
This indicator plots the 50 and 200 Simple Moving Average (SMA) as horizontal price levels for the Daily, 4 hour, and 1 hour time frames. The SMAs available in this indicator will appear on each time frame saving you from having to switch to different Time frames, or having multiple charts open to view the large point of view SMAs. This is perfect for those who like to chart off the large point of view and then switch into the smaller time frames.
Settings Input:
Master Button to toggle on/off Text Bubbles or Price Scale Labels
Text Position is set to best position by default.
Each SMA setting gives you the option to enable/disable it, hide the text label, change the color, change the line style, and line width.
Settings Style:
Under "Style" you will see that you cannot change the lines because they are set to transparent. The idea was to make sure you have the option to view the SMA Price Labels on the Price Scale without seeing the trend lines, which makes it too cluttered.
You can also individually show/hide the Label on the Price Scale for each SMA
Anrazzi - EMAs/ATR - 1.0.2The Anrazzi – EMAs/ATR indicator is a multi-purpose overlay designed to help traders track trend direction and market volatility in a single clean tool.
It plots up to six customizable moving averages (MAs) and an Average True Range (ATR) value directly on your chart, allowing you to quickly identify market bias, dynamic support/resistance, and volatility levels without switching indicators.
This script is ideal for traders who want a simple, configurable, and efficient way to combine trend-following signals with volatility-based position sizing.
📌 Key Features
Six Moving Averages (MA1 → MA6)
Toggle each MA on/off individually
Choose between EMA or SMA for each
Customize length and color
Perfect for spotting trend direction and pullback zones
ATR Display
Uses Wilder’s ATR formula (ta.rma(ta.tr(true), 14))
Can be calculated on current or higher timeframe
Adjustable multiplier for position sizing (e.g., 1.5× ATR stops)
Displays cleanly in the bottom-right corner
Custom Watermark
Displays symbol + timeframe in top-right
Adjustable color and size for streamers, screenshots, or clear charting
Compact UI
Organized with group and inline inputs for quick configuration
Lightweight and optimized for real-time performance
⚙️ How It Works
MAs: The script uses either ta.ema() or ta.sma() to compute each moving average based on the user-selected type and length.
ATR: The ATR is calculated using ta.rma(ta.tr(true), 14) (Wilder’s smoothing), and optionally scaled by a multiplier for easier use in risk management.
Tables: ATR value and watermark are displayed using table.new() so they stay anchored to the screen regardless of zoom level.
📈 How to Use
Enable the MAs you want to track and adjust their lengths, type, and colors.
Enable ATR if you want to see volatility — optionally select a higher timeframe for broader context.
Use MAs to:
Identify overall trend direction (e.g. price above MA20 = bullish)
Spot pullback zones for entries
See when multiple MAs cluster together as support/resistance zones
Use ATR value to:
Size your stop-loss dynamically (e.g. stop = entry − 1.5×ATR)
Detect volatility breakouts (ATR spikes = market expansion)
🎯 Recommended For
Day traders & swing traders
Trend-following & momentum strategies
Volatility-based risk management
Traders who want a clean, all-in-one dashboard

Anrazzi - EMAs/ATR - 1.0.2Description:
The Anrazzi - EMAs/ATR indicator is a versatile tool for technical traders looking to monitor multiple moving averages alongside the Average True Range (ATR) on any chart. Designed for simplicity and customization, it allows traders to visualize up to six moving averages with configurable type, color, and length, while keeping real-time volatility information via ATR directly on the chart.
This indicator is perfect for spotting trends, identifying support/resistance zones, and gauging market volatility for intraday or swing trading strategies.
Key Features:
Supports up to six independent moving averages (MA1 → MA6)
Each MA is fully customizable:
Enable/disable individually
Type: EMA or SMA
Length
Color
ATR Display:
Custom timeframe
Color and position configurable
Adjustable multiplier
Compact and organized settings for easy configuration
Lightweight and efficient code for smooth chart performance
Watermark
Inputs / Settings:
MA Options: MA1 → MA6 (Enable/Disable, Type, Length, Color)
Additional Settings: ATR (Enable, Timeframe, Color, Multiplier)
How to Use:
Enable the moving averages you want to track
Configure type, length, and color for each MA
Enable ATR if needed and adjust settings
Watch MAs plotted dynamically and ATR in bottom-right corner
Recommended For:
Day traders and swing traders
Trend-following strategies
Volatility analysis and breakout detection
Traders needing a compact multi-MA dashboard

Dual Best MA Strategy AnalyzerDual Best MA Strategy Analyzer (Lookback Window)
What it does
This indicator scans a range of moving-average lengths and finds the single best MA for long crossovers and the single best MA for short crossunders over a fixed lookback window. It then plots those two “winner” MAs on your chart:
Best Long MA (green): The MA length that would have made the highest total profit using a simple “price crosses above MA → long; exit on cross back below” logic.
Best Short MA (red): The MA length that would have made the highest total profit using “price crosses below MA → short; exit on cross back above.”
You can switch between SMA and EMA, set the min/max length, choose a step size, and define the lookback window used for evaluation.
How it works (brief)
For each candidate MA length between Min MA Length and Max MA Length (stepping by Step Size), the script:
Builds the MA (SMA or EMA).
Simulates a naïve crossover strategy over the last Lookback Window candles:
Long model: enter on crossover, exit on crossunder.
Short model: enter on crossunder, exit on crossover.
Sums simple P&L in price units (no compounding, no fees/slippage).
Picks the best long and best short lengths by total P&L and plots those two MAs.
Note: Long and short are evaluated independently. The script plots MAs only; it doesn’t open positions.
Inputs
Min MA Length / Max MA Length – Bounds for MA search.
Step Size – Spacing between tested lengths (e.g., 10 tests 10, 20, 30…).
Use EMA instead of SMA – Toggle average type.
Lookback Window (candles) – Number of bars used to score each MA. Needs enough history to be meaningful.
What the plots mean
Best Long MA (green): If price crosses above this line (historically), that MA length produced the best long-side results over the lookback.
Best Short MA (red): If price crosses below this line (historically), that MA length produced the best short-side results.
These lines can change over time as new bars enter the lookback window. Think of them as adaptive “what worked best recently” guides, not fixed signals.
Practical tips
Timeframe matters: Run it on the timeframe you trade; the “best” length on 1h won’t match 1m or 1D.
Step size trade-off: Smaller steps = more precision but heavier compute. Larger steps = faster scans, coarser choices.
Use with confirmation: Combine with structure, volume, or volatility filters. This is a single-factor tester.
Normalization: P&L is in raw price units. For cross-symbol comparison, consider using one symbol at a time (or adapt the script to percent P&L).
Limitations & assumptions
No fees, funding, slippage, or position sizing.
Simple “in/out” on the next crossover; no stops/targets/filters.
Results rely on lookback choice and will repaint historically as the “best” length is re-selected with new data (the plot is adaptive, not forward-fixed).
The script tests up to ~101 candidates internally (bounded by your min/max/step).
Good uses
Quickly discover a recently effective MA length for trend following.
Compare SMA vs EMA performance on your market/timeframe.
Build a playbook: note which lengths tend to win in certain regimes (trending vs choppy).
Not included (by design)
Alerts, entries/exits, or a full strategy report. It’s an analyzer/overlay.
If you want alerts, you can add simple conditions like:
ta.crossover(close, plotLongMA) for potential long interest
ta.crossunder(close, plotShortMA) for potential short interest
Changelog / Notes
v1: Initial release. Array-based scanner, SMA/EMA toggle, adaptive long/short best MA plots, user-set lookback.
Disclaimer
This is educational tooling, not financial advice. Test thoroughly and use proper risk management.

Deviation Rate Crash SignalDescription
This indicator provides entry signals for contrarian trades that aim to capture rebounds after sharp declines, such as during market crashes.
A signal is triggered when the deviation rate from the 25-day moving average falls below -25% (default setting). On the chart, a red circle is displayed below the candlestick to indicate the signal.
Backtest (2000–2024, Nikkei 225 stocks):
Win rate: 64.73%
Payoff ratio: 1.141
Probability of ruin: 0.0% (with proper risk control)
Trading Rules (Long only):
Entry: Market buy at next day’s open when the closing price is 25% or more below the 25-day MA.
Exit: Market sell at next day’s open when:
The closing price is 10% above the entry price (take profit), or
The closing price is 10% below the entry price (stop loss), or
40 days have passed since entry.
Notes:
This indicator is tuned for crisis periods (e.g., 2008 Lehman Shock, 2011 Great East Japan Earthquake, 2020 COVID-19 crash, 2024 Yen carry trade reversal).
In normal market conditions, signals will be rare.
Pine Screener BETA Support:
Add this indicator to your favorites and scan with long condition = true.
Screener results display both the MA deviation rate and current price.
When multiple signals occur, use the deviation rate as a reference to prioritize setups.
説明
このインジケーターは、暴落時など短期間で急落した銘柄のリバウンドを狙う逆張りトレードのエントリーシグナルを提供します。
25日移動平均線からの乖離率が -25% を下回ったときにシグナルが点灯します(初期設定)。シグナルはメインチャートのローソク足の下に赤い丸印で表示されます。
バックテスト結果(2000~2024年、日経225銘柄):
勝率: 64.73%
ペイオフレシオ: 1.141
破産確率: 0.0%(適切なリスク管理を行った場合)
トレードルール(買いのみ):
エントリー: 終値が25日移動平均線から25%以上下方乖離した場合、翌日の寄り付きで成行買い。
手仕舞い: 翌日の寄り付きで成行売り(以下のいずれかの条件を満たした場合)
終値が買値より10%以上上昇(利確)
終値が買値より10%以上下落(損切り)
エントリーから40日経過
注意点:
このインジケーターは、2008年リーマンショック、2011年東日本大震災、2020年コロナショック、2024年円キャリートレード巻き戻しショックなど、危機的局面で効果を発揮するように調整されています。
通常の相場ではシグナルはほとんど出現しません。
Pine Screener BETA 対応:
このインジケーターをお気に入り登録し、long condition = true をフィルター条件にしてスキャンしてください。
スクリーナー結果には移動平均乖離率と現在値が表示されます。
シグナルが同時に多数出現した場合は、移動平均乖離率を参考に優先順位をつけてください。

SMA Vertical OffsetThis Indicator allow you to adjust the SMA offset vertically instead of horizontally
Chandelier Exit_MA RibbonCombine Indicator for easy use of Chandelier Exit Indicator and MA Ribbon Indicator for educational purpose

Multiple Colored Moving AveragesMULTIPLE COLORED MOVING AVERAGES - USER GUIDE
DISCLAIMER
----------
Both the code and this documentation were created heavily using artificial intelligence. I'm lazy...
This indicator was inspired by repo32's "Moving Average Colored EMA/SMA" indicator. *
What is this indicator?
-----------------------
This is a TradingView indicator that displays up to 4 different moving averages on your chart simultaneously. Each moving average can be customized with different calculation methods, colors, and filtering options.
Why would I use multiple moving averages?
-----------------------------------------
- See trend direction across different timeframes at once
- Identify support and resistance levels
- Spot crossover signals between fast and slow MAs
- Reduce false signals with filtering options
- Compare how different MA types react to price action
What moving average types are available?
----------------------------------------
11 different types:
- SMA: Simple average, equal weight to all periods
- EMA: Exponential, more weight to recent prices
- WMA: Weighted, linear weighting toward recent data
- RMA: Running average, smooth like EMA
- DEMA: Double exponential, reduced lag
- TEMA: Triple exponential, even less lag
- HMA: Hull, fast and smooth combination
- VWMA: Volume weighted, includes volume data
- LSMA: Least squares, based on linear regression
- TMA: Triangular, double-smoothed
- ZLEMA: Zero lag exponential, compensated for lag
How do I set up the indicator?
------------------------------
Each MA has these settings:
- Enable/Disable: Turn each MA on or off
- Type: Choose from the 11 calculation methods
- Length: Number of periods (21, 50, 100, 200 are common)
- Smoothing: 0-10 levels of extra smoothing
- Noise Filter: 0-5% to ignore small changes
- Colors: Bullish (rising) and bearish (falling) colors
- Line Width: 1-5 pixels thickness
What does the smoothing feature do?
-----------------------------------
Smoothing applies extra calculations to make the moving average line smoother. Higher levels reduce noise but make the MA respond slower to price changes. Use higher smoothing in choppy markets, lower smoothing in trending markets.
What is the noise filter?
--------------------------
The noise filter ignores small percentage changes in the moving average. For example, a 0.3% filter will ignore any MA movement smaller than 0.3%. This helps eliminate false signals from minor price fluctuations.
When should I use this indicator?
---------------------------------
- Trend analysis: See if market is going up, down, or sideways
- Entry timing: Look for price bounces off MA levels
- Exit signals: Watch for MA slope changes or crossovers
- Support/resistance: MAs often act as dynamic levels
- Multi-timeframe analysis: Use different lengths for different perspectives
What are some good settings to start with?
-------------------------------------------
Conservative approach:
- MA 1: EMA 21 (short-term trend)
- MA 2: SMA 50 (medium-term trend)
- MA 3: SMA 200 (long-term trend)
- Low noise filtering (0.1-0.3%)
Active trading:
- MA 1: HMA 9 (very responsive)
- MA 2: EMA 21 (short-term)
- MA 3: EMA 50 (medium-term)
- Minimal or no smoothing
How do I interpret the colors?
------------------------------
Each MA changes color based on its direction:
- Bullish color: MA is rising (upward trend)
- Bearish color: MA is falling (downward trend)
- Gray: MA is flat or unchanged
What should I look for in crossovers?
-------------------------------------
- Golden Cross: Fast MA crosses above slow MA (bullish signal)
- Death Cross: Fast MA crosses below slow MA (bearish signal)
- Multiple crossovers in same direction can confirm trend changes
- Wait for clear separation between MAs after crossover
How do I use MAs for support and resistance?
---------------------------------------------
- In uptrends: MAs often provide support when price pulls back
- In downtrends: MAs may act as resistance on rallies
- Multiple MAs create support/resistance zones
- Stronger levels where multiple MAs cluster together
Can I use this with other indicators?
-------------------------------------
Yes, it works well with:
- Volume indicators for confirmation
- RSI or MACD for timing entries
- Bollinger Bands for volatility context
- Price action patterns for setup confirmation
What if I get too many signals?
-------------------------------
- Increase smoothing levels
- Raise noise filter percentages
- Use longer MA periods
- Focus on major crossovers only
- Wait for multiple MA confirmation
What if signals are too slow?
-----------------------------
- Reduce smoothing to 0
- Lower noise filter values
- Switch to faster MA types (HMA, ZLEMA, DEMA)
- Use shorter periods
- Focus on the fastest MA only
Which MA types work best in different markets?
----------------------------------------------
Trending markets: EMA, DEMA, TEMA (responsive to trends)
Choppy markets: SMA, TMA, HMA with smoothing (less whipsaws)
High volatility: Use higher smoothing and noise filtering
Low volatility: Use minimal filtering for better responsiveness
Do I need all the advanced features?
------------------------------------
No. Start with basic settings:
- Choose MA type and length
- Set colors you prefer
- Leave smoothing at 0
- Leave noise filter at 0
Add complexity only if needed to improve signal quality.
How do I know if my settings are working?
-----------------------------------------
- Backtest on historical data
- Paper trade the signals first
- Adjust based on market conditions
- Keep a trading journal to track performance
- Be willing to modify settings as markets change
Can I save different configurations?
------------------------------------
Yes, save different indicator templates in TradingView for:
- Different trading styles (scalping, swing trading)
- Different market conditions (trending, ranging)
- Different instruments (stocks, forex, crypto)

[DEM] Combo Moving Average Combo Moving Average is designed to create a composite trend-following indicator by averaging seven different types of moving averages into a single smoothed line. The indicator overlays directly on the price chart, combining ALMA (Arnaud Legoux Moving Average), EMA (Exponential), HMA (Hull), RMA (Rolling), SMA (Simple), VWMA (Volume Weighted), and WMA (Weighted) moving averages to provide a more robust and less noisy trend signal. The resulting composite moving average changes color dynamically - displaying green when the trend is upward (current value higher than previous) and red when the trend is downward, offering traders a clear visual representation of the overall market direction across multiple moving average methodologies.

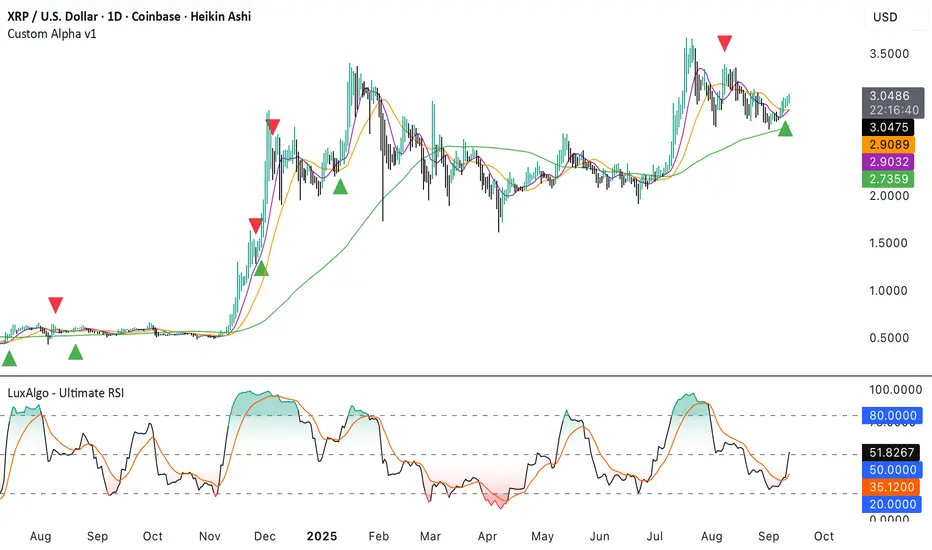
Custom Alpha v1Heiken Ashi based indicator using moving average crossovers combined with LuxAlgo Ultimate RSI with custom weighting to trigger buy and sell signals.
Settings for weightings and signal threshold are fully customizable in the indicator settings.
SMAs can be toggled on/off under the style tab of indicator settings.
20 MA ReversionA mean reversion tactic with the 20 SMA:
the indicator is chcking specific parameters, such as the volume related to the last day's volume, distance from 20 SMA, CCI values and changes, trends, and recent gaps that will act as a magnet.
enjoy!

RTC EMA/SMA Combo IndicatorRTC Combo indicator with 20 EMA, 50 EMA and 200 SMA
Primarily used for Market Structure purpose
Slovenský Hybrid (VWAP, Multi MA)Slovenský Hybrid (VWAP, Multi MA) – JS VWAP/MA
Tento indikátor som vytvoril ja, Ján Salma – mentor Akadémie , špeciálne pre slovenský trh. Je navrhnutý tak, aby ho bolo možné používať aj na bezplatnej verzii TradingView a zároveň aby ostal priestor na pridanie ďalších vlastných indikátorov.
👉 Čoskoro pribudne nová verzia, ktorá bude obsahovať ešte viac nástrojov v jednom balíku.
Funkcie a nastavenia:
Indikátor kombinuje viacero kľúčových prvkov technickej analýzy do jedného nástroja:
Multi Moving Averages (MA)
Môžeš zobraziť až 4 rôzne kĺzavé priemery.
Každý MA sa dá zapnúť alebo vypnúť podľa potreby.
Možnosť nastaviť dĺžku periody.
Výber typu: SMA alebo EMA.
Nastavenie zdroja ceny (Close, Open, High, Low, atď.).
Možnosť upraviť farbu a hrúbku čiary pre lepší prehľad.
VWAP (Volume Weighted Average Price)
VWAP sa dá zapnúť alebo vypnúť.
Nastavenie farby a hrúbky čiary.
Výhody indikátora
Jednoduché a prehľadné nastavenia v slovenskom jazyku.
Ideálne pre začiatočníkov aj pokročilých traderov.
Kombinuje viacero indikátorov do jedného, čo šetrí miesto v grafe.
Umožňuje flexibilne prispôsobiť vzhľad podľa vlastného štýlu obchodovania.
________________________________________
✅ Tento nástroj je výbornou pomôckou pre každého, kto sa chce zamerať na čistý graf, prehľadné nastavenia a efektívne využitie TradingView.
Slovak Hybrid (VWAP, Multi MA) – JS VWAP/MA
This indicator was created by Ján Salma – mentor of the Slovak Academy , especially for the Slovak market. It is designed to work even on the free version of TradingView, while keeping space for additional indicators on your chart.
👉 A new version with more tools combined in one indicator is coming soon!
Features and Settings:
Multi Moving Averages (MA)
Up to 4 customizable moving averages.
Each MA can be turned on/off individually.
Choose between EMA or SMA.
Adjustable length, source, line width, and color.
VWAP (Volume Weighted Average Price)
Can be enabled/disabled.
Adjustable line thickness and color.
Benefits:
Simple and intuitive settings in Slovak language.
Great for both beginners and advanced traders.
Combines multiple indicators into one → saves chart space.
Fully customizable look to fit your trading style.
________________________________________
✅ A clean, flexible, and easy-to-use indicator for every trader who wants efficiency and clarity in their charts.

RSI ADX Bollinger Analysis High-level purpose and design philosophy
This indicator — RSI-ADX-Bollinger Analysis — is a compact, educational market-analysis toolkit that blends momentum (RSI), trend strength (ADX), volatility structure (Bollinger Bands) and simple volumetrics to provide traders a snapshot of market condition and trade idea quality. The design philosophy is explicit and layered: use each component to answer a different question about price action (momentum, conviction, volatility, participation), then combine answers to form a more robust, explainable signal. The mashup is intended for analysis and learning, not automatic execution: it surfaces the why behind signals so traders can test, learn and apply rules with risk management.
________________________________________
What each indicator contributes (component-by-component)
RSI (Relative Strength Index) — role and behavior: RSI measures short-term momentum by comparing recent gains to recent losses. A high RSI (near or above the overbought threshold) indicates strong recent buying pressure and potential exhaustion if price is extended. A low RSI (near or below the oversold threshold) indicates strong recent selling pressure and potential exhaustion or a value area for mean-reversion. In this dashboard RSI is used as the primary momentum trigger: it helps identify whether price is locally over-extended on the buy or sell side.
ADX (Average Directional Index) — role and behavior: ADX measures trend strength independently of direction. When ADX rises above a chosen threshold (e.g., 25), it signals that the market is trending with conviction; ADX below the threshold suggests range or weak trend. Because patterns and momentum signals perform differently in trending vs. ranging markets, ADX is used here as a filter: only when ADX indicates sufficient directional strength does the system treat RSI+BB breakouts as meaningful trade candidates.
Bollinger Bands — role and behavior: Bollinger Bands (20-period basis ± N standard deviations) show volatility envelope and relative price position vs. a volatility-adjusted mean. Price outside the upper band suggests pronounced extension relative to recent volatility; price outside the lower band suggests extended weakness. A band expansion (increasing width) signals volatility breakout potential; contraction signals range-bound conditions and potential squeeze. In this dashboard, Bollinger Bands provide the volatility/structural context: RSI extremes plus price beyond the band imply a stronger, volatility-backed move.
Volume split & basic MA trend — role and behavior: Buy-like and sell-like volume (simple heuristic using close>open or closeopen) or sell-like (close1.2 for validation and compare win rate and expectancy.
4. TF alignment: Accept signals only when higher timeframe (e.g., 4h) trend agrees — compare results.
5. Parameter sensitivity: Vary RSI threshold (70/30 vs 80/20), Bollinger stddev (2 vs 2.5), and ADX threshold (25 vs 30) and measure stability of results.
These exercises teach both statistical thinking and the specific failure modes of the mashup.
________________________________________
Limitations, failure modes and caveats (explicit & teachable)
• ADX and Bollinger measures lag during fast-moving news events — signals can be late or wrong during earnings, macro shocks, or illiquid sessions.
• Volume classification by open/close is a heuristic; it does not equal TAPEDATA, footprint or signed volume. Use it as supportive evidence, not definitive proof.
• RSI can remain overbought or oversold for extended stretches in persistent trends — relying solely on RSI extremes without ADX or BB context invites large drawdowns.
• Small-cap or low-liquidity instruments yield noisy band behavior and unreliable volume ratios.
Being explicit about these limitations is a strong point in a TradingView description — it demonstrates transparency and educational intent.
________________________________________
Originality & mashup justification (text you can paste)
This script intentionally combines classical momentum (RSI), volatility envelope (Bollinger Bands) and trend-strength (ADX) because each indicator answers a different and complementary question: RSI answers is price locally extreme?, Bollinger answers is price outside normal volatility?, and ADX answers is the market moving with conviction?. Volume participation then acts as a practical check for real market involvement. This combination is not a simple “indicator mashup”; it is a designed ensemble where each element reduces the others’ failure modes and together produce a teachable, testable signal framework. The script’s purpose is educational and analytical — to show traders how to interpret the interplay of momentum, volatility, and trend strength.
________________________________________
TradingView publication guidance & compliance checklist
To satisfy TradingView rules about mashups and descriptions, include the following items in your script description (without exposing source code):
1. Purpose statement: One or two lines describing the script’s objective (educational multi-indicator market overview and idea filter).
2. Component list: Name the major modules (RSI, Bollinger Bands, ADX, volume heuristic, SMA trend checks, signal tracking) and one-sentence reason for each.
3. How they interact: A succinct non-code explanation: “RSI finds momentum extremes; Bollinger confirms volatility expansion; ADX confirms trend strength; all three must align for a BUY/SELL.”
4. Inputs: List adjustable inputs (RSI length and thresholds, BB length & stddev, ADX threshold & smoothing, volume MA, table position/size).
5. Usage instructions: Short workflow (check TF alignment → confirm participation → define stop & R:R → backtest).
6. Limitations & assumptions: Explicitly state volume is approximated, ADX has lag, and avoid promising guaranteed profits.
7. Non-promotional language: No external contact info, ads, claims of exclusivity or guaranteed outcomes.
8. Trademark clause: If you used trademark symbols, remove or provide registration proof.
9. Risk disclaimer: Add the copy-ready disclaimer below.
This matches TradingView’s request for meaningful descriptions that explain originality and inter-component reasoning.
________________________________________
Copy-ready short publication description (paste into TradingView)
Advanced RSI-ADX-Bollinger Market Overview — educational multi-indicator dashboard. This script combines RSI (momentum extremes), Bollinger Bands (volatility envelope and band expansion), ADX (trend strength), simple SMA trend bias and a basic buy/sell volume heuristic to surface high-quality idea candidates. Signals require alignment of momentum, volatility expansion and rising ADX; volume participation is displayed to support signal confidence. Inputs are configurable (RSI length/levels, BB length/stddev, ADX length/threshold, volume MA, display options). This tool is intended for analysis and learning — not for automated execution. Users should back test and apply robust risk management. Limitations: volume classification here is a heuristic (close>open), ADX and BB measures lag in fast news events, and results vary by instrument liquidity.
________________________________________
Copy-ready risk & misuse disclaimer (paste into description or help file)
This script is provided for educational and analytical purposes only and does not constitute financial or investment advice. It does not guarantee profits. Indicators are heuristics and may give false or late signals; always back test and paper-trade before using real capital. The author is not responsible for trading losses resulting from the use or misuse of this indicator. Use proper position sizing and risk controls.
________________________________________
Risk Disclaimer: This tool is provided for education and analysis only. It is not financial advice and does not guarantee returns. Users assume all risk for trades made based on this script. Back test thoroughly and use proper risk management.

Liquidity Lines 2.0Liquidity Lines Indicator Description:
This indicator detects points of liquidity based on reversals in price action. It simulates simple moving average (SMA) candles and identifies when raw price candles engulf either the low of a bullish SMA candle or the high of a bearish SMA candle. The liquidity point is then placed at the high of the bearish SMA candle or the low of the bullish SMA candle. These levels often correspond to areas where many traders place stop-loss orders and can provide insight into where “smart money” might be hunting liquidity.
Features and Alerts:
Liquidity Lines automatically track upper and lower liquidity levels and plot them as customizable horizontal lines on the chart. Users can adjust line length, color, width, and style, and choose whether lines extend to the right. The indicator also detects when these liquidity levels are “swept” by price and triggers alerts in real time, allowing traders to be notified of potential stop-loss hunts or key market reactions as they happen. This makes it easy to monitor critical liquidity zones without constantly watching the chart.
How to Use Strategically:
Traders can use these liquidity points to anticipate potential price reactions. For example, if price approaches a lower liquidity line from above, it may act as support or a zone where stop orders are being triggered. Conversely, an upper liquidity line may act as resistance or a trigger zone for stops above the market. Combining these levels with your existing market structure, trend analysis, or confirmation signals can help identify high-probability entries, exits, and areas where smart money activity may occur.

EMA/SMA Zones 9, 21, 30, 50, 100, 200 + othersMeant for swing trading on the daily chart, feel free to copy and remove/add sections as you wish (Used chatGPT for a lot of it).
