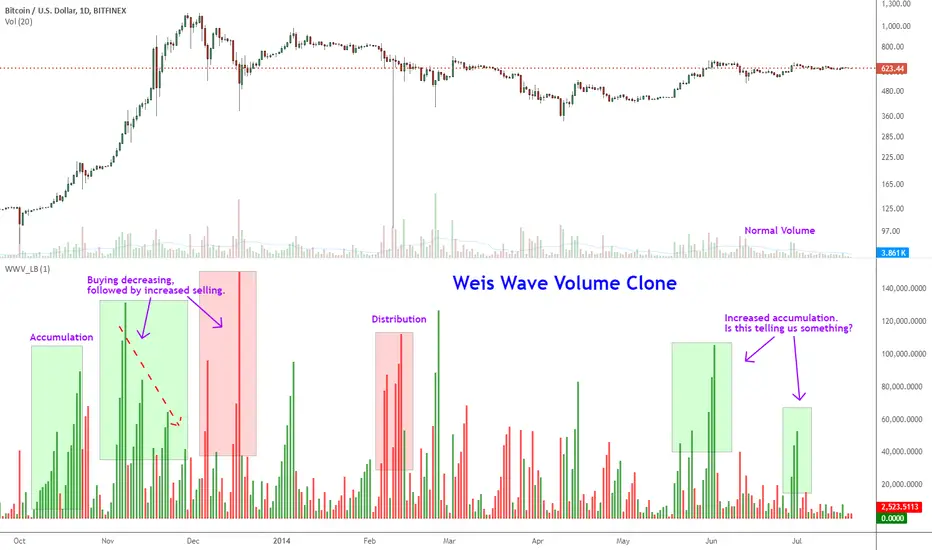
Indicator: Weis Wave Volume [LazyBear]This indicator takes market volume and organizes it into wave charts, clearly highlighting inflection points and regions of supply/demand.
Try tuning this for your instrument (Forex not supported) by adjusting the "Trend Detection Length". This "clubs together" minor waves. If you like an oscillator-kind-of display, enable "ShowDistributionBelowZero" option.
Note: This indicator is a port of a clone of WeisVolumePlugin available for another platform. I don't know how close this is to the original Weis, if any has access to it, do let me know how this compares. Thanks.
More info:
weisonwyckoff.com
Complete list of my indicators:
ค้นหาในสคริปต์สำหรับ "wave"
Elliott Wave - Wave 3 Entry EngineThis indicator is a Wave 3 entry engine built on top of an Elliott Wave–style 1-2-3 structure. It automatically finds potential Wave 3 trades, manages a simple R-multiple target/stop model, and marks outcomes directly on the chart.
What the indicator does
At a high level, the script:
Detects swing points on three “degrees”
Small (S) – fast, local swings
Medium (M) – broader swings
Large (L) – higher-timeframe context only
Looks for a 3-pivot pattern (W0 → W1 → W2)
Bullish setup: Low → High → Higher Low (L-H-L)
Bearish setup: High → Low → Lower High (H-L-H)
Checks whether that pattern is a valid Wave 1–2 structure
Using multiple rules:
Wave 2 retraces Wave 1 by a configurable fraction
Wave 1 is strong enough (percentage move + slope)
Wave 2 doesn’t overshoot Wave 0 too far
Trend direction and swing “consensus” across S/M/L degrees line up
Scores the setup (Pre-W3 Score)
The script calculates a 0–1 score based on:
How “nice” the Wave 2 retracement is vs the ideal level
How much stronger Wave 1’s slope is vs Wave 2’s pullback
How much consensus there is across the swing engine (S/M/L)
Only setups above your chosen minimum Pre-W3 score and that pass alignment checks become Wave 3 candidates.
Waits for breakout → creates a Wave 3 “entry”
For longs: price breaks above the Wave 1 high (plus an optional tick buffer)
For shorts: price breaks below the Wave 1 low (minus buffer)
When triggered, the indicator:
Stores entry price (close at breakout)
Sets a stop beyond Wave 2 (with optional extra ticks)
Calculates a target based on a fixed R multiple (e.g., 2R)
Tracks the trade until exit or timeout
For each open W3 trade, it monitors:
Target hit → marks “W3 ✅”
Stop hit → marks “W3 ❌”
Bar where both could have hit → conservative loss “W3 ?/❌”
Time-based expiry (too many bars in trade) → “W3 ⏰”
Candidates that never get a breakout within your chosen max bars from W2 can also be marked as timeout (⏰).
Visual elements on the chart
The script can plot several helpful visuals:
Swing connector lines (Small/Medium/Large)
Small = blue
Medium = purple
Large = orange
These show the detected swings at each degree
Pre-W3 labels at Wave 2 (optional)
Signals :
"Pre-W3 Long XX%" or"Pre-W3 Short XX%"
Placed at the Wave 2 pivot
Colored yellow, with the % score rounded to an integer
W3 Entry labels (optional)
"W3 Long Entry" below the bar for longs (green)
"W3 Short Entry" above the bar for shorts (red)
Outcome labels (optional)
W3 ✅ – target hit
W3 ❌ – stop hit
W3 ?/❌ – both hit on same bar, treated as loss
W3 ⏰ – candidate or trade timed out
All these can be toggled in the “Wave 3 Engine (Pre-W3 + Entries + Outcomes)” group.
Input groups & how to use them
Swing Detection (Small / Medium / Large)
These groups control how the script finds swing highs/lows using a multi-parameter pivot scan:
Left Min / Left Max / Right Min / Right Max
Define the pivot “strength” ranges (how many bars to the left/right the high/low must dominate).
Minimum swing % (post-aggregation)
Ensures that, once swings are merged and cleaned up, each swing is at least this % move from the prior opposite swing.
Loop Filters (Small/Medium/Large loop min % change)
Extra gating inside the pivot-search loop, so small noise pivots can be ignored even before final swing construction.
Practical use:
Tighten % thresholds or increase left/right bars to reduce noise.
Loosen them to get more swings and more potential W3 setups.
Wave 3 Logic
Wave 2 depth
W2 min / max retracement of W1 (fraction)
Example: 0.30–0.80 means W2 must retrace 30–80% of W1.
Ideal W2 retracement (for scoring)
Often set around 0.618 (classic fib). The closer W2 is to this, the higher the retracement part of the score.
Max W2 beyond W0 (%)
How far W2 may push past W0 (in %) before the setup is invalid. Set to 0 to disable this filter.
Wave 1 strength
Min W1 move (%)
Ensures Wave 1 itself is meaningful.
Min |W1 slope| / |W2 slope|
Wave 1 must be “steeper” than Wave 2’s correction.
Slope ratio for max score
Above this, extra slope advantage doesn’t improve the score further.
Scoring & Trend Alignment
Min Pre-W3 score (0..1)
Hard gate: anything below this won’t become a W3 candidate.
Trend alignment (S/M/L)
Options:
None – ignore swing directions, purely pattern/score based
Majority – at least 2 of S/M/L must point in the W3 direction
AllThree, S+M, S+L, M+L – stricter alignment variants
Alignment uses the latest swing direction (up or down) for each degree.
Max W3 candidates to track
Limits how many candidates + trades are stored. Old, already-closed items are pruned first; open trades are never pruned.
This is an indicator, not an order engine**:** it doesn’t place trades; it only marks hypothetical Wave 3 entries and outcomes based on your settings. Always validate on historical data and combine with your own analysis and risk management before using it in live trading.

[iQ]PRO Fractals in Dealing Range and Fib Levels+⚡️ PRO Combined Fractal & Dealing Range THEORY W QUADRANTS AND FIB LEVELS: Dynamic Price Structure Analysis
The PRO Combined Fractal & Dealing Range indicator is a proprietary, cutting-edge market structure analysis tool designed to give serious traders a tactical edge by merging advanced Fractal-based wave detection with a sophisticated Dynamic Dealing Range system. This professional-grade utility provides a crystal-clear, multi-layered view of key supply and demand zones, trend reversals, and structural boundaries.
Key Features & Proprietary Logic
This indicator is built on two harmoniously integrated engines, providing a comprehensive view that goes far beyond standard technical analysis.
📈 Adaptive Fractal Wave Engine
Our custom-tuned Fractal Engine employs a unique, multi-degree detection process to identify both Base Swings and Higher Degree Swings with unparalleled precision.
Proprietary Period Calculation: The engine utilizes a specialized formula based on the Golden Ratio (ϕ) to determine a refined higher-degree lookback period: Period
F
=floor(Period
Base
ϕ
). This adaptive logic helps filter market noise and highlight only the most significant structural turning points.
Dynamic Labeling: Automatically places visual markers on the chart to define confirmed Highs and Lows, simplifying the interpretation of market structure and potential directional shifts.
🎯 Dynamic Dealing Range System
This core component provides a detailed, automatically calculated framework of critical price levels, serving as a roadmap for potential entries, targets, and risk management.
Strategic Quadrant Mapping: Automatically establishes a significant Dealing Range based on a customizable lookback period, then divides it into four distinct Quadrants (Q1-Q4). These zones highlight areas of Premium, Equilibrium (Q2-Q3), and Discount, guiding trading decisions relative to the overall range.
Advanced Level Detection:
Fibonacci Retracement: Displays key Fibonacci levels (e.g., 50%, 61.8%, 78.6%) within a user-defined range, identifying high-probability reversal and reaction areas.
Liquidity & Pivots: The indicator incorporates a proprietary Liquidity Detection Algorithm using adaptive pivot sensitivity to identify significant historical support and resistance zones.
Inter-Timeframe Structure: Features a non-repainting method to display Important Highs/Lows (such as Monthly, Weekly, and Daily extremes) right on your current chart, bridging the gap between timeframes.
Professional Trader Utility
Clarity on Price Action: Instantly see the structure of the market and which direction the momentum is flowing based on the confirmed fractal swings.
Actionable Alerts: Receive timely and precise alerts when price approaches critical psychological and structural levels, including the Quadrant boundaries and the highly reactive Fibonacci 0.618 level.
Information at a Glance: A clean, professional table is displayed on the chart, summarizing the calculated range boundaries (Quadrant and Fibonacci Highs/Lows) for immediate reference.
The PRO Combined Fractal & Dealing Range is an indispensable tool for traders focused on market structure, institutional price action, and trading within clearly defined ranges. It is designed to minimize subjectivity and maximize clarity on your TradingView chart.
NO REPAINT ;)

Qosh GRC 3Qosh GRC 3
Comprehensive indicator for crypto market analysis with advanced correlation capabilities and wave strength assessment.
Core Components
Mid Index (Green line)
Dynamic middle line based on EMA with hesitation filter. Determines current market zone (Bull/Bear).
Settings:
• Length: 230 (default)
• Hesitation: 0.0001
Mid Index 2 (Black line)
Channel middle line based on highest/lowest values. Visibility depends on slope (>0.15% change over 4 bars).
Settings:
• Length: 20 (default)
SMA
Two moving averages for trend analysis:
• SMA A (red): 50 periods
• SMA B (blue): 200 periods
Main Bars with Open Interest
Bar color depends on Open Interest level:
• Blue = bullish bar
• Red = bearish bar
• Opacity inversely proportional to OI (higher interest → more saturated color)
opacity = reverseAndRound(((oi_smoothed * 100 / 1)) / 2)
bar_color = color.new(close >= open ? color.blue : color.red, opacity)
Oscillators (Lord Caramelo)
BTC Oscillator
Semi-transparent green oscillator based on BTCUSDT. Shows Bitcoin's base movement for comparison.
Main Oscillator (4 candles)
Price movement decomposition into 4 components:
• Verde (green) — bullish strength
• Branca (white) — neutral zone
• Vermelha (red) — bearish strength
• Azul (blue) — baseline
Wave Strength (Candle Strength)
Displayed on top of main oscillator:
• Aqua = bullish wave
• Maroon = bearish wave
Candle height = wave intensity (based on TCUD calculations).
Critical Levels
• 0.2 (green) — oversold zone
• 0.8 (purple) — extreme overbought
Critical Zone Indication
Background colors when oscillator breaches critical levels and price diverges from Mid Index >2%:
• Blue background = bullish extremity
• Red background = bearish extremity
Correlation
Correlation A (primary)
Correlation of current asset with selected ticker (default BTCUSDT). Displays scaled candles of correlating asset.
Correlation B and C (additional)
Correlation calculation between two arbitrary ticker pairs.
Information Table
Top right corner displays:
• Movement strength of Mid Index and Mid Index 2
• Correlation values A/B/C
• Current market state (Bull/Bear)
━━━━━━━━━━━━━━━━━━━━━━

Cumulative Volume Delta (HA Option)# **📘 Ultimate Guide to Trading With CVD Heikin Ashi (CVD+)**
## **🔍 What This Indicator Shows**
This tool plots **Cumulative Volume Delta (CVD)** as candlesticks—optionally transformed into **Heikin Ashi CVD candles**.
Instead of price, each candle represents the *battle between buyers and sellers* within your chosen timeframe.
**Volume Delta = Buying Volume – Selling Volume**
CVD takes all deltas and stacks them cumulatively, showing who is controlling the auction *over time*.
With Heikin Ashi smoothing layered on top, trend detection becomes cleaner, letting you see the “true pressure” behind price moves.
---
# **💡 Why CVD Is a Game Changer**
Most traders only see price.
Serious traders watch **pressure**.
CVD exposes what price hides:
* Absorption
* Hidden accumulation
* Seller exhaustion
* Fake breakouts
* True reversals
* Momentum strength / weakness
* Smart money footprint
When combined with Heikin-Ashi smoothing, you get delta trends with way less noise and fewer fake flips.
---
# **📈 How to Actually Use It (The Edge)**
## **1. Spot True Trend vs. Fake Trend**
If **price goes up** but **CVD goes down**, that’s:
* Passive sellers absorbing
* A weak rally
* High probability of reversal
If **price pulls back** but **CVD keeps rising**, that’s:
* Secret accumulation
* A continuation setup
* Great dip-buy opportunity
**Rule of thumb:**
🔹 *Follow the CVD trend, not the price noise.*
---
## **2. Catch Reversals Early**
Watch for:
### **🔻 Bearish Reversal Signals**
* CVD makes a **lower high**
* Heikin Ashi CVD prints **red bodies with rising upper shadows**
* Price makes one final push up on low delta
This is classic distribution → the drop usually follows fast.
### **🔹 Bullish Reversal Signals**
* CVD forms a **higher low**
* HA CVD flips from red to green with full bodies
* Price still looks weak = bottom forming
This is exactly how pros catch bottoms early.
---
## **3. Identify Absorption Levels**
If price hits a level multiple times but CVD keeps climbing (or falling), that level is being defended.
Example:
* Price stalls at support
* CVD keeps rising
= **Buyers absorbing sells → high-probability bounce**
Opposite works for resistance.
---
## **4. Validate Breakouts**
A breakout with *weak or negative CVD* is usually a trap.
A breakout with **strong, rising HA CVD** is real.
If CVD diverges from the breakout direction → fade it.
If CVD confirms → ride it.
---
## **5. Use Heikin Ashi to Stay in Trends**
HA smoothing removes the nasty chop of raw delta data.
Look for:
* Consecutive **full-body teal candles = strong buying wave**
* Consecutive **full-body red candles = strong selling wave**
* Small-bodied candles after a trend = momentum dying
This keeps you in winners longer and cuts losers faster.
---
# **🎯 Practical Trading Playbook**
### **A) Long Setup**
1. Price pullback into support
2. CVD stays bullish or makes a higher low
3. HA CVD flips green or prints a strong body
4. Enter long
5. Stop under CVD structural low
### **B) Short Setup**
1. Price pushes into resistance
2. CVD forms bearish divergence
3. HA CVD prints red bodies
4. Enter short
5. Stop above CVD swing high
### **C) Chop Filter**
No clear HA CVD trend = avoid trading → stop donating money to the market.
---
# **🧠 Tips for Mastery**
* Use lower timeframe delta (1m–5m) for scalping entries
* Use a higher anchor timeframe (1D) to define direction
* When price trends but CVD is flat → expect a fakeout
* When CVD trends but price is flat → expect a breakout
* Trade WITH delta, fade AGAINST delta
---
# **⚠️ Important Notes**
* Crypto = full tick-by-tick volume → CVD is extremely accurate
* Stocks = depends on your broker/data vendor
* Futures = best signal-to-noise ratio
* If your symbol has no volume → indicator will warn you
---
# **📥 Recommended Settings**
* **Anchor timeframe**: 1D or 4H
* **Lower timeframe**: 1m, 3m, or 5m
* **Heikin Ashi**: ON for trend filtering, OFF for raw delta
---
# **🔥 Final Word**
Price can lie.
Delta usually doesn’t.
CVD + Heikin Ashi gives you the closest thing to reading the market’s heartbeat in real time.
Use it to confirm breakouts, detect reversals early, identify real trend strength, and avoid getting caught in manipulation.
If you learn to read CVD well…
you stop trading price, and start trading the **intent** behind the price.

Mirror Blocks: StrategyMirror Blocks is an educational structural-wave model built around a unique concept:
the interaction of mirrored weighted moving averages (“blocks”) that reflect shifts in market structure as price transitions between layered symmetry zones.
Rather than attempting to “predict” markets, the Mirror Blocks framework visualizes how price behaves when it expands away from, contracts toward, or flips across stacked WMA structures. These mirrored layers form a wave-like block system that highlights transitional zones in a clean, mechanical way.
This strategy version allows you to study how these structural transitions behave in different environments and on different timeframes.
The goal is understanding wave structure, not generating signals.
How It Works
Mirror Blocks builds three mirrored layers:
Top Block (Structural High Symmetry)
Base Block (Neutral Wave)
Bottom Block (Structural Low Symmetry)
The relative position of these blocks — and how price interacts with them — helps visualize:
Compression and expansion
Reversal zones
Wave stability
Momentum transitions
Structure flips
A structure is considered bullish-stack aligned when:
Top > Base > Bottom
and bearish-stack aligned when:
Bottom > Base > Top
These formations create the core of the Mirror Blocks wave engine.
What the Strategy Version Adds
This version includes:
Long Only, Short Only, or Long & Short modes
Adjustable symmetry distance (Mirror Distance)
Configurable WMA smoothing length
Optional trend filter using fast/slow MA comparison
ENTER / EXIT / LONG / SHORT labels for structural transitions
Fixed stop-loss controls for research
A clean, transparent structure with no hidden components
It is optimized for educational chart study, not automated signals.
Intended Purpose
Mirror Blocks is meant to help traders:
Study structural transitions
Understand symmetry-based wave models
Explore how price interacts with mirrored layers
Examine reversals and expansions from a mechanical perspective
Conduct long and short backtesting for research
Develop a deeper sense of market rhythm
This is not a prediction model.
It is a visual and structural framework for understanding movement.
Backtesting Disclaimer
Backtest results can vary depending on:
Slippage settings
Commission settings
Timeframe
Asset volatility
Structural sensitivity parameters
Past performance does not guarantee future results.
Use this as a research tool only.
Warnings & Compliance
This script is educational.
It is not financial advice.
It does not provide signals.
It does not promise profitability.
The purpose is to help visualize structure, not predict price.
The strategy features are simply here to help users study how structural transitions behave under various conditions.
License
Released under the Michael Culpepper Gratitude License (2025).
Use and modify freely for education and research with attribution.
No resale.
No promises of profitability.
Purpose is understanding, not signals.

Neon Waves Oscillator [NinjADeviL]Neon Waves Oscillator
The Neon Waves Oscillator is inspired by modern neon-style visual design and displays four smooth waves representing normalized price movement using ATR. The waves highlight changes in momentum, volatility, and market rhythm in a clean, sharp, and visually appealing way, enhanced by a soft glow effect that adds depth and clarity.
Key Features:
🌈 Four smooth neon-colored waves
⚡ ATR-based normalization for consistent behavior across all assets
🎨 Dynamic glow background for a rich visual appearance
🔎 Helps identify momentum shifts, volatility cycles, and trend transitions
🧠 EMA-based smoothing for stability and high accuracy
Ideal for traders focused on Price Action, Momentum, or anyone who prefers a clean, intuitive, and modern visual oscillator.
Developed by NinjADeviL.

Sigma Trinity ModelAbstract
Sigma Trinity Model is an educational framework that studies how three layers of market behavior interact within the same trend: (1) structural momentum (Rasta), (2) internal strength (RSI), and (3) continuation/compounding structure (Pyramid). The model deliberately combines bar-close momentum logic with intrabar, wick-aware strength checks to help users see how reversals form, confirm, and extend. It is not a signal service or automation tool; it is a transparent learning instrument for chart study and backtesting.
Why this is not “just a mashup”
Many scripts merge indicators without explaining the purpose. Sigma Trinity is a coordinated, three-engine study designed for a specific learning goal:
Rasta (structure): defines when momentum actually flips using a dual-line EMA vs smoothed EMA. It gives the entry/exit framework on bar close for clean historical study.
RSI (energy): measures internal strength with wick-aware triggers. It uses RSI of LOW (for bottom touches/reclaims) and RSI of HIGH (for top touches/exhaustion) so users can see intrabar strength/weakness that the close can hide.
Pyramid (progression): demonstrates how continuation behaves once momentum and strength align. It shows the logic of adds (compounding) as a didactic layer, also on bar close to keep historical alignment consistent.
These three roles are complementary, not redundant: structure → strength → progression.
Architecture Overview
Execution model
Rasta & Pyramid: bar close only by default (historically stable, easy to audit).
RSI: per tick (realtime) with bar-close backup by default, using RSI of LOW for entries and RSI of HIGH for exits. This makes the module sensitive to intra-bar wicks while still giving a close-based safety net for backtests.
Stops (optional in strategy builds): wick-accurate: trail arms/ratchets on HIGH; stop hit checks with LOW (or Close if selected) with a small undershoot buffer to avoid micro-noise hits.
Visual model
Dual lines (EMA vs smoothed EMA) for Rasta + color fog to see direction and compression/expansion.
Rungs (small vertical lines) drawn between the two Rasta lines to visualize wave spacing and rhythm.
Clean labels for Entry/Exit/Pyramid Add/RSI events. Everything is state-locked to avoid spamming.
Module 1 — Rasta (Structural Momentum Layer)
Goal: Identify structural momentum reversals and maintain a consistent, replayable backbone for study.
Method:
Compute an EMA of a chosen price source (default Close), and a smoothed version (SMA/EMA/RMA/WMA/None selectable).
Flip points occur when the EMA line crosses the smoothed line.
Optional EMA 8/21 trend filter can gate entries (long-bias when EMA8 > EMA21). A small “adaptive on flip” option lets an entry fire when the filter itself flips to ON and the EMA is already above the smoothed line—useful for trend resumption.
Why bar close only?
Bar-close Rasta gives a stable, auditable timeline for the structure of the trend. It teaches users to separate “structure” (close-resolved) from “energy” (intrabar, via RSI).
Visuals:
Fog between the lines (green/red) to show regime.
Rungs between lines to show spread (compression vs expansion).
Optional plotting of EMA8/EMA21 so users can see the gating effect.
Module 2 — RSI (Internal Strength / Energy Layer)
Goal: Reveal the intrabar strength/weakness that often precedes or confirms structural flips.
Method:
Standard RSI with adjustable length and signal smoothing for the panel view.
Logic uses wick-aware sources:
Entry trigger: RSI of LOW (same RSI length) touching or below a lower band (default 15). Think of it as intraband reactivation from the bottom, using the candle’s deepest excursion.
Exit trigger: RSI of HIGH touching or above an upper band (default 85). Think of it as exhaustion at the top, using the candle’s highest excursion.
Realtime + Close Backup: fires intrabar on tick, but if the realtime event was missed, the close backup will note it at bar end.
Cooldown control: optional bars-between-signals to avoid rapid re-triggers on choppy sequences.
Why wick-aware RSI?
A close-only RSI can miss the true micro-extremes that cause reversals. Using LOW/HIGH for triggers captures the behavior that traders actually react to during the bar, while the bar-close backup preserves historical reproducibility.
Module 3 — Pyramid (Continuation / Compounding Layer)
Goal: Teach how continuation behaves once a trend is underway, and how adds can be structured.
Method:
Same dual-line logic as Rasta (EMA vs smoothed EMA), but only fires when already in a position (or after prior entry conditions).
Supports the same EMA 8/21 filter and optional adaptive-on-flip behavior.
Bar close only to maintain historical cohesion.
What it teaches:
Adds tend to cluster when momentum persists.
Students can experiment with add spacing and compare “one-shot entries” vs “laddered adds” during strong regimes.
How the Pieces Work Together
Rasta establishes the structural frame (when the wave flip is real enough to record at close).
RSI validates or challenges that structure by tracking intrabar energy at the extremes (low/high touches).
Pyramid shows what sustained continuation looks like once (1) and (2) align.
This produces a layered view: Structure → Energy → Progression. Users can see when all three line up (strongest phases) and when they diverge (riskier phases or transitions).
How to Use It (Step-by-Step)
Quick Start
Apply script to any symbol/timeframe.
In Strategy/Indicator Properties:
Enable On every tick (recommended).
If available, enable Using bar magnifier and choose a lower resolution (e.g., 1m) to simulate intrabar fills more realistically.
Keep On bar close unchecked if you want to observe realtime logic in live charts (strategies still place orders on close by platform design).
Default behavior: Rasta & Pyramid = bar close; RSI = per tick with close backup.
Reading the Chart
Watch for Rasta Entry/Exit labels: they define clean structural turns on close.
Watch RSI Entry (LOW touch at/below lower band) and RSI Exit (HIGH touch at/above upper band) to gauge internal energy extremes.
Pyramid Add labels reveal continuation phases once a move is already in progress.
Tuning
Rasta smoothing: choose SMA/EMA/RMA/WMA or None. Higher smoothing → later but cleaner flips; lower smoothing → earlier but choppier.
RSI bands: a common educational setting is 15/85 for strong extremes; 20/80 is a bit looser.
Cooldown: increase if you see too many RSI re-fires in chop.
EMA 8/21 filter: toggle ON to study “trend-gated” entries, OFF to study raw momentum flips.
Backtesting Notes (for Strategy Builds)
Stops (optional): trail is armed when price advances by a trigger (default D–F₀), ratchets only upward from HIGH, and hits from LOW (or Close if chosen) with a tiny undershoot buffer to avoid micro-wicks.
Order sequencing per bar (mirrors the script’s code comments):
Trail ratchet via HIGH
Intrabar stop hit via LOW/CLOSE → immediate close
If still in position at bar close: process exits (Rasta/RSI)
If still in position at bar close: process Pyramid Add
If flat at bar close: process entries (Rasta/RSI)
Platform reality: strategies place orders at bar close in historical testing; the intrabar logic improves realism for stops and event marking but final order timestamps are still close-resolved.
Inputs Reference (common)
Modules: enable/disable RSI and Pyramid learning layers.
Rasta: EMA length, smoothing type/length, EMA8/21 filter & adaptive flip, fog opacity, rungs on/off & limit.
RSI: RSI length, signal MA length (panel), Entry band (LOW), Exit band (HIGH), cooldown bars, labels.
Pyramid: EMA length, smoothing, EMA8/21 filter & adaptive adds.
Execution: toggle Bar Close Only for Rasta/Pyramid; toggle Realtime + Close Backup for RSI.
Stops (strategy): Fixed Stop % (first), Fixed Stop % (add), Trail Distance %, Trigger rule (auto D–F₀ or custom), undershoot buffer %, and hit source (LOW/CLOSE).
What to Study With It
Convergence: how often RSI-LOW entry touches precede the next Rasta flip.
Divergence: cases where RSI screams exhaustion (HIGH >= upper band) but Rasta hasn’t flipped yet—often transition zones.
Continuation: how Pyramid adds cluster in strong moves; how spacing changes with smoothing/filter choices.
Regime changes: use EMA8/21 filter toggles to see what happens at macro turns vs chop.
Limitations & Scope
This is a learning tool, not a trade copier. It does not provide financial advice or automated execution.
Intrabar results depend on data granularity; bar magnifier (when available) can help simulate lower-resolution ticks, but true tick-by-tick fills are a platform-level feature and not guaranteed across all symbols.
Suggested Publication Settings (Strategy)
Initial capital: 100
Order size: 100 USD (cash)
Pyramiding: 10
Commission: 0.25%
Slippage: 3 ticks
Recalculate: ✓ On every tick
Fill orders: ✓ Using bar magnifier (choose 1m or similar); leave On bar close unchecked for live viewing.
Educational License
Released under the Michael Culpepper Gratitude License (2025).
Use and modify freely for education and research with attribution. No resale. No promises of profitability. Purpose is understanding, not signals.

Daedalus Gold Ratio Waves61.8 weekly moving average with extensive waves using percentages off the mean

Market Profit X (MPX)Hi Traders,
Welcome to Market Profit X (MPX)
Keep
It
Simple
Stupid
I have created MPX to give a main screen visual with simple easy Buy/Sell signals based on your favorite wave trend oscillators.
Traders' learners through to advanced will and I say will PROFIT using MPX easy to follow system.
The 12: Tema and 56: Tema are utilized umm yeah that's right the same ones you are paying thousands for 56 Tema giving you your baseline or zero line on the common Wave Trend Oscillator and the 12 Tema giving you that momentum where all chasing.
One thing after years of studying what really is the bread and butter? Money money money that's what matters money flowing in money flowing out Long/Short yeah. So that's what your BUY/SELL signals are based on and they work.
I have added ATR for stops and have found after extensive trials setting multiplier to 2.5 you are going to have a high % of winning trades which you can thank me with i will send my BTC wallet Addy.
I have added the 8 EMA for another extremely rewarding swing system that i may share with my crew or people I like. I hear you already 8 EMA yeah right that's old worth nothing well it's what I do with this is the magic.
So how do I use? i can see the DM box filling up now because i have been reluctant to release this simple little indicator because i trialed it put in hard yards and know it's a banger.
first one i share and if i get no donations i take down because i know you will be hitting home runs.
Top-down analysis first are we bull or bear? then i drop to the 30m or 15m and wait for BUY/SELL signal go to your favorite wave trend oscillator i have mine over at Marketspy.com and take a good look at your money flow. I will wait for candle to close and confirm then buy next candles open or drop down to the 5m for slight pullback for entry.
Tip one: I like to buy 60 or -60 levels with confidence what will catch you reg bear divs.
like everything not every signal a home run that's why as soon as you take the trade you are looking at your stop and setting it in stone if you get hit o well onto the next. What's your number one? protecting your bank.
Now like i said the 8EMA system is a special spice i may share with special people as it requires training.
Enjoy tell me i suck i don't care i know it works and makes consistent money and my trading group guys will vouch for me.
Thank you, Trader (IKN) I Know Nothing out.

[SwingMann©] EWTrend+ EWTrend+
Trend and Elliott Wave Cycle Indicator
Description:
EWTrend+ is a versatile indicator specifically designed to visualize market trends and Elliott Wave cycles. By combining multiple EMA lengths with flexible smoothing options, it enables precise trend analysis and signal generation.
Key Features:
Dynamic Trend Colors: Green for uptrends, red for downtrends, gray for neutral phases.
Multiple EMAs: Configurable lengths for different time horizons.
Flexible Smoothing: Choose SMA, EMA, WMA, RMA, DMA, or no smoothing at all.
Signal Lines: WMA-based signal lines for each EMA, optionally visible or hidden.
Offset Function:
Displays indicator lines slightly shifted for clearer visualization of market movements.
Elliott Wave Cycle Orientation:
Assists in identifying impulsive and corrective market phases.
When combined, absolutely lethal ;-)
Benefits:
Provides a clear visual overview of short- and long-term trends.
Supports the analysis of Elliott Wave patterns for strategic entries and exits.
Ideal for swing traders, day traders, and technical analysts.
Conclusion:
Multiple EMAs for various time horizons
Dynamic trend colors for quick orientation
Signal lines for trend confirmation
Offset function for improved visualization
Supports Elliott Wave cycle analysis
Note:
EWTrend+ is a tool for analysis and does not replace independent trading decisions. Please test the indicator on a demo account before live use.

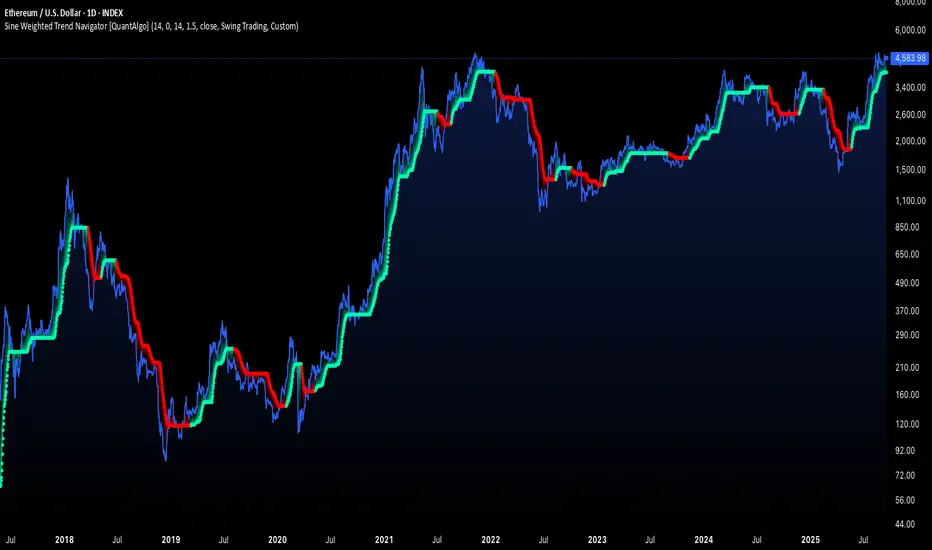
Sine Weighted Trend Navigator [QuantAlgo]🟢 Overview
The Sine Weighted Trend Navigator utilizes trigonometric mathematics to create a trend-following system that adapts to various market volatility. Unlike traditional moving averages that apply uniform weights, this indicator employs sine wave calculations to distribute weights across historical price data, creating a more responsive yet smooth trend measurement. Combined with volatility-adjusted boundaries, it produces actionable directional signals for traders and investors across various market conditions and asset classes.
🟢 How It Works
At its core, the indicator applies sine wave mathematics to weight historical prices. The system generates angular values across the lookback period and transforms them through sine calculations, creating a weight distribution pattern that naturally emphasizes recent price action while preserving smoothness. The phase shift feature allows rotation of this weighting pattern, enabling adjustment of the indicator's responsiveness to different market conditions.
Surrounding this sine-weighted calculation, the system establishes volatility-responsive boundaries through market volatility analysis. These boundaries expand and contract based on current market conditions, creating a dynamic framework that helps distinguish meaningful trend movements from random price fluctuations.
The trend determination logic compares the sine-weighted value against these adaptive boundaries. When the weighted value exceeds the upper boundary, it signals upward momentum. When it drops below the lower boundary, it indicates downward pressure. This comparison drives the color transitions of the main trend line, shifting between bullish (green) and bearish (red) states to provide clear directional guidance on price charts.
🟢 How to Use
Green/Bullish Trend Line: Rising momentum indicating optimal conditions for long positions (buy)
Red/Bearish Trend Line: Declining momentum signaling favorable timing for short positions (sell)
Steepening Green Line: Accelerating bullish momentum with increasing sine-weighted values indicating strengthening upward pressure and high-probability trend continuation
Steepening Red Line: Intensifying bearish momentum with declining sine-weighted calculations suggesting persistent downward pressure and optimal shorting opportunities
Flattening Trend Lines: Gradual reduction in directional momentum regardless of color may indicate approaching consolidation or trend exhaustion requiring position management review
🟢 Pro Tips for Trading and Investing
→ Preset Strategy Selection: Utilize the built-in presets strategically - Scalping preset for ultra-responsive 1-15 minute charts, Default preset for balanced general trading, and Swing Trading preset for 1-4 hour charts and multi-day positions.
→ Phase Shift Optimization: Fine-tune the phase shift parameter based on market bias - use positive values (0.1-0.5) in trending bull markets to enhance uptrend sensitivity, negative values (-0.1 to -0.5) in bear markets for improved downtrend detection, and zero for balanced neutral market conditions.
→ Multiplier Calibration: Adjust the multiplier according to market volatility and trading style. Use lower values (0.5-1.0) for tight, responsive signals in stable markets, higher values (2.0-3.0) during earnings seasons or high-volatility periods to filter noise and reduce whipsaws.
→ Sine Period Adaptation: Customize the sine weighted period based on your trading timeframe and market conditions. Use 5-14 for day trading to capture short-term momentum shifts, 14-25 for swing trading to balance responsiveness with reliability, and 25-50 for position trading to maintain long-term trend clarity.
→ Multi-Timeframe Sine Validation: Apply the indicator across multiple timeframes simultaneously, using higher timeframes (4H/Daily) for overall trend bias and lower timeframes (15m/1H) for entry timing, ensuring sine-weighted calculations align across different time horizons.
→ Alert-Driven Systematic Execution: Leverage the built-in trend change alerts to eliminate emotional decision-making and capture every mathematically-confirmed trend transition, particularly valuable for traders managing multiple instruments or those unable to monitor charts continuously.
→ Risk Management: Increase position sizes during strong directional sine-weighted momentum while reducing exposure during frequent color changes that indicate mathematical uncertainty or ranging market conditions lacking clear directional bias.
Trade Stock One v3Professional Trading Strategy
Specializes in trading uptrends, riding long-term waves
Limits frequent entries
Suitable for medium- to long-term stock trading

FlowThe indicator attempts to capture the volatility within a range and apply a set of Fibonacci calculations to display a range of bands of varying degrees which represents zones where exhaustion may occur on both sides.
So if price gets in to the yellow or pink zones then the script author is on high alert for a reversal. It must be noted that the user of the script should be fluent in Elliott Wave Analysis as the script was developed to help the author determine if a wave sequence may have ended.
When the indicator glides along one of the green, yellow or pink bands, then the instrument is likely in a 3rd wave, in Elliott wave speak, as such the user of the script would wait and not try to fade the move up or down as continuation is likely. Instead a move away from one of the bands should indicate another attempt at reaching the band after moving away. Thus, this move back in should be a 5th wave of some degree within the timeframe.
The indicator is not bound to any timeframe, as such it works on a 1 minute chart as it does on a weekly timeframe.
One of the observations the author makes is the use of the indicator within a sideways market. The indicator performs very well within these lower volatility environments by indicating exhaustion within these range bound markets.
So in essence, within the framework of Elliott wave analysis and respective time frames. Watch several higher and lower time frames.
1) Once wave 1 has completed
2) Look for a move down to the lower green / yellow zone to identify a wave 2 zone.
3) Once wave 3 starts, do not attempt to fade or short the first touch on the pink zone. Wait for price to move away and then come back in to the pink zone before considering a top and any attempts to fade.
4) Wave 4 should find support on the lower yellow or green band. Where it may be considered that price may change direction.
5) Depending on the time frame and any expected/unexpected extensions, Wave 5 may find resistance in to the pink zone.
A question that the author often asks is "where will wave 3 end?" - Will it end at the 1.618% extension of wave 1 & 2, the 176.4 or higher and perhaps lower. Using the pink zones the author has found it useful and quite accurate to make such a judgement based on the current position of the bands - Pink for exhaustion in an uptrend and green for exhaustion in a down trending market.
Elliott Wave Rule EngineWhat this tool does
The indicator scans price for two concurrent swing structures—a Small (shorter-degree) and a Large (higher-degree) set—then applies an Elliott/NeoWave rule engine to the most recent 5-swing motive (1-2-3-4-5) or 3-swing corrective (A-B-C). It produces:
Blue lines for Small swings and Orange lines for Large swings.
A rule dashboard (optional) showing PASS/FAIL/WARN for core rules & guidelines.
Buy/Sell labels when (a) a valid motive completes and (b) loop “consensus,” alignment, and scoring gates are satisfied.
Reading the chart
Small swings: thin blue segments, built from your Small settings.
Large swings: thicker orange segments, from your Large settings.
Background tint: faint green when a motive (impulse/diagonal) is valid right now on Small.
Labels (if enabled):
“1…5” or “A-B-C” markers on the latest detected structure.
Buy/Sell label at the last pivot when all gates pass; text may include a score %.
How it works
For both Small and Large degrees the script:
- Loops over all (left, right) combinations you specify (e.g., Small Left = 3..6, Right = 0..0) and calls ta.pivothigh/low.
- Aggregates the results:
- Keeps the most extreme pivot found in the loop (highest high or lowest low) that’s newer than the last accepted swing.
- Gates acceptance by minimum % change versus the last opposite swing (inside the loop) and a post-aggregation filter (Small Minimum swing %, Large Minimum swing %).
- Merges back-to-back same-type swings (HH or LL) by keeping only the more extreme one.
- Keeps only the last N=lookbackWaves swings (default 100).
- Consensus (used for signals) comes from the loop counts:
- sBuyConsensus = small L-count / total-combos (bullish bias)
- sSellConsensus = small H-count / total-combos (bearish bias)
(and the same for Large). This is a data-driven “how many combos agreed” measure.
2) Rule engine (Impulse/Diagonal vs. Corrective)
When there are at least 6 Small swings, the engine tests 1-2-3-4-5:
Hard rules (must pass for an Impulse):
- Wave-2 not > 100% of Wave-1 (no retrace beyond start of W1).
- Wave-3 not the shortest among 1,3,5.
- Wave-4 doesn’t overlap Wave-1 (if it does, structure may be a Diagonal).
- Diagonal eligibility: Rules 1 & 2 pass but Rule 3 fails ⇒ eligible as a Diagonal (
Guidelines (7 checks, count toward a threshold you set):
- W2 retraces a Fib level (within ±fibTol).
- W4 retraces a Fib level (within ±fibTol).
- W3 strongest momentum (speed = |Δprice| / bars).
- Alternation: W2 vs W4 have meaningfully different “sharpness” (price per bar), threshold altSlopeThr.
- Proportion (Price): |W1| and |W3| within propTolP× each other.
- Proportion (Time): W1W3 and W2W4 durations within propTolT×.
- W5 weaker than W3 (momentum divergence proxy).
A Motive is valid if:
- Impulse: all 3 hard rules pass and guideline passes ≥ Min guideline passes.
- Diagonal: diagonal-eligible and guideline passes ≥ Min guideline passes.
- if motive fails, the engine still evaluates ABC as Zigzag and Flat to populate the table:
- Zigzag: B shallower than ~0.618A; C ≈ A or 1.618A (±fibTol).
- Flat: B ≥ ~0.9A; expanded flat if B > 1.0A and C in *A; “running” note if C < A.
3) Signal logic (consensus-gated & scored)
Signals fire only on new Small pivots and only if a Small motive just validated:Direction comes from the motive’s W1 (up = bull, down = bear).
Consensus checks (from the loop):
Use Sell consensus if the last pivot is a High, or Buy consensus if it’s a Low.Require it ≥ Min SMALL loop consensus and ahead of the opposite side by at least Min consensus margin.If you also require Large quality: check the corresponding Large consensus ≥ Min LARGE loop consensus.
Alignment: If Require small/large directional alignment is ON, Small and Large directions must match (or the Large motive must be complete).
Score:
- If Large not required: finalScore = smallConsensus × smallQuality.
- If Large required: finalScore = smallConsensus × smallQuality × largeQuality.
- Need finalScore ≥ Min final score.
When all gates pass, you’ll see “Buy xx%” or “Sell xx%” at the pivot.
Inputs (explained):
- Smaller Wave Swing Detection (Looped)
- Small Left Min / Max (default 3..6): ta.pivot* left widths to scan.
- Small Right Min / Max (default 0..0): right widths to scan (0 = earliest confirmation).
- Small Minimum swing % (post-aggregation) (0.3%): filters out tiny swings after the loop.
- Larger Wave Swing Detection (Looped)
- Large Left Min / Max (100..200) and Right Min/Max (0..0): higher-degree scan (defaults are big; adjust for intraday).
- Large Minimum swing % (post-aggregation) (1.5%).
- Loop Filters (inside the loop)
- Small loop min % change (0.20%): a candidate pivot counts only if move vs. last opposite Small swing ≥ this.
- Large loop min % change (1.50%): same idea for Large.
Rule Engine Tolerances
- Fibonacci tolerance (±%) (0.05 = 5%): closeness to Fib levels.
-Same-degree TIME proportion max (x) (2.00×) and PRICE proportion max (x) (3.00×).
- Alternation slope ratio threshold (0.10): higher = stricter alternation.
- Min guideline passes (0–7) (5): threshold for motive validity.
- Signal Probability (Loop Consensus)
- Min SMALL loop consensus (0.60).
- Min LARGE loop consensus (0.50) (used only if Large validation matters).
- Min consensus margin vs opposite (0.10): e.g., 0.60 vs 0.45 fails (margin 0.15 passes).
Require LARGE 1–5 valid (or diagonal) for signal (off by default).
Min final score (0.20): gate on the composite score.
Annotate label with score % (on).
WARN (orange): guideline not met—pattern can still be valid if total passes ≥ Min guideline passes.
FAQ
Q: Why did I get a diagonal instead of an impulse?
A: Wave-4 overlapped Wave-1 (Rule 3). If Rules 1 & 2 pass and guidelines meet your minimum, it’s eligible as a Diagonal.
Q: Where do Buy/Sell labels come from?
A: Only after a valid Small motive at a new pivot, and only if consensus, alignment, and final score gates pass (per your settings).
Q: It “missed” a wave in hindsight.
A: Pivots require right bars to confirm; extremely tight settings can filter that swing; adjust Small min % or ranges.
Q: Are there repaints?
A: No, It uses standard pivot confirmation; until a pivot is confirmed, recent swings can evolve. After confirmation, lines/labels are stable.
Limitations & disclaimers
Elliott/NeoWave rules are heuristics; markets are messy. Treat outputs as structured context, not certainty.
Consensus is pattern-scan agreement, not probability of profit Not investment advice; always couple with risk management.

Malama's Quantum Swing Modulator# Multi-Indicator Swing Analysis with Probability Scoring
## What Makes This Script Original
This script combines pivot point detection with a **weighted scoring system** that dynamically adjusts indicator weights based on market regime (trending vs. ranging). Unlike standard multi-indicator approaches that use fixed weightings, this implementation uses ADX to detect market conditions and automatically rebalances the influence of RSI, MFI, and price deviation components accordingly.
## Core Methodology
**Dynamic Weight Allocation System:**
- **Trending Markets (ADX > 25):** Prioritizes momentum (50% weight) with reduced oscillator influence (20% each for RSI/MFI)
- **Ranging Markets (ADX < 25):** Emphasizes mean reversion signals (40% each for RSI/MFI) with no momentum bias
- **Price Wave Component:** Uses EMA deviation normalized by ATR to measure distance from central tendency
**Pivot-Based Level Analysis:**
- Detects swing highs/lows using configurable left/right lookback periods
- Maintains the most recent pivot levels as key reference points
- Calculates proximity scores based on current price distance from these levels
**Volume Confirmation Logic:**
- Defines "volume entanglement" when current volume exceeds SMA by user-defined factor
- Integrates volume confirmation into confidence scoring rather than signal generation
## Technical Implementation Details
**Scoring Algorithm:**
The script calculates separate bullish and bearish "superposition" scores using:
```
Bullish Score = (RSI_bull × weight) + (MFI_bull × weight) + (price_wave × weight × position_filter) + (momentum × weight)
```
Where:
- RSI_bull = 100 - RSI (inverted for oversold bias)
- MFI_bull = 100 - MFI (inverted for oversold bias)
- Position_filter = Only applies when price is below EMA for bullish signals
- Momentum component = Only active in trending markets
**Confidence Calculation:**
Base confidence starts at 25% and increases based on:
- Market regime alignment (trending/ranging appropriate conditions)
- Volume confirmation presence
- Oscillator extreme readings (RSI < 30 or > 70 in ranging markets)
- Price position relative to wave function (EMA)
**Probability Output:**
Final probability = (Base Score × 0.6) + (Proximity Score × 0.4)
This balances indicator confluence with proximity to identified levels.
## Key Differentiators
**vs. Standard Multi-Indicator Scripts:** Uses regime-based dynamic weighting instead of fixed combinations
**vs. Simple Pivot Indicators:** Adds quantified probability and confidence scoring to pivot levels
**vs. Basic Oscillator Combinations:** Incorporates market structure analysis through ADX regime detection
## Visual Components
**Wave Function Display:** EMA with ATR-based uncertainty bands for trend context
**Pivot Markers:** Clear visualization of detected swing highs and lows
**Analysis Table:** Real-time probability, confidence, and action recommendations for current pivot levels
## Practical Application
The dynamic weighting system helps avoid common pitfalls of multi-indicator analysis:
- Reduces oscillator noise during strong trends by emphasizing momentum
- Increases mean reversion sensitivity during sideways markets
- Provides quantified probability rather than subjective signal interpretation
## Important Limitations
- Requires sufficient historical data for pivot detection and volume calculations
- Probability scores are based on current market regime and may change as conditions evolve
- The scoring system is designed for confluence analysis, not standalone trading decisions
- Past probability accuracy does not guarantee future performance
## Technical Requirements
- Works on all timeframes but requires adequate lookback history
- Volume data required for entanglement calculations
- Best suited for liquid instruments where volume patterns are meaningful
This approach provides a systematic framework for evaluating swing trading opportunities while acknowledging the probabilistic nature of technical analysis.

EMA Sunset WavesThis script displays a set of Exponential Moving Averages (EMAs) (20, 50, 100, and 200) with a clean and immersive design:
Lines automatically change color based on trend direction (uptrend or downtrend).
Dynamic fill zones highlight whether the price is trading above or below each EMA.
Full color customization (bullish/bearish lines, fill zones, transparency).
Adjustable line thickness for better chart readability.
🎨 The idea is to make trend reading visual, intuitive, and aesthetic at first glance.
⚙️ Configurable settings:
EMA lengths (default 20/50/100/200).
Colors for bullish and bearish EMAs.
Fill colors (above/below price).
Transparency and line thickness.

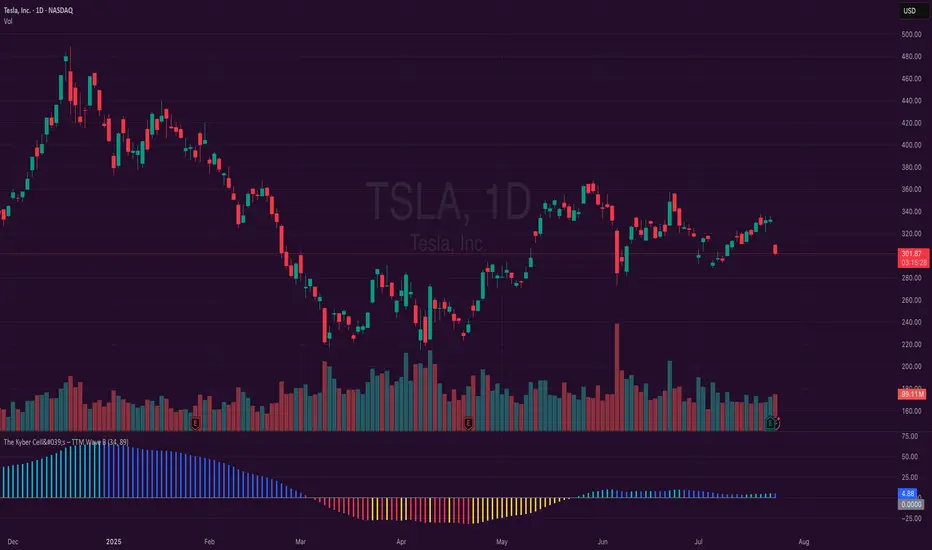
The Kyber Cell's – TTM Wave BKyber Cell’s Wave B – TTM Squeeze Trend Confirmation Histogram
⸻
1. Introduction
Wave B acts as the trend validator in the TTM Squeeze suite. While Wave A reveals the heartbeat of momentum, Wave B focuses on the directional stability of price. It answers a critical question for traders: Is the trend in my favor, or am I trading against the dominant force?
Built for confirming entries and filtering out low-probability setups, Kyber Cell’s Wave B applies a smoother, more deliberate view of trend structure using configurable moving average logic. This makes it ideal for preventing false starts and improving trade alignment — particularly in combination with Wave A and squeeze-fire signals.
⸻
2. Core Concept and Calculation
Unlike Wave A, which tracks short-term price bursts, Wave B focuses on trend direction and consistency. It typically derives its signal from one of two engines:
• EMA-Based Method: Compares short-term EMA (e.g., 8) to a longer EMA (e.g., 21) to determine directional bias.
• HMA-Based Method: Measures slope and crossover behavior between fast and slow Hull Moving Averages (e.g., HMA 34 and HMA 144) for a smoother trend read.
These calculations produce a histogram that doesn’t fluctuate rapidly like Wave A, but instead stabilizes around sustained trend strength. As such, Wave B excels at confirming whether a move has backing from the broader market structure.
⸻
3. Visual Output and Color Logic
Wave B uses a 3-color histogram to clearly define trend state:
• Bright Blue: Bullish trend
• Bright Red: Bearish trend
• Gray: Neutral or transitioning state (indecision)
This simplified color scheme helps traders avoid information overload and focus on whether the market is structurally aligned for long or short entries.
• When paired with a squeeze-fire and rising Wave A, a blue Wave B bar signals strong confirmation to go long.
• Conversely, a red Wave B bar during a squeeze-fire and falling Wave A confirms bearish setups.
• A gray bar typically signals trend conflict, indecision, or transitional environments — and should be treated as a caution flag.
⸻
4. Ideal Use Case
Wave B is best used as a filter and confirmation layer in your trading workflow:
1. Identify a squeeze setup (using Squeeze Pro or dots indicator).
2. Confirm with Wave A: Look for a fresh momentum push (cyan or red bars).
3. Validate with Wave B:
• Only take long trades when Wave B is blue.
• Only take short trades when Wave B is red.
• Avoid or delay trades when Wave B is gray.
4. Ride the trend until Wave B flips or Wave A fades.
This reduces emotional decision-making and keeps your trades aligned with the prevailing bias, especially on higher timeframes or in choppy conditions.
⸻
5. Configuration and Customization
Wave B is designed with enough flexibility to adapt to different trading styles while remaining streamlined:
• Trend Engine Selection: Choose between EMA-based or HMA-based logic.
• Moving Average Lengths: Customize the short- and long-term periods.
• Color Customization: Adjust bar colors to match your chart theme or visibility needs.
• Bar Thickness and Positioning: Optional visual tweaks depending on your chart layout.
The goal is to provide just enough configurability to integrate seamlessly with Wave A and Squeeze Pro, without diluting the core purpose: trend clarity.
⸻
6. Alerts and Add-ons
Wave B can be extended with basic or advanced alerts, depending on your needs:
• Alert on trend flips (blue → red or red → blue)
• Alert on return to neutral (gray bars)
• Combined alerts with squeeze and momentum signals for high-confluence trades
When integrated with other components, Wave B becomes an essential part of a multi-layered confirmation system.
⸻
7. Disclaimer
This indicator is provided for educational purposes only and is not financial advice. No trading decision should be made solely on the basis of this tool. All users should test their strategies, assess their own risk tolerance, and consider using Wave B as part of a broader technical framework.
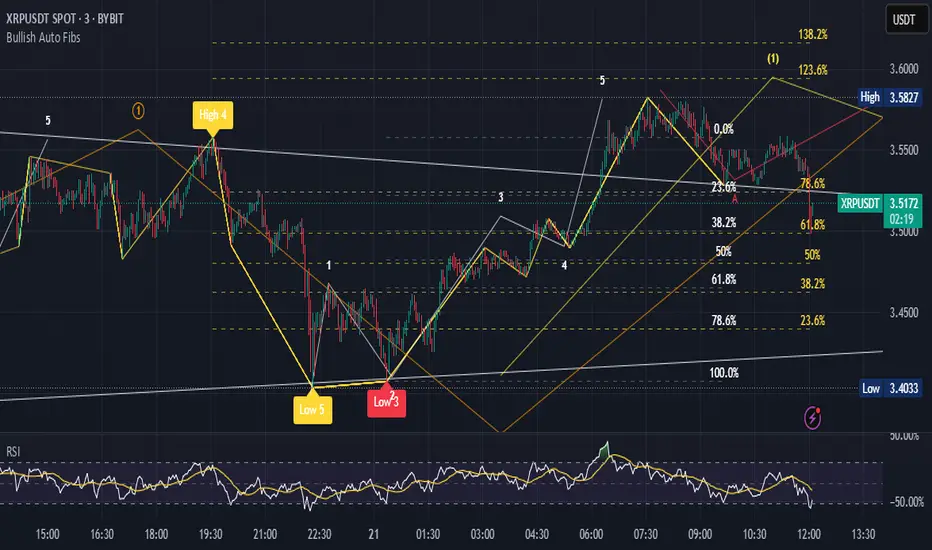
Bullish Auto FibsBullish Auto Fibs Indicator
Description
The Bullish Auto Fibs indicator is a sophisticated tool designed for traders on the TradingView platform, specifically tailored for analyzing bullish price movements on XRP and other assets. It automatically plots Fibonacci retracement, B Wave, and extension levels based on a customizable ZigZag pattern, providing clear visual cues for potential support, resistance, and price targets. With a focus on the 15-minute timeframe, this indicator enhances technical analysis by dynamically updating Fibonacci levels as new pivot highs and lows are detected, ensuring traders stay aligned with evolving market trends.
Key Features:
Automatic Fibonacci Levels: Plots retracement (23.6%, 38.2%, 50%, 61.8%, 78.6%), B Wave (23.6% to 161.8%), and extension (100%, 161.8%, 261.8%) levels.
Dynamic ZigZag Detection: Identifies pivot highs and lows with an adjustable length (1–100 bars, default 20).
Real-Time Updates: Adjusts Fibonacci levels when new highs (for retracements) or lows (for B Wave and extensions) are detected, preserving key reference points like the B Wave pivot high.
Customizable Display: Toggle visibility for retracement, B Wave, and extension levels to suit your analysis needs.
Visual Clarity: Uses distinct colors (gray for retracements, yellow for B Wave, green for extensions) and labels for easy interpretation.
This indicator is ideal for traders employing Elliott Wave theory, Fibonacci-based strategies, or trend-following approaches, offering a robust framework for identifying key price levels in bullish markets.
User Manual
Configuration
The indicator’s settings can be adjusted via the “Settings” panel in TradingView:
Yellow ZigZag Length (default: 20, range: 1–100): Controls the sensitivity of pivot detection. Higher values detect more significant pivots; lower values increase sensitivity for shorter-term swings.
Show Retracement Fibs (default: true): Enable/disable retracement levels (low to high, 0% at high, 100% at low).
Show B Wave Fibs (default: true): Enable/disable B Wave levels (high to low, 100% at high, 0% at low, with extensions up to 161.8%).
Show Extension Fibs (default: true): Enable/disable extension levels (pivot low as 0%, projecting upward).
How It Works
ZigZag Pattern:
The indicator identifies pivot highs and lows using the ta.pivothigh and ta.pivotlow functions, with the specified yellowLength.
Pivots are marked with “H” (high) or “L” (low) labels in yellow.
Fibonacci Levels:
Retracement Fibs: Drawn from a pivot low (100%) to a pivot high (0%). Updates to a new high if detected, maintaining the original low.
B Wave Fibs: Drawn from a pivot high (100%) to a pivot low (0%), with extensions above 100%. Updates to a new low if detected, preserving the original high.
Extension Fibs: Drawn from a pivot low (0%) upward, based on the prior low-to-high wave length. Updates to a new low if detected.
Dynamic Updates:
Lines and labels extend to the current bar for active Fibonacci levels, ensuring real-time relevance.
When a new pivot is detected, previous levels are cleared, and new levels are drawn to reflect the latest price structure.
Usage Tips
Trend Confirmation: Use retracement levels to identify potential support zones during pullbacks in a bullish trend.
B Wave Analysis: Leverage B Wave levels for corrective wave targets, especially in Elliott Wave strategies.
Price Targets: Extension levels highlight potential bullish continuation zones.
Timeframe Flexibility: While optimized for 15-minute charts, adjust yellowLength for higher (e.g., 50–100) or lower (e.g., 5–10) timeframes.
Combine with Other Tools: Pair with trend indicators (e.g., moving averages) or oscillators (e.g., RSI) for enhanced decision-making.
Troubleshooting
No Levels Displayed: Ensure at least two pivots (high and low) are detected. Increase yellowLength if pivots are sparse.
Overlapping Labels: Reduce chart zoom or toggle off unnecessary Fibonacci types to declutter.
Performance Issues: The indicator limits arrays to 500 entries to prevent slowdowns. Older pivots are automatically removed.
Notes
The indicator is optimized for bullish markets but can be adapted for other assets by adjusting the ZigZag length.
For best results, test settings on historical data to align with your trading style.
GCM Bull Bear RiderGCM Bull Bear Rider (GCM BBR)
Your Ultimate Trend-Riding Companion
GCM Bull Bear Rider is a comprehensive, all-in-one trend analysis tool designed to eliminate guesswork and provide a crystal-clear view of market direction. By leveraging a highly responsive Jurik Moving Average (JMA), this indicator not only identifies bullish and bearish trends with precision but also tracks their performance in real-time, helping you ride the waves of momentum from start to finish.
Whether you are a scalper, day trader, or swing trader, the GCM BBR adapts to your style, offering a clean, intuitive, and powerful visual guide to the market's pulse.
Key Features
JMA-Powered Trend Lines (UTPL & DTPL): The core of the indicator. A green "Up Trend Period Line" (UTPL) appears when the JMA's slope turns positive (buyers are in control), and a red "Down Trend Period Line" (DTPL) appears when the slope turns negative (sellers are in control). The JMA is used for its low lag and superior smoothing, giving you timely and reliable trend signals.
Live Profit Tracking Labels: This is the standout feature. As soon as a trend period begins, a label appears showing the real-time profit (P:) from the trend's starting price. This label moves with the trend, giving you instant feedback on its performance and helping you make informed trade management decisions.
Historical Performance Analysis: The profit labels remain on the chart for completed trends, allowing you to instantly review past performance. See at a glance which trends were profitable and which were not, aiding in strategy refinement and backtesting.
Automatic Chart Decluttering: To keep your chart clean and focused on significant moves, the indicator automatically removes the historical profit label for any trend that fails to achieve a minimum profit threshold (default is 0.5 points).
Dual-Ribbon Momentum System:
JMA / Short EMA Ribbon: Visualizes short-term momentum. A green fill indicates immediate bullish strength, while a red fill shows bearish pressure.
Short EMA / Long EMA Ribbon: Acts as a long-term trend filter, providing broader market context for your decisions.
"GCM Hunt" Entry Signals: The indicator includes optional pullback entry signals (green and red triangles). These appear when the price pulls back to a key moving average and then recovers in the direction of the primary trend, offering high-probability entry opportunities.
How to Use
Identify the Trend: Look for the appearance of a solid green line (UTPL) for a bullish bias or a solid red line (DTPL) for a bearish bias. Use the wider EMA ribbon for macro trend confirmation.
Time Your Entry: For aggressive entries, you can enter as soon as a new trend line appears. For more conservative entries, wait for a "GCM Hunt" triangle signal, which confirms a successful pullback.
Ride the Trend & Manage Your Trade: The moving profit label (P:) is your guide. As long as the trend line continues and the profit is increasing, you can confidently stay in the trade. A flattening JMA or a decreasing profit value can signal that the trend is losing steam.
Focus Your Strategy: Use the Display Mode setting to switch between "Buyers Only," "Sellers Only," or both. This allows you to completely hide opposing signals and focus solely on long or short opportunities.
Core Settings
Display Mode: The master switch. Choose to see visuals for "Buyers & Sellers," "Buyers Only," or "Sellers Only."
JMA Settings (Length, Phase): Fine-tune the responsiveness of the core JMA engine.
EMA Settings (Long, Short): Adjust the lengths of the moving averages that define the ribbons and "Hunt" signals.
Label Offset (ATR Multiplier): Customize the gap between the trend lines and the profit labels to avoid overlap with candles.
Filters (EMA, RSI, ATR, Strong Candle): Enable or disable various confirmation filters to strengthen the "Hunt" entry signals according to your risk tolerance.
Add the GCM Bull Bear Rider to your chart today and transform the way you see and trade the trend!
ENJOY

Fibonacci Optimal Entry Zone [OTE] (Zeiierman)█ Overview
Fibonacci Optimal Entry Zone (Zeiierman) is a high-precision market structure tool designed to help traders identify ideal entry zones during trending markets. Built on the principles of Smart Money Concepts (SMC) and Fibonacci retracements, this indicator highlights key areas where price is most likely to react — specifically within the "Golden Zone" (between the 50% and 61.8% retracement).
It tracks structural pivot shifts (CHoCH) and dynamically adjusts Fibonacci levels based on real-time swing tracking. Whether you're trading breakouts, pullbacks, or optimal entries, this tool brings unparalleled clarity to structure-based strategies.
Ideal for traders who rely on confluence, this indicator visually synchronizes swing highs/lows, market structure shifts, Fibonacci retracement levels, and trend alignment — all without clutter or lag.
⚪ The Structural Assumption
Price moves in waves, but key retracements often lead to continuation or reversal — especially when aligned with structure breaks and trend shifts.
The Optimal Entry Zone captures this behavior by anchoring Fibonacci levels between recent swing extremes. The most powerful area — the Golden Zone — marks where institutional re-entry is likely, providing traders with a sniper-like roadmap to structure-based entries.
█ How It Works
⚪ Structure Tracking Engine
At its core, the indicator detects pivots and classifies trend direction:
Structure Period – Determines the depth of pivots used to detect swing highs/lows.
CHoCH – Break of structure logic identifies where the trend shifts or continues, marked visually on the chart.
Bullish & Bearish Modes – Independently toggle uptrend and downtrend detection and styling.
⚪ Fibonacci Engine
Upon each confirmed structural shift, Fibonacci retracement levels are projected between swing extremes:
Custom Levels – Choose which retracements (0.50, 0.618, etc.) are shown.
Real-Time Adjustments – When "Swing Tracker" is enabled, levels and labels update dynamically as price forms new swings.
Example:
If you disable the Swing Tracker, the Golden Level is calculated using the most recent confirmed swing high and low.
If you enable the Swing Tracker, the Golden Level is calculated from the latest swing high or low, making it more adaptive as the trend evolves in real time.
█ How to Use
⚪ Structure-Based Entry
Wait for CHoCH events and use the resulting Fibonacci projection to identify entry points. Enter trades as price taps into the Golden Zone, especially when confluence forms with swing structure or order blocks.
⚪ Real-Time Reaction Tracking
Enable Swing Tracker to keep the tool live — constantly updating zones as price shifts. This is especially useful for scalpers or intraday traders who rely on fresh swing zones.
█ Settings
Structure Period – Number of bars used to define swing pivots. Larger values = stronger structure.
Swing Tracker – Auto-updates fib levels as new highs/lows form.
Show Previous Levels – Keep older fib zones on chart or reset with each structure shift.
-----------------
Disclaimer
The content provided in my scripts, indicators, ideas, algorithms, and systems is for educational and informational purposes only. It does not constitute financial advice, investment recommendations, or a solicitation to buy or sell any financial instruments. I will not accept liability for any loss or damage, including without limitation any loss of profit, which may arise directly or indirectly from the use of or reliance on such information.
All investments involve risk, and the past performance of a security, industry, sector, market, financial product, trading strategy, backtest, or individual's trading does not guarantee future results or returns. Investors are fully responsible for any investment decisions they make. Such decisions should be based solely on an evaluation of their financial circumstances, investment objectives, risk tolerance, and liquidity needs.

Machine Learning Adaptive Trend Toolkit [Velowave]The Machine Learning Adaptive Trend Toolkit is a technical analysis tool that combines adaptive algorithms with comprehensive market feature extraction to provide insights into changing market conditions. Unlike static indicators with fixed parameters, this system continuously analyzes and adapts to the evolving market environment.
Core Technology
At the heart of this system is a dynamic approach to market analysis:
• Feature Engineering Pipeline: Extracts and normalizes volatility, momentum, volume, and trend strength metrics
• Market Regime Classification: Identifies 10 distinct market environments including trending, ranging, breakout, and reversal conditions
• Parameter Optimization: Automatically adjusts sensitivity based on detected market conditions
• Dynamic Wave Technology: Creates adaptive support/resistance levels that respond to changing volatility
⚠️ Signal Interpretation
Important: The indicator's wave crosses should be interpreted as trend change signals rather than direct buy/sell recommendations. These signals represent potential trend changes based on adaptive parameters, but require confirmation from other analysis before making trading decisions.
(Image showing example color customizability)
Custom Candle Behavior
The custom candlesticks in this indicator are designed to enhance trend visualization but will behave differently than default candlesticks:
• They use linear regression smoothing to reduce noise
• Their coloring is based on position relative to the adaptive wave, not merely open/close relationships
• They may show different patterns than traditional candlesticks on the same chart
• Trading strategies developed using traditional candlestick patterns may not apply directly to these custom candles
This modified representation helps visualize trend conditions more clearly but should be understood as an analytical tool rather than a direct replacement for traditional price action analysis.
Practical Applications
• Trend Identification
The adaptive wave system provides clear visualization of trend direction and strength, with dynamic support and resistance levels that adjust to current volatility conditions.
• Volatility-Adjusted Analysis
Parameters automatically optimize during high and low volatility periods, preventing false signals during consolidation while remaining responsive during breakouts.
• Regime-Based Strategy Selection
Knowing the current market regime allows you to apply appropriate trading techniques for specific conditions rather than using a one-size-fits-all approach.
• Visual Price Action Analysis
Enhanced candlestick coloring instantly communicates price position relative to the adaptive trend, helping you process market information more efficiently.
(Image showing only the supertrend wave and dynamic moving average)
Technical Components
• Adaptive Wave Algorithm: Creates dynamic support/resistance bands based on volatility, volume, and detected regime
• Dynamic Moving Average: Period automatically adjusts based on market conditions - shorter in trending markets, longer in ranging conditions
• Market Regime Engine: Continuously analyzes feature patterns to classify current conditions
• Custom Candlestick Visualization: Provides instant visual feedback on trend position and momentum
Implementation Details
For full transparency, the core calculations include:
• Volatility normalization through comparative ATR analysis
• Momentum feature extraction using multi-timeframe momentum indicators
• Trend strength quantification through price structure analysis
• Regime detection through feature pattern recognition
• Adaptive parameter adjustment based on detected market conditions
The system uses only historical and current price data for its calculations and analyses. It does not use predictive methodologies that could lead to misleading results. The indicator will show different values on an open bar than it will after the bar closes, which is standard behavior for indicators that use closing prices in their calculations.
Risk Disclaimer:
Trading involves significant risk. This indicator is designed as an analytical tool to enhance decision-making, not as a standalone trading system. Past performance is not indicative of future results.

[iQ]PRO Ultimate Financial Analysis Tool And System SynergyUltimate Financial Analysis Tool And System Synergy (UFATASS)
Advanced Market Insights with Cycle Analysis, Trend Forecasting, and Risk Monitoring
The Ultimate Financial Analysis Tool And System Synergy (UFATASS) is a powerful indicator designed to give traders a deeper understanding of market dynamics. By blending cutting-edge techniques from signal processing, statistics, and dynamical systems theory, UFATASS provides a unique, all-in-one solution for technical analysis.
Key Features
Cycle Detection:
Pinpoints dominant market cycles using advanced spectral analysis, helping you identify potential turning points.
Trend Analysis:
Delivers multiple regression lines to capture short-term and long-term market trends, with a customizable complexity setting for precision.
Probability Forecasts:
Uses Monte Carlo simulations to estimate the likelihood of future price movements, offering a probabilistic edge for decision-making.
Risk Monitoring:
Tracks volatility and market stability, featuring an experimental chaos indicator based on Lyapunov exponents to assess price predictability.
Customization Options
Adjust the indicator to fit your trading style:
Cycle and regression lookback periods
Complexity factor for regression sensitivity
Volatility calculation window
Forecast horizon for price predictions
Visual Outputs
Price and regression lines plotted on the main chart
Cycle details and wave visuals in a separate pane
A summary label on the last bar with key metrics (e.g., cycle length, probabilities)
Background color alerts to signal risk levels
How to Use
Incorporate UFATASS into your strategy to:
Anticipate reversals with cycle analysis
Confirm trends using regression insights
Plan entries and exits with probability forecasts
Monitor market conditions and adjust risk exposure
