MACD-AO MACD-AO is programmed by Ruben Jaramillo
MACD-AO , short for moving average convergence/divergence, is a trading indicator used in technical analysis of stock prices, created by Gerald Appel in the late 1970s. It is supposed to reveal changes in the strength, direction, momentum, and duration of a trend in a stock's price.
The MACD-AO indicator (oscillator) is a collection of three time series calculated from historical price data, most often the closing price. These three series are: the MACD-AO series proper, the "signal" or "average" series, and the "divergence" series which is the difference between the two. The MACD-AO series is the difference between a "fast" (short period) exponential moving average (EMA), and a "slow" (longer period) EMA of the price series. The average series is an EMA of the MACD-AO series itself.
The MACD-AO indicator thus depends on three time parameters, namely the time constants of the three EMAs. The notation " MACD-AO (a,b,c)" usually denotes the indicator where the MACD-AO series is the difference of EMAs with characteristic times a and b, and the average series is an EMA of the MACD-AO series with characteristic time c. These parameters are usually measured in days. The most commonly used values are 12, 26, and 9 days, that is, MACD-AO (12,26,9). As true with most of the technical indicators, MACD-AO also finds its period settings from the old days when technical analysis used to be mainly based on the daily charts. The reason was the lack of the modern trading platforms which show the changing prices every moment. As the working week used to be 6-days, the period settings of (12, 26, 9) represent 2 weeks, 1 month and one and a half week. Now when the trading weeks have only 5 days, possibilities of changing the period settings cannot be overruled. However, it is always better to stick to the period settings which are used by the majority of traders as the buying and selling decisions based on the standard settings further push the prices in that direction.
The MACD-AO and average series are customarily displayed as continuous lines in a plot whose horizontal axis is time, whereas the divergence is shown as a bar graph (often called a histogram).
A fast EMA responds more quickly than a slow EMA to recent changes in a stock's price. By comparing EMAs of different periods, the MACD-AO series can indicate changes in the trend of a stock. It is claimed that the divergence series can reveal subtle shifts in the stock's trend.
Since the MACD-AO is based on moving averages, it is inherently a lagging indicator. As a metric of price trends, the MACD-AO is less useful for stocks that are not trending (trading in a range) or are trading with erratic price action.
ค้นหาในสคริปต์สำหรับ "macd"

Smart MACD Divergence ScannerOriginal Base Indicator: "CM_MacD_Ult_MTF" by ChrisMoody
This indicator builds upon ChrisMoody's excellent multi-timeframe MACD foundation and transforms it into a professional divergence scanner with advanced quality assessment and filtering capabilities. The original MACD visualization and MTF functionality have been preserved while adding completely new divergence detection, scoring, and filtering systems.
🎯 What Makes This Indicator Unique:
Smart MACD Divergence Scanner is a professional tool for detecting MACD-based divergences with an advanced filtering system and signal quality assessment. Unlike standard divergence indicators, this version includes innovative features:
Adaptive Quality Scoring System — each signal receives a score from 0 to 100 based on multiple factors
Volatility Filter — automatic signal suppression during low market volatility periods
Multi-Timeframe Confirmation — divergence verification on higher timeframe for increased reliability
Divergence Strength Analysis — calculation of percentage difference between price and indicator movement
Information Dashboard — detailed real-time signal statistics
Cooldown System — prevention of multiple consecutive signals
💡 How It Works:
The indicator uses the classic divergence concept — the divergence between price movement and the MACD oscillator. However, instead of simple pivot detection, the algorithm:
Scans the market for local extremes (pivots) on price and MACD histogram
Searches for divergences — when price updates low/high while MACD shows opposite movement
Assesses quality — analyzes divergence strength, volatility, higher timeframe confirmation
Filters noise — eliminates weak signals through threshold system and cooldown
Generates signal — only when all quality criteria are met
🔧 Key Parameters:
MACD Settings: Fast Length (12), Slow Length (26), Signal Length (9)
Divergence Detection: Pivot Lookback (5), Max Lookback Range (60), Min Divergence Strength (15%)
Quality Filters: Min Quality Score (60), Volatility Filter, MTF Confirmation, Signal Cooldown (5)
📊 How to Use:
Add indicator to chart — it will automatically start scanning
Configure filters — start with default settings, then adapt to your trading style
Watch for signals: 🟢 Green "BUY" label = bullish divergence, 🔴 Red "SELL" label = bearish divergence
Check quality score on labels (Q: XX)
Use information panel to monitor statistics and current market conditions
⚙️ Settings Guide:
For swing trading (4H-Daily): Increase Pivot Lookback to 7-10, set Min Quality Score to 70+
For day trading (15m-1H): Keep default settings, enable all filters
For scalping (1m-5m): Decrease Min Quality Score to 50, disable MTF Confirmation
For volatile markets (crypto): Increase Min Divergence Strength to 20-25%, enable Volatility Filter
⚠️ Important Notes:
Divergences are probabilistic signals, not guaranteed reversals
Use additional confirmation (support/resistance levels, volume, price action)
Adjust parameters for specific asset and timeframe
Signals appear with Pivot Lookback bars delay (retrospective confirmation)
On volatile markets, increase Min Quality Score to reduce false signals

MACD HTF Hardcoded (A/B Presets) + Regimes [CHE] MACD HTF Hardcoded (A/B Presets) + Regimes — Higher-timeframe MACD emulation with acceptance-based regime filter and on-chart diagnostics
Summary
This indicator emulates a higher-timeframe MACD directly on the current chart using two hardcoded preset families and a time-bucket mapping, avoiding cross-timeframe requests. It classifies four MACD regimes and applies an acceptance filter that requires several consecutive bars before a state is considered valid. A small dead-band around zero reduces noise near the axis. An on-chart table reports the active preset, the inferred time bucket, the resolved lengths, and the current regime.
Pine version: v6
Overlay: false
Primary outputs: MACD line, Signal line, Histogram columns, zero line, regime-change alert, info table
Motivation: Why this design?
Cross-timeframe indicators often rely on external timeframe requests, which can introduce repaint paths and added latency. This design provides a deterministic alternative: it maps the current chart’s timeframe to coarse higher-timeframe buckets and uses fixed EMA lengths that approximate those views. The dead-band suppresses flip-flops around zero, and the acceptance counter reduces whipsaw by requiring sustained agreement across bars before acknowledging a regime.
What’s different vs. standard approaches?
Baseline: Classical MACD with user-selected lengths on the same timeframe, or higher-timeframe MACD via cross-timeframe requests.
Architecture differences:
Hardcoded A and B length families with a bucket map derived from the chart timeframe.
No `request.security`; all calculations occur on the current series.
Regime classification from MACD and Histogram sign, gated by an acceptance count and a small zero dead-band.
Diagnostics table for transparency.
Practical effect: The MACD behaves like a slower, higher-timeframe variant without external requests. Regimes switch less often due to the dead-band and acceptance logic, which can improve stability in choppy sessions.
How it works (technical)
The script derives a coarse bucket from the chart timeframe using `timeframe.in_seconds` and maps it to preset-specific EMA lengths. EMAs of the source build MACD and Signal; their difference is the Histogram. Signs of MACD and Histogram define four regimes: strong bull, weak bull, strong bear, and weak bear. A small, user-defined band around zero treats values near the axis as neutral. An acceptance counter checks whether the same regime persisted for a given number of consecutive bars before it is emitted as the filtered regime. A single alert condition fires when the filtered regime changes. The histogram columns change shade based on position relative to zero and whether they are rising or falling. A persistent table object shows preset, bucket tag, resolved lengths, and the filtered regime. No cross-timeframe requests are used, so repaint risk is limited to normal live-bar movement; values stabilize on close.
Parameter Guide
Source — Input series for MACD — Default: Close — Using a smoother source increases stability but adds lag.
Preset — A or B length family — Default: “3,10,16” — Switch to “12,26,9” for the classic family mapped to buckets.
Table Position — Anchor for the info table — Default: Top right — Choose a corner that avoids covering price action.
Table Size — Table text size — Default: Normal — Use small on dense charts, large for presentations.
Dark Mode — Table theme — Default: Enabled — Match your chart background for readability.
Show Table — Toggle diagnostics table — Default: Enabled — Disable for a cleaner pane.
Zero dead-band (epsilon) — Noise gate around zero — Default: Zero — Increase slightly when you see frequent flips near zero.
Acceptance bars (n) — Bars required to confirm a regime — Default: Three — Raise to reduce whipsaw; lower to react faster.
Reading & Interpretation
Histogram columns: Above zero indicates bullish pressure; below zero indicates bearish pressure. Darker shade implies the histogram increased compared with the prior bar; lighter shade implies it decreased.
MACD vs. Signal lines: The spread corresponds to histogram height.
Regimes:
Strong bull: MACD above zero and Histogram above zero.
Weak bull: MACD above zero and Histogram below zero.
Strong bear: MACD below zero and Histogram below zero.
Weak bear: MACD below zero and Histogram above zero.
Table: Inspect active preset, bucket tag, resolved lengths, and the filtered regime number with its description.
Practical Workflows & Combinations
Trend following: Use strong bull to favor long exposure and strong bear to favor short exposure. Use weak states as pullback or transition context. Combine with structure tools such as swing highs and lows or a baseline moving average for confirmation.
Exits and risk: In strong trends, consider exiting partial size on a regime downgrade to a weak state. In choppy sessions, increase the acceptance bars to reduce churn.
Multi-asset / Multi-timeframe: Works on time-based charts across liquid futures, indices, currencies, and large-cap equities. Bucket mapping helps retain a consistent feel when moving from lower to higher timeframes.
Behavior, Constraints & Performance
Repaint/confirmation: No cross-timeframe requests; values can evolve intrabar and settle on close. Alerts follow your TradingView alert timing settings.
Resources: `max_bars_back` is set to five thousand. Very large resolved lengths require sufficient history to seed EMAs; expect a warm-up period on first load or after switching symbols.
Known limits: Dead-band and acceptance can delay recognition at sharp turns. Extremely thin markets or large gaps may still cause brief regime reversals.
Sensible Defaults & Quick Tuning
Start with preset “3,10,16”, dead-band near zero, and acceptance of three bars.
Too many flips near zero: increase the dead-band slightly or raise the acceptance bars.
Too sluggish in clean trends: reduce the acceptance bars by one.
Too sensitive on fast lower timeframes: switch to the “12,26,9” preset family or raise the acceptance bars.
Want less clutter: hide the table and keep the alert.
What this indicator is—and isn’t
This is a visualization and regime layer for MACD using higher-timeframe emulation and stability gates. It is not a complete trading system and does not generate position sizing or risk management. Use it with market structure, execution rules, and protective stops.
Disclaimer
The content provided, including all code and materials, is strictly for educational and informational purposes only. It is not intended as, and should not be interpreted as, financial advice, a recommendation to buy or sell any financial instrument, or an offer of any financial product or service. All strategies, tools, and examples discussed are provided for illustrative purposes to demonstrate coding techniques and the functionality of Pine Script within a trading context.
Any results from strategies or tools provided are hypothetical, and past performance is not indicative of future results. Trading and investing involve high risk, including the potential loss of principal, and may not be suitable for all individuals. Before making any trading decisions, please consult with a qualified financial professional to understand the risks involved.
By using this script, you acknowledge and agree that any trading decisions are made solely at your discretion and risk.
Do not use this indicator on Heikin-Ashi, Renko, Kagi, Point-and-Figure, or Range charts, as these chart types can produce unrealistic results for signal markers and alerts.
Best regards and happy trading
Chervolino

MACD cross over Buy/SellThis Indicator is purely on buying and selling the Script based on the MACD crossover Signals, which can be used for Scalping and finding the trend of the script for short and long term. When the MACD Line crosses the Signal line upwards, the script will move towards higher, and will move towards Lower when it crosses downwards. It's simple. Particularly, when the MACD line Crosses above the zero line after crossing the Signal line, the momentum will be high. Whereas when the MACD line Crosses below the zero line after crossing the Signal line downward, the momentum of falling will be high.

Adaptive Strength MACD [UM]Indicator Description
Adaptive Strength MACD is an adaptive variant of the classic MACD that uses a customized Strength Momentum moving average for both its oscillator and signal lines. This makes the indicator more responsive in trending conditions and more stable in sideways markets.
Key Features
1. Adaptive Strength Momentum MA
Leverages the Adaptive Momentum Oscillator to scale smoothing coefficients dynamically.
2. Trend-Validity Filters
Optional ADX filter ensures signals only fire when trend strength (ADX) exceeds a user threshold.
3. Directional Filter (DI+) confirms bullish or bearish momentum.
4. Color-Coded Histogram
5. Bars turn bright when momentum accelerates, faded when slowing.
6. Grayed out when trend filters disqualify signals.
7. Alerts
Bullish crossover (histogram from negative to positive) and bearish crossover (positive to negative) only when filters validate trend.
Comparison with Regular MACD
1. Moving Averages
Classic MACD uses fixed exponential moving averages (EMAs) for its fast and slow lines, so the smoothing factor is constant regardless of how strong or weak price momentum is.
Adaptive Strength MACD replaces those EMAs with a dynamic “Strength Momentum” MA that speeds up when momentum is strong and slows down in quiet or choppy markets.
2. Signal Line Smoothing
In the classic MACD, the signal is simply an EMA of the MACD line, with one user-selected period.
In the Adaptive Strength MACD , the signal line also uses the Strength Momentum MA on the MACD series—so both oscillator and signal adapt together to the underlying momentum strength.
3. Responsiveness to Momentum
A static EMA reacts the same way whether momentum is surging or fading; you either get too-slow entries when momentum spikes or too-fast whipsaws in noise.
The adaptive MA in your indicator automatically gives you quicker crossovers when there’s a trending burst, while damping down during low-momentum chop.
4. Trend Validation Filters
The classic MACD has no built-in mechanism to know whether price is actually trending versus ranging—you’ll see crossovers in both regimes.
Adaptive Strength MACD includes optional ADX filtering (to require a minimum trend strength) and a DI filter (to confirm bullish vs. bearish directional pressure). When those filters aren’t met, the histogram grays out to warn you.
5. Histogram Coloring & Clarity
Typical MACD histograms often use two colors (above/below zero) or a simple ramp but don’t distinguish accelerating vs. decelerating moves.
Your version employs four distinct states—accelerating bulls, decelerating bulls, accelerating bears, decelerating bears—plus a gray “no-signal” state when filters fail. This makes it easy at a glance to see not just direction but the quality of the move.
6. False-Signal Reduction
Because the classic MACD fires on every crossover, it can generate whipsaws in ranging markets.
The adaptive MA smoothing combined with ADX/DI gating in your script helps suppress those false breaks and keeps you focused on higher-quality entries.
7. Ideal Use Cases
Use the classic MACD when you need a reliable, well-understood trend-following oscillator and you’re comfortable manually filtering choppy signals.
Choose Adaptive Strength MACD \ when you want an all-in-one, automated way to speed up in strong trends, filter out noise, and receive clearer visual cues and alerts only when conditions align.
How to Use
1. Setup
- Adjust Fast and Slow Length to tune sensitivity.
- Change Signal Smoothing to smooth the histogram reaction.
- Enable ADX/DI filters and set ADX Threshold to suit your preferred trend strength (default = 20).
2. Interpretation
- Histogram > 0: Short‐term momentum above long‐term → bullish.
- Histogram < 0: Short‐term below long‐term → bearish.
- Faded greyed bars indicate a weakening move; gray bars show filter invalidation.
How to Trade
Buy Setup:
- Histogram crosses from negative to positive.
- ADX ≥ threshold and DI+ > DI–.
- Look for confirmation (bullish candlestick patterns or support zone).
Sell Setup:
- Histogram crosses from positive to negative.
- ADX ≥ threshold and DI– > DI+.
- Confirm with bearish price action (resistance test or bearish pattern).
Stop & Target
- Place stop just below recent swing low (long) or above recent swing high (short).
- Target risk–reward of at least 1:2, or trail with a shorter‐period adaptive MA.

TTC EMA Scalping Machine with RSI Filter and MACDTTC EMA Scalping Machine with RSI Filter and MACD
TTC EMA Scalping Machine with RSI Filter and MACD is a multi-layered technical analysis tool designed for traders looking to scalp the markets with a combination of trend-following and momentum-based indicators. This strategy leverages Exponential Moving Averages (EMAs) , Relative Strength Index (RSI) , MACD , and Volume Analysis to help traders identify high-probability entry points for short and long trades. The indicator can be used in multiple market conditions and is suited for both beginners and experienced traders looking for clear entry signals.
---
Key Features :
1. EMA-Based Trend Filtering :
- The indicator uses four Exponential Moving Averages (EMAs) with different periods:
- EMA 10 (Short-Term) : The fastest-moving average for detecting quick price movements.
- EMA 20 (Medium-Term) : A central trendline for market momentum.
- EMA 30 (Long-Term) : To observe broader market trends.
- EMA 50 (Longest-Term) : To identify the overall market direction.
- These EMAs are plotted on the chart and used to create EMA bands , visually displaying potential support and resistance levels. Price action inside these bands helps identify scalping opportunities.
2. RSI Filter :
- RSI (Relative Strength Index) is used to gauge overbought and oversold conditions in the market:
- Overbought condition (RSI > 70) : The market may be overextended, signaling the possibility of a short.
- Oversold condition (RSI < 30) : The market may be undervalued, signaling the possibility of a long.
- The RSI filter ensures that trades are not taken when the market is overextended, offering a more conservative approach to trade entries.
3. MACD Momentum Analysis :
- The MACD (Moving Average Convergence Divergence) indicator is included to confirm the trend and momentum direction:
- Long Condition : The MACD line crosses above the signal line, confirming a bullish momentum.
- Short Condition : The MACD line crosses below the signal line, confirming a bearish momentum.
- This serves as an additional filter to verify if the market momentum aligns with the long or short entry criteria.
4. Long Entry (Buy Signal) :
- A long entry signal is triggered when the following conditions are met:
- The price is above EMA 20 (indicating an overall bullish market).
- The price is within the green EMA band (EMA 10 and EMA 20), suggesting short-term support.
- The RSI is below 70 (indicating the market is not overbought).
- The MACD line is above the signal line , showing bullish momentum.
- These conditions combined suggest an ideal environment for entering a long position.
5. Short Entry (Sell Signal) :
- A short entry signal is triggered when the following conditions are met:
- The price is below EMA 20 (indicating an overall bearish market).
- The price is within the green EMA band (EMA 20 and EMA 30), suggesting short-term resistance.
- The RSI is above 30 (indicating the market is not oversold).
- The MACD line is below the signal line , showing bearish momentum.
- These conditions combined suggest an ideal environment for entering a short position.
6. Signal Alerts :
- Long Alerts : Users can set alerts to notify them when a long condition is met. These alerts are triggered when all the criteria for a long entry are satisfied.
- Short Alerts : Similarly, users can set alerts for short signals, notifying them when all the conditions for a short entry are satisfied.
7. EMA Bands :
- The EMA bands are visually represented with colored fills between the EMAs, providing a visual aid to recognize potential trading zones. These zones can serve as a reference for traders to make quick decisions regarding entries and exits.
8. Volume Filter :
- The indicator also includes a volume filter , which compares the current volume to its 20-period simple moving average. Higher volumes provide confirmation of price movement, which can indicate stronger potential for the trade.
---
How It Works :
- Long Trades : The indicator suggests a long position when the price is above the EMA 20, within the green EMA band, the RSI is not overbought, and MACD confirms bullish momentum (MACD line above the signal line).
- Short Trades : The indicator suggests a short position when the price is below the EMA 20, within the green EMA band, the RSI is not oversold, and MACD confirms bearish momentum (MACD line below the signal line).
- Volume Confirmation : The indicator uses a volume-based filter to ensure the trade is backed by sufficient market participation.
---
Usage :
- Best for Scalping : This strategy is designed for short-term trades ( scalping ) and can be applied to any time frame, though it works best on intraday charts, such as 5-minute or 15-minute charts.
- Ideal for Trend-Following : With the use of EMAs and MACD, the strategy is best suited for markets that exhibit clear trends. It helps to avoid whipsaw trades and focuses on capturing medium-term trends.
- Risk Management : By using RSI, MACD, and volume analysis together, this strategy reduces the likelihood of entering a trade in an overextended market, which helps with risk management.
---
Alerts and Signals :
- Long Signals : When all conditions are met for a long trade, a green label appears below the price bar, indicating a potential buy opportunity. An alert is also generated, notifying the user.
- Short Signals : When all conditions are met for a short trade, a red label appears above the price bar, indicating a potential sell opportunity. An alert is also generated, notifying the user.
---
This combination of EMA , RSI , MACD , and volume-based filters creates a balanced approach to scalping, ensuring that traders receive clear, actionable entry signals with trend confirmation, while avoiding overbought and oversold conditions that may lead to false signals. The indicator is designed to help traders confidently identify high-probability trades while maintaining simplicity and clarity in its setup.

MACD Histogram Color Tabledisplaying the MACD Histogram color and divergences across multiple timeframes. Here's how it works step by step:
1. Setting the Table Position
The script allows the user to choose where the table will be placed using the positionOption input. The three options are:
Top Right
Top Left
Top Center
Depending on the selected option, the table is created at the corresponding position.
2. Creating the Table
A table (macdTable) is created with 8 columns (for different timeframes) and 3 rows (for different data points).
3. MACD Histogram Color Function (f_get_macd_color)
This function calculates the MACD line, signal line, and histogram for a given timeframe.
The histogram (histLine) is used to determine the cell background color:
Green if the histogram is positive.
Red if the histogram is negative.
4. Divergence Detection Function (f_detect_divergence)
This function looks for bullish and bearish divergences using the MACD histogram:
Bullish Divergence (🟢)
The price makes a lower low.
The MACD histogram makes a higher low.
Bearish Divergence (🔴)
The price makes a higher high.
The MACD histogram makes a lower high.
The function returns:
🟢 (green circle) for bullish divergence.
🔴 (red circle) for bearish divergence.
"" (empty string) if no divergence is detected.
5. Populating the Table
The table has three rows for each timeframe:
First row: Displays the timeframe labels (5m, 15m, 30m, etc.).
Second row: Shows MACD Histogram color (red/green).
Third row: Displays divergences (🟢/🔴).
This is done using table.cell() for each timeframe.
6. Final Result
A table is displayed on the chart.
Each column represents a different timeframe.
The color-coded row shows the MACD histogram status.
The bottom row shows detected divergences.

Divergence Detector [TradingFinder] RSI + MACD + AO Oscillator 🔵 Introduction
🟣 Understanding Divergence
As mentioned, divergence occurs in technical analysis when a stock's price behaves contrary to indicators on the price chart. Divergence can signify either a reversal of the stock's trend or a continuation of the previous trend correction.
Divergences can act as reversal patterns or continuation patterns. Moreover, divergences can be utilized to identify potential support and resistance levels.
For instance, when an indicator is trending upwards and positive, but the price is declining and trending downwards, divergence occurs. Divergence in a stock indicates trader indecision in buying and selling and warns traders to reconsider their decisions regarding buying or holding the stock.
Divergence aids analysts in identifying critical price points. In indicator divergences, it serves as a potent signal in the realm of technical analysis.
🟣 Types of Divergence
1.Regular Divergence
o Positive Regular Divergence (RD+)
o Negative Regular Divergence (RD-)
2.Hidden Divergence
o Positive Hidden Divergence (HD+)
o Negative Hidden Divergence (HD-)
3.Time Divergence
Key Note : This indicator is specifically designed to identify "Regular Divergence" only. Therefore, the following explanation pertains to this type of divergence.
🔵 Regular Divergence/Convergence
Regular Divergence(Convergence) occurs due to conflicting behavior between the indicator and the price chart, typically at the end of a trend. Recognizing Regular Divergence suggests an anticipation of a trend reversal or a pattern resembling a reversal.
🟣 Positive Regular Divergence (RD+)
In contrast to negative divergence, positive Regular Divergence occurs at the end of a downtrend and between two price lows. It manifests when the price forms a new low on the price chart, but the indicator fails to recognize it.
Positive Regular Divergence indicates strong buying pressure and weak selling pressure. Following the identification of positive divergence on the chart, one can anticipate a price increase for the examined stock.
🟣 Negative Regular Divergence (RD-)
This type of Regular Divergence emerges between two price highs during an uptrend. A new high is formed on the price chart, but the indicator fails to acknowledge it. This scenario indicates negative Regular Divergence.
The likelihood of a subsequent market downturn is high. Negative divergence signifies strong selling pressure and weak buying pressure, suggesting an unfavorable future for the stock.
🔵 How to use
By utilizing the "Fractal Period" input, you can specify your desired periods for identifying divergences.
Additionally, through the "Divergence Detect Method" feature, you can choose which oscillators (MACD, RSI, or AO) to base divergence identification on.
Divergence in MACD Oscillator :
Divergence in the MACD indicator occurs when the price chart and the MACD line form a noticeable opposing pattern, meaning the price moves contrary to the MACD line. In this scenario, one expects a reversal in price direction.
Divergence in RSI Oscillator :
If divergence occurs during a downtrend on the price chart (two consecutive lows, with the second low being lower) and on the corresponding RSI point (two consecutive lows, with the second low being higher), it signifies positive Regular Divergence and implies a buying signal.
Conversely, if divergence occurs during an uptrend on the price chart (two consecutive highs, with the second high being higher) and on the corresponding RSI point (two consecutive highs, with the second high being lower), it indicates negative Regular Divergence, signaling a selling opportunity.
Divergence in AO Oscillator :
The AO indicator calculates histograms similar to the AO base. It calculates the difference between the simple moving averages of 5 and 34 periods based on the median of each bar. Then, it plots the bars based on the difference.
It then compares the histograms to detect peaks and troughs in the AO histograms and compares the identified peaks and troughs to the price. Whenever divergence is detected, it plots lines and arrows.
🔵 Table
The table contains information on the functional features of this oscillator that you can utilize. Four categories of information are presented in the table: "Exist," "Consecutive," "Divergence Quality," and "Change Phase Indicator."
Exist :
If divergence exists, you'll see "+" in this row.
Consecutive :
Divergences may occur consecutively. If same-type divergences form within short intervals, you can observe the count in this row.
Divergence Quality : Based on the number of consecutive divergences, their quality can be evaluated. If one divergence exists, its quality is considered "Normal." If two divergences exist, the quality is "Good," and if three or more divergences exist, the quality is considered "Strong."
Change Phase Indicator : If a phase change occurs between two oscillation peaks formed based on divergence, this change is identified and displayed in this row.

MACDh with divergences & impulse system (overlayed on prices)-----------------------------------------------------------------
General Description:
This indicator ( the one on the top panel above ) consists on some lines, arrows and labels drawn over the price bars/candles indicating the detection of regular divergences between price and the classic MACD histogram (shown on the low panel). This script is special because it can be adjusted to fit several criteria when trading divergences filtering them according to the "height" and "width" of the patterns. The script also includes the "extra features" Impulse System and Keltner Channels, which you will hardly find anywhere else in similar classic MACD histogram divergence indicators.
The indicator helps to find trend reversals, and it works on any market, any instrument, any timeframe, and any market condition (except against really strong trends that do not show any other sign of reversion yet).
Please take on consideration that divergences should be taken with caution.
-----------------------------------------------------------------
Definition of classic Bullish and Bearish divergences:
* Bearish divergences occur in uptrends identifying market tops. A classical or regular bearish divergence occurs when prices reach a new high and then pull back, with an oscillator (MACD histogram in this case) dropping below its zero line. Prices stabilize and rally to a higher high, but the oscillator reaches a lower peak than it did on a previous rally.
In the chart above (weekly charts of NKE, Nike, Inc.), in area X (around August 2021), NKE rallied to a new bull market high and MACD-Histogram rallied with it, rising above its previous peak and showing that bulls were extremely strong. In area Y, MACD-H fell below its centerline and at the same time prices punched below the zone between the two moving averages. In area Z, NKE rallied to a new bull market high, but the rally of MACD-H was feeble, reflecting the bulls’ weakness. Its downtick from peak Z completed a bearish divergence, giving a strong sell signal and auguring a nasty bear market.
* Bullish divergences , in the other hand, occur towards the ends of downtrends identifying market bottoms. A classical (also called regular) bullish divergence occurs when prices and an oscillator (MACD histogram in this case) both fall to a new low, rally, with the oscillator rising above its zero line, then both fall again. This time, prices drop to a lower low, but the oscillator traces a higher bottom than during its previous decline.
In the example in the chart above (weekly charts of NKE, Nike, Inc.), you see a bearish divergence that signaled the October 2022 bear market bottom, giving a strong buy signal right near the lows. In area A, NKE (weekly charts) appeared in a free fall. The record low A of MACD-H indicated that bears were extremely strong. In area B, MACD-H rallied above its centerline. Notice the brief rally of prices at that moment. In area C, NKE slid to a new bear market low, but MACD-H traced a much more shallow low. Its uptick completed a bullish divergence, giving a strong buy signal.
-----------------------------------------------------------------
Some cool features included in this indicator:
1. This indicator also includes the “ Impulse System ”. The Impulse System is based on two indicators, a 13-day exponential moving average and the MACD-Histogram, and identifies inflection points where a trend speeds up or slows down. The moving average identifies the trend, while the MACD-Histogram measures momentum. This unique indicator combination is color coded into the price bars for easy reference.
Calculation:
Green Price Bar: (13-period EMA > previous 13-period EMA) and
(MACD-Histogram > previous period's MACD-Histogram)
Red Price Bar: (13-period EMA < previous 13-period EMA) and
(MACD-Histogram < previous period's MACD-Histogram)
Price bars are colored blue when conditions for a Red Price Bar or Green Price Bar are not met. The MACD-Histogram is based on MACD(12,26,9).
The Impulse System works more like a censorship system. Green price bars show that the bulls are in control of both trend and momentum as both the 13-day EMA and MACD-Histogram are rising (you don't have permission to sell). A red price bar indicates that the bears have taken control because the 13-day EMA and MACD Histogram are falling (you don't have permission to buy). A blue price bar indicates mixed technical signals, with neither buying nor selling pressure predominating (either both buying or selling are permitted).
2. Another "extra feature" included here is the " Keltner Channels ". Keltner Channels are volatility-based envelopes set above and below an exponential moving average.
3. It were also included a couple of EMAs.
Everything can be removed from the chart any time.
-----------------------------------------------------------------
Options/adjustments for this indicator:
*Horizontal Distance (width) between two tops/bottoms criteria.
Refers to the horizontal distance between the MACH histogram peaks involved in the divergence
*Height of tops/bottoms criteria (for Histogram).
Refers to the difference/relation/vertical distance between the MACH HISTOGRAM peaks involved in the divergence: 1st Histogram Peak is X times the 2nd.
*Height/Vertical deviation of tops/bottoms criteria (for Price).
Deviation refers to the difference/relation/vertical distance between the PRICE peaks involved in the divergence.
*Plot Regular Bullish Divergences?.
*Plot Regular Bearish Divergences?.
*Delete Previous Cancelled Divergences?.
*Shows a pair of EMAs.
*Shows Keltner Channels (using ATR)
Keltner Channels are volatility-based envelopes set above and below an exponential moving average.
*This indicator also has the option to show the Impulse System over the price bars/candles.

Strategy Myth-Busting #7 - MACDBB+SSL+VSF - [MYN]This is part of a new series we are calling "Strategy Myth-Busting" where we take open public manual trading strategies and automate them. The goal is to not only validate the authenticity of the claims but to provide an automated version for traders who wish to trade autonomously.
Our seventh one we are automating is the "Magic MACD Indicator: Crazy Accurate Scalping Trading Strategy ( 74% Win Rate )" strategy from "TradeIQ" who claims to have backtested this manually and achieved 427% profit with a 74% winrate over 100 trades in just a 4 months. I was unable to emulate these results consistently accommodating for slippage and commission but even so the results and especially the high win-rate and low markdown is pretty impressive and quite respectable.
This strategy uses a combination of 3 open-source public indicators:
AK MACD BB v 1.00 by Algokid
SSL Hybrid by Mihkel00
Volume Strength Finder by Saravanan_Ragavan
This is considered a trend following Strategy. AK MACD BB is being used as the primary short term trend direction indicator with an interesting approach of using Bollinger Bands to define an upper and lower range and upon the MACD going above the upper Bollinger Bands, it's indicative of an up trend, where as if the MACD is below the lower Bollinger Band, it's indicative of a down trend. To eliminate false signals, SSL Hyrbid is used as a trend confirmation filter, confirming and eliminating false signals from the MACD BB. It does this by validating the price action is above the the EMA and the SSL is positive that is a confirmation of an uptrend. When the price action is below the EMA and the SSL is negative, that is an confirmation of a downtrend. To avoid taking trades during ranged markets, VSF Buyer's Strength is used so the buyers/sellers strength and must be above 50% or the trade will not be inititiated.
Trading Rules
5 min candles but other lower time frames even below 5m work quite well too.
Best results can be found by tweaking these 2 input parameters:
Number Of bars to look back to ensure MACD isn't above/below Zero Line
Number Of bars back to look for SSL pullback
Long Entry when these conditions are true
AK MACD BB BB issues a new continuation long signal. A new green circle must appear on the indicator and these circles should not be touching across the zero level while they were previously red
SSL Hybrid price action closes above the EMA and the line is blue color and then creates a pullback . The pullback is confirmed when the color changes from blue to gray or from blue to red.
VSF Buyers strength above 50% at the time the MACD indicator issues a new long signal.
Short Entry when these conditions are true
AK MACD BB issues a new continuation short signal. A new red circle must appear on the indicator and these circles should not be touching across the zero level while they were previously green
SSL Hybrid price action closes below the EMA and the line is red color then it has to create a pullback . The pullback is confirmed when the color changes from red to gray or from red to blue.
VSF Sellers strength above 50% at the time the MACD indicator issues a new short signal.
Stop Loss at EMA Line with TP Target 1.5x the risk
If you know of or have a strategy you want to see myth-busted or just have an idea for one, please feel free to message me.

Short Swing Bearish MACD Cross (By Coinrule)This strategy is oriented towards shorting during downside moves, whilst ensuring the asset is trading in a higher timeframe downtrend, and exiting after further downside.
This script can work well on coins you are planning to hodl for long-term and works especially well whilst using an automated bot that can execute your trades for you. It allows you to hedge your investment by allocating a % of your coins to trade with, whilst not risking your entire holding. This mitigates unrealised losses from hodling as it provides additional cash from the profits made. You can then choose to hodl this cash, or use it to reinvest when the market reaches attractive buying levels. Alternatively, you can use this when trading contracts on futures markets where there is no need to already own the underlying asset prior to shorting it.
ENTRY
This script utilises the MACD indicator accompanied by the Exponential Moving Average (EMA) 450 to enter trades. The MACD is a trend following momentum indicator and provides identification of short-term trend direction. In this variation it utilises the 11-period as the fast and 26-period as the slow length EMAs, with signal smoothing set at 9.
The EMA 450 is used as additional confirmation to prevent the script from shorting when price is above this long-term moving average. Once price is above the EMA 450 the script will not open any shorts - preventing the rule from attempting to short uptrends. Due to this, this strategy is ideal for setting and forgetting.
The script will enter trades based on two conditions:
1) When the MACD signals a bearish cross. This occurs when the EMA 11 crosses below the EMA 26 within the MACD signalling the start of a potential downtrend.
2) Price has closed below the EMA 450. Price closing below this long-term EMA signals that the asset is in a sustained downtrend. Price breaking above this could indicate a bullish strength in which shorting would not be profitable.
EXIT
This script utilises a set take-profit and stop-loss from the entry of the trade. The take profit is set at 8% and the stop loss of 4%, providing a risk reward ratio of 2. This indicates the script will be profitable if it has a win ratio greater than 33%.
Take-Profit Exit: -8% price decrease from entry price.
OR
Stop-Loss Exit: +4% price increase from entry price.
Based on backtesting results across a selection of assets, the 45-minute and 1-hour timeframes are the best for this strategy.
The strategy assumes each order is using 30% of the available coins to make the results more realistic and to simulate you only ran this strategy on 30% of your holdings. A trading fee of 0.1% is also taken into account and is aligned to the base fee applied on Binance.
The backtesting data was recorded from December 1st 2021, just as the market was beginning its downtrend. We therefore recommend analysing the market conditions prior to utilising this strategy as it operates best on weak coins during downtrends and bearish conditions, however the EMA 450 condition should mitigate entries during bullish market conditions.

[BTCover]MACD Histogram Up and Down's EnergyWelcome to BTCover's Pine Script in Tradingview.
Today we show you a MACD's script. If you want to find the divergence of the MACD histogram, You can use this script to check the MACD histogram's Energy clear and quick.
if you have more idea, welcome to comment or pm. Enjoy it.

Ultimate MACD Strategy [PrismBot] [Lite]Included in this Ultimate MACD Lite Strategy:
✔️ Tweak a multitude of specific settings (MA lengths, R:R, SL distance etc)
✔️ Enable advanced setup filters
✔️ Use money management and risk calculations
✔️ Draw trade info directly to chart (eg. SL size in percent, win rate etc)
✔️ Use various filters (eg. time filter, date filter, MA slope angle etc)
✔️ Manage risk per position when auto-trading forex through AutoView
✔️ Choose from various alert conditions!
✔️ Sync to any bot or algorithmic trading system
Some details about this strategy:
LONG SIGNAL
When the MACD is below the zero line of the histogram, close is above the 200EMA, and the MACD line crosses above the signal line, longs are taken
SHORT SIGNAL
When the MACD is above the zero line of the histogram, close is below the 200EMA, and the MACD line crosses below the signal line, shorts are taken
A couple of options are given for how to calculator stop losses.
The Take profit is calculated by the risk of the stop loss. So a 1.5 take profit target is 1.5 times the stop loss added to the entry price.
There is also an option to filter out trades by the histogram deviation. This prevents crossovers that are too close to the histogram from being taken.
Please note I used the code for the PPO instead of the traditional MACD to make calculating these percentage deviations more consistent across multiple asset types.
You can easily enable and disable strategies using the checkbox.
This strategy incorporates a risk to reward system where the user can select between ATR and Percent based stop losses and take profit targets. This means that the user has much better control over money management when utilizing this strategy and it doesn't require you to babysit the strategy to ensure it's entering and existing strategies in an ideal place.
You can also enter custom messages for alerts for use with bots (set alerts to "alert() function calls only")

Triple Exponential MACDA modification of the classic MACD to use Triple EMAs which tends to have less lag than the standard indicator. (I also have a Double Exp MACD indicator, I tend to use both simultaneously)
Alert conditions are pre-configured for simple line crosses and you can enable/disable the histogram from the indicator options menu.
Enjoy!

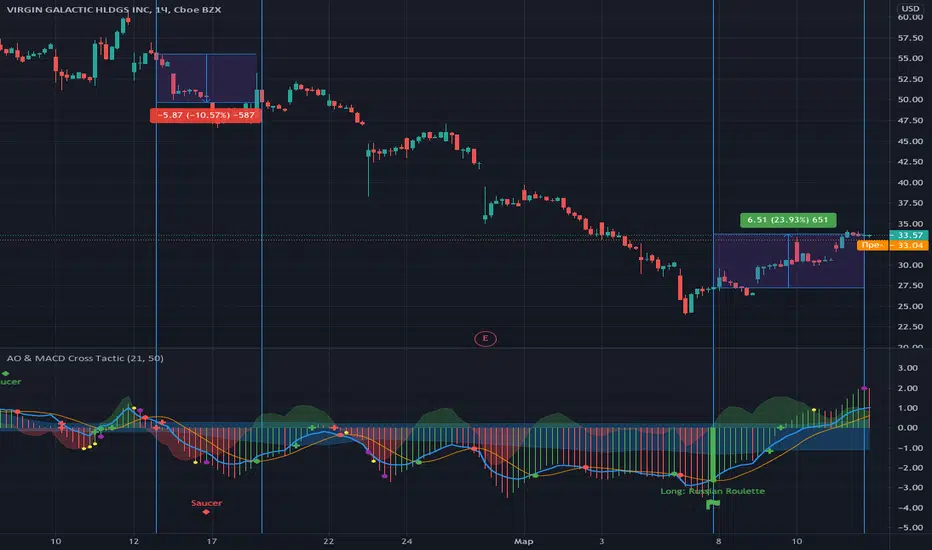
Awesome Oscillator & MACD Cross TacticOscillator for Tradingview based on MACD and Awesome Oscillator. This oscillator is designed to identify potential local growth or decline in prices as part of a trend movement.
For some ridiculous reason I am not allowed to attach screenshots of graphs and links on TradingView, so I hope that you will find my detailed instructions on my github page: github.com/samgozman/AO-MACD-cross-tradingview
EMA Cross and MACD Signal CombinedThe rule is simple.
When MACD crosses up, it is supposed to give a buy signal. However, before entering into a Long position, there is a need for a confirmation. This confirmation can be from a down trendline breakout or from another indicator.
In this case, I've chosen the Exponential Moving Average Cross to be as the confirmation.
The Buy Signal will appear when there it fulfills the following conditions:-
i. The MACD line is above the Signal Line
ii. The fast EMA crosses the Slow EMA
The Sell signal will appears when the opposite of the above condition is met.
This indicator is meant for the Swing Trader whom would like to hold a position for a long time.

Combing in MACD and MTFHi all, I'm trying to wedge in the MACD into a multiple timeframe. Scope is to create:
1) an alert when the MACD across all timeframes is positive,
2) an alert when the MACD across all timeframes is negative, and
3) one when neither of them is applicable.
Would anyone be so kind to give it some thoughts, please?
//@version=2
strategy(" Easy MTF Strategy", overlay=false)
TF_1_time = input("3", "Timeframe 1")
TF_2_time = input("5", "Timeframe 2")
TF_3_time = input("15", "Timeframe 3")
TF_4_time = input("30", "Timeframe 4")
fastLen = input(title="Fast Length", type=integer, defval=12)
slowLen = input(title="Slow Length", type=integer, defval=26)
sigLen = input(title="Signal Length", type=integer, defval=9)
= macd(close, fastLen, slowLen, sigLen)
width = 5
upcolor = green
downcolor = red
neutralcolor = blue
linestyle = line
TF_1 = security(tickerid, TF_1_time, open) < security(tickerid, TF_1_time, close) ? true:false
TF_1_color = TF_1 ? upcolor:downcolor
TF_2 = security(tickerid, TF_2_time, open) < security(tickerid, TF_2_time, close) ? true:false
TF_2_color = TF_2 ? upcolor:downcolor
TF_3 = security(tickerid, TF_3_time, open) < security(tickerid, TF_3_time, close) ? true:false
TF_3_color = TF_3 ? upcolor:downcolor
TF_4 = security(tickerid, TF_4_time, open) < security(tickerid, TF_4_time, close) ? true:false
TF_4_color = TF_4 ? upcolor:downcolor
TF_global = TF_1 and TF_2 and TF_3 and TF_4
TF_global_bear = TF_1 == false and TF_2 == false and TF_3 == false and TF_4 == false
TF_global_color = TF_global ? green : TF_global_bear ? red : white
TF_trigger_width = TF_global ? 6 : width
plot(1, style=linestyle, linewidth=width, color=TF_1_color)
plot(5, style=linestyle, linewidth=width, color=TF_2_color)
plot(10, style=linestyle, linewidth=width, color=TF_3_color)
plot(15, style=linestyle, linewidth=width, color=TF_4_color)
plot(25, style=linestyle, linewidth=4, color=TF_global_color)
exitCondition_Long = TF_global_bear
exitCondition_Short = TF_global
longCondition = TF_global
if (longCondition)
strategy.entry("MTF_Long", strategy.long)
shortCondition = TF_global_bear
if (shortCondition)
strategy.entry("MTF_Short", strategy.short)
strategy.close("MTF_Long", when=exitCondition_Long)
strategy.close("MTF_Short", when=exitCondition_Short)

MACD Divergence +This study plots MACD Divergences and has the option of plotting a Top Dog Trading - MOM and DAD Version of the MACD
MACD Histogram and outline change color when increasing or decreasing above or below the zero-line,
Background also changes color according to MACD Line cross of Signal Line and 0 line or The Direction of DAD
Plenty of Alerts so that you dont have to stare at the screen all day

Easy to Use MACD+RSI Strategy
BEGINNERS REJOICE!
Easy to use strategy test using MACD with RSI as a confirming indicator. The code is structured to make it easy to manipulate the variables to your choosing.
EASY TO CHANGE CODE VARIABLES
LINE 2 = Change the amount you invest every trade and the currency
LINE 8/9/10 = Change the defval of each of these lines to backtest from a certain date
LINE 16/17/18 = Change the MACD sensitivity by changing the defval on each line
LINE 21 = Change the value after close toadjust the sensitivity of the RSI
LINE 37/39 = Change/remove the < and > variables for macdLine and rsivalue after the crossover/crossunder to adjust your buying point further.
As a beginner you may not feel comfortable with shorting stocks, therefore LINE 5 was added to only allows long positions.
Funny how a simple indicator can return such a high profitability. Couple this with some trend/exit strategies and you'll have something really special!
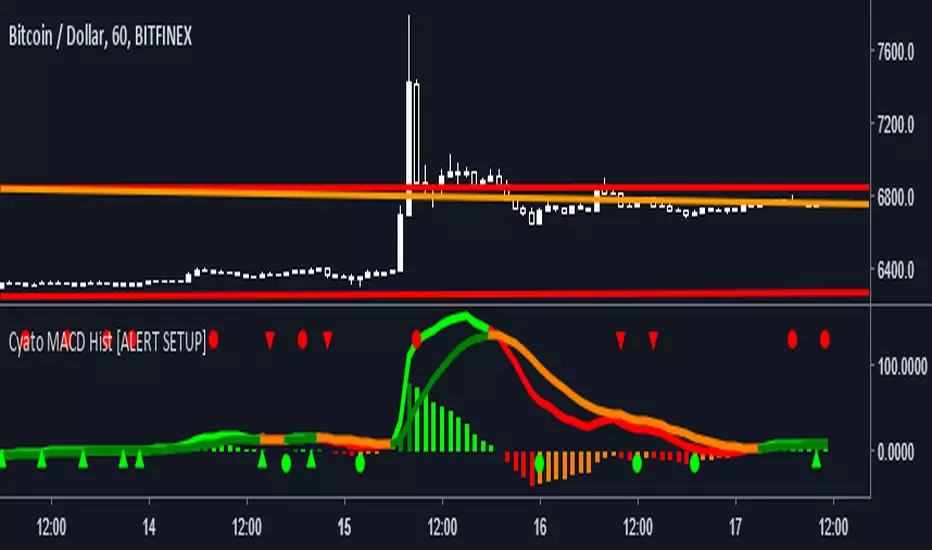
Cyatophilum MACD Hist [ALERT SETUP]Hello, I made a classic MACD Histogram indicator, with custom alerts and parameters though.
Shapes
Green circles : The MACD histogram is reversing, this is a buy (or Long) signal.
Red circles : The MACD histogram is reversing, this is a sell (or Short) signal.
Green Arrow up : The MACD histogram is enduring a bear fakeout. This is a buy signal.
Red Arrow up : The MACD histogram is enduring a bullfakeout. This is a sell signal.
Parameters ( INPUTS )
Classic MACD parameters.
Sensitivity : (1 = really sensitive to reverals and fakeouts - 5 = much less sensitive)
Activate Fakeouts : default is true. Uncheck to deactivate fakeout on chart /!\ will also deactivate fakeout alerts
Alerts (Automated trading alerts : SMS, email, etc.) that you can create :
Buy : a buy signal that will trigger on a bull reversal or a bear fakeout. No more than one buy/sell signal in a row (You will not get multiple buy signals or multiple sell signals in a row)
Sell : a sell signal that will trigger on a bearreversal or a bullfakeout. No more than one buy/sell signal in a row (You will not get multiple buy signals or multiple sell signals in a row)
Buy (Bull Reversal) : a buy signal that will trigger on each bull reversal.
Buy (Bear Fakeout) : a buy signal that will trigger on each bear fakeout.
Sell (Bear Reversal) : a sell signal that will trigger on each bear reversal.
Sell (Bull Fakeout) : a sell signal that will trigger on each bull fakeout.
If you like, leave a comment, thanks! If you find any bug, thanks for telling me!
-----------------------------------------------------------------------------------------------------------------
I am selling access to private scripts and backtests that can be found on my website .
I am also open to commissions : TradingView's PineScript development, reverse engineering.
Thanks.
MACD, backtest 2015+ only, cut in half and doubledThis is only a slight modification to the existing "MACD Strategy" strategy plugin!
found the default MACD strategy to be lacking, although impressive for its simplicity. I added "year>2014" to the IF buy/sell conditions so it will only backtest from 2015 and beyond ** .
I also had a problem with the standard MACD trading late, per se. To that end I modified the inputs for fast/slow/signal to double. Example: my defaults are 10, 21, 10 so I put 20, 42, 20 in. This has the effect of making a 30min interval the same as 1 hour at 10,21,10. So if you want to backtest at 4hr, you would set your time interval to 2hr on the main chart. This is a handy way to make shorter time periods more useful even regardless of strategy/testing, since you can view 15min with alot less noise but a better response.
Used on BTCCNY OKcoin, with the chart set at 45 min (so really 90min in the strategy) this gave me a percent profitable of 42% and a profit factor of 1.998 on 189 trades.
Personally, I like to set the length/signals to 30,63,30. Meaning you need to triple the time, it allows for much better use of shorter time periods and the backtests are remarkably profitable. (i.e. 15min chart view = 45min on script, 30min= 1.5hr on script)
** If you want more specific time periods you need to try plugging in different bar values: replace "year" with "n" and "2014" with "5500". The bars are based on unix time I believe so you will need to play around with the number for n, with n being the numbers of bars.

MACD Remastered [CHE]MACD Remastered — Robust MACD with confirmed pivot-based divergence, optional signal bands, and ready-to-use alerts.
Summary
This indicator augments classic MACD with a robust, confirmed pivot-based divergence engine and an optional signal channel using Bollinger Bands. Divergence signals are only produced after a pivot is confirmed, which reduces noise from transient swings. A line-of-sight clearance check filters cases where the MACD histogram path contradicts the divergence, further cutting false flags. Histogram coloring clarifies momentum changes, while optional triangles project the same signals onto the main chart for quick context.
Motivation: Why this design?
Standard MACD divergence tools tend to fire early in volatile phases and flip during consolidation. The core idea here is to delay decision points until a pivot is confirmed and to validate the path between pivots. This addresses fake flips and improves signal credibility at the cost of some latency. Optional bands around the Signal line add context about compression and expansion without altering MACD’s core behavior.
What’s different vs. standard approaches?
Reference baseline: Classical MACD (fast and slow moving averages, Signal line, histogram) with simple divergence checks.
Architecture differences:
Confirmed pivot logic with left and right bars.
Line-of-sight clearance test across the histogram path between pivots.
Optional Signal-line Bollinger Bands with configurable length and width.
Composite “Any Divergence” alert plus separate regular and hidden alerts.
Optional main-chart triangles using forced overlay for at-a-glance context.
Practical effect: Fewer early or contradictory divergence signals, clearer momentum context via histogram colors and a visible Signal channel during compression and expansion.
How it works (technical)
The MACD line derives from a fast and a slow moving average on a chosen source. The Signal line smooths the MACD line using a selected moving average type and length. The histogram is the difference between MACD and Signal and is colored by direction and acceleration.
Divergence uses confirmed pivots: a pivot forms only after a set number of bars on the right side, so the event is locked in. The engine retrieves the last two relevant pivots and checks price movement versus the MACD histogram movement to classify regular or hidden divergence. A line-of-sight clearance routine traverses the histogram path between the two pivots and rejects the signal if the path invalidates the directional relationship. When enabled, Bollinger Bands are plotted around the Signal line; width scales with standard deviation. Programmatic alerts fire only on confirmed bars. No higher-timeframe requests are used.
Parameter Guide
Oscillator MA Type — Sets fast and slow MA family for MACD. Default: EMA. Tip: EMA is more responsive; SMA is steadier.
Fast Length — Fast MA period. Default: 12. Trade-off: Shorter is quicker but noisier.
Slow Length — Slow MA period. Default: 26. Trade-off: Longer reduces noise but adds lag.
Source — Price input. Default: Close. Tip: Use a stable source for consistency.
Signal MA Type — Moving average family for Signal. Default: EMA.
Signal Length — Smoothing of MACD into Signal. Default: 9. Trade-off: Longer smooths more, reacts slower.
Calculate Divergence — Enables divergence engine. Default: True.
Enable Bollinger Bands on Signal — Adds bands around Signal. Default: False.
BB Length — Sampling window for bands. Default: 20. Active: Only when bands are enabled.
BB StdDev — Band width in standard deviations. Default: 2.0. Bounds: between about zero point zero zero one and fifty.
Pivot Left / Pivot Right — Bars to the left and right that define a confirmed pivot. Default: five and five. Trade-off: Larger values mean stronger but slower pivots.
Min / Max Bars Between Pivots — Valid window between two pivots. Default: five and sixty. Tip: Increase minimum to reduce micro-divergences.
Detect Hidden — Include hidden divergence. Default: True.
Draw Lines — Draw connector lines on the MACD pane. Default: True.
Alerts: Enable / Regular / Hidden / Frequency / Prefix — Control alert emission, categories, cadence, and label. Defaults: Enabled, both categories on, once per bar close, prefix “MACD RM”.
Reading & Interpretation
Histogram: Columns above zero reflect positive momentum; below zero reflect negative momentum. Color shifts indicate momentum increasing or decreasing within each side.
MACD and Signal: Crosses and distance indicate momentum shifts and strength. When bands are enabled, touches and departures hint at compression and expansion around the Signal.
Divergence: Solid green lines and labels indicate regular bullish; solid red indicate regular bearish. Dashed teal and dashed orange denote hidden bullish and hidden bearish. Triangles on the main chart mirror these events for quicker visibility.
Practical Workflows & Combinations
Trend following: Use histogram color transitions with a structure filter such as higher highs and higher lows for long bias, or lower highs and lower lows for short bias. Divergence against the prevailing structure suggests caution or partial exits.
Exits and risk: In a long, regular bearish divergence near resistance can justify scaling out or tightening stops. Hidden divergence in the trend direction can support continuation but should not replace risk controls.
Multi-asset / Multi-timeframe: Works across liquid futures, forex, indices, and large-cap equities. Start with defaults on four-hour and daily; shorten lengths on intraday only when liquidity is strong.
Behavior, Constraints & Performance
Repaint and confirmation: Signals are anchored only after the right-side pivot bars complete; alerts trigger on confirmed bars. This intentionally adds latency to reduce noise.
No higher-timeframe requests: No `security` calls are used; repaint risk is primarily tied to live bars before confirmation.
Resources: Declared `max_bars_back` is five hundred. The divergence path check iterates between pivots, bounded by the maximum bars parameter. Line objects may accumulate; limits are set for lines and labels.
Known limits: Latency at sharp turns, potential misses during fast single-bar reversals, and sensitivity to extremely choppy sessions if minimum gap between pivots is set too low.
Sensible Defaults & Quick Tunin g
Starting point: EMA, twelve and twenty-six with Signal nine; pivots five and five; minimum five, maximum sixty; alerts on close; bands off.
Too many flips: Increase Signal length, raise pivot counts, and increase minimum bars between pivots. Consider disabling hidden divergence.
Too sluggish: Reduce pivot counts, lower Signal length, and enable bands to visualize early compression.
Cluttered chart: Keep lines off and rely on labels and main-chart triangles. Use the alert prefix to route events cleanly.
What this indicator is—and isn’t
This is a visualization and signal layer for MACD with confirmed, path-checked divergence and optional Signal bands. It is not a trading system, not predictive, and not a position management framework. Use it together with structure analysis, liquidity context, and explicit risk controls.
Disclaimer
The content provided, including all code and materials, is strictly for educational and informational purposes only. It is not intended as, and should not be interpreted as, financial advice, a recommendation to buy or sell any financial instrument, or an offer of any financial product or service. All strategies, tools, and examples discussed are provided for illustrative purposes to demonstrate coding techniques and the functionality of Pine Script within a trading context.
Any results from strategies or tools provided are hypothetical, and past performance is not indicative of future results. Trading and investing involve high risk, including the potential loss of principal, and may not be suitable for all individuals. Before making any trading decisions, please consult with a qualified financial professional to understand the risks involved.
By using this script, you acknowledge and agree that any trading decisions are made solely at your discretion and risk.
Do not use this indicator on Heikin-Ashi, Renko, Kagi, Point-and-Figure, or Range charts, as these chart types can produce unrealistic results for signal markers and alerts.
Best regards and happy trading
Chervolino
