5 min scalp macd5 min scalp macd, 5 min scalp macd, 5 min scalp macd, 5 min scalp macd, 5 min scalp macd, 5 min scalp macd, 5 min scalp macd, 5 min scalp macd
ค้นหาในสคริปต์สำหรับ "macd"

Combo Backtest 123 Reversal & MACD Crossover with Trail and Stop
This is a modification of @HPotter "Combo Backtest 123 Reversal & MACD Crossover" script.
I've added a trail stop, basic leverage simulation and stop loss.
Below is HPotter's explanation of the script principals.
First strategy
This System was created from the Book "How I Tripled My Money In The
Futures Market" by Ulf Jensen, Page 183. This is reverse type of strategies.
The strategy buys at market, if close price is higher than the previous close
during 2 days and the meaning of 9-days Stochastic Slow Oscillator is lower than 50.
The strategy sells at market, if close price is lower than the previous close price
during 2 days and the meaning of 9-days Stochastic Fast Oscillator is higher than 50.
Second strategy
MACD – Moving Average Convergence Divergence. The MACD is calculated
by subtracting a 26-day moving average of a security's price from a
12-day moving average of its price. The result is an indicator that
oscillates above and below zero. When the MACD is above zero, it means
the 12-day moving average is higher than the 26-day moving average.
This is bullish as it shows that current expectations (i.e., the 12-day
moving average) are more bullish than previous expectations (i.e., the
26-day average). This implies a bullish , or upward, shift in the supply/demand
lines. When the MACD falls below zero, it means that the 12-day moving average
is less than the 26-day moving average, implying a bearish shift in the
supply/demand lines.
A 9-day moving average of the MACD (not of the security's price) is usually
plotted on top of the MACD indicator. This line is referred to as the "signal"
line. The signal line anticipates the convergence of the two moving averages
(i.e., the movement of the MACD toward the zero line).
Let's consider the rational behind this technique. The MACD is the difference
between two moving averages of price. When the shorter-term moving average rises
above the longer-term moving average (i.e., the MACD rises above zero), it means
that investor expectations are becoming more bullish (i.e., there has been an
upward shift in the supply/demand lines). By plotting a 9-day moving average of
the MACD , we can see the changing of expectations (i.e., the shifting of the
supply/demand lines) as they occur.
WARNING:
- For purpose educate only
- This script to change bars colors.

G-MACD ColorIt's just MACD and fill the color
How to use
RED : MACD < Signal line and MACD < 0
Blue : MACD > Signal line and MACD < 0
GREEN : MACD > Signal liine and MACD > 0
Yellow : MACD < Signal line and MACD < 0
Goodluck :D

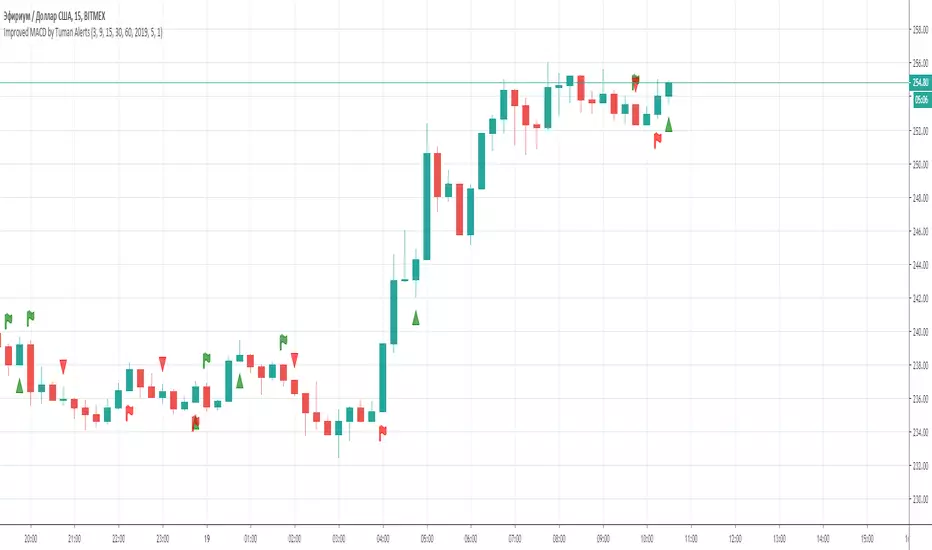
Sk Macd TrendSk Macd Trend + Hidden Bullish MACD Divergence (Enhanced)
Original Author: Sujeetjeet1705
Enhanced by: Community Contribution (MACD-style Hidden Bullish Signal)
A powerful and widely respected WaveTrend-based oscillator with all the original premium features intact:
• Laguerre-smoothed WaveTrend (WT1 & WT2)
• Professional 4-color momentum histogram (strong/weak bull & bear)
• Filled MACD/Signal area for instant trend bias
• Built-in regular + hidden divergences (signal & histogram)
• Smart trailing stop system with ATR-based dynamic stops
• Clean buy/sell cross signals with overbought/oversold filtering
NEW POWERFUL ADDITION:
Hidden Bullish MACD-Style Divergence Detector
(Exactly like institutional MACD hidden bullish setups)
The indicator now highlights — with a bright blue histogram bar and a blue square below the price candle — when ALL three high-probability conditions are met simultaneously:
1. WaveTrend Histogram (wt3) is below zero (still in bearish territory)
2. Histogram is rising (wt3 > wt3 ) → momentum turning up
3. Price makes a higher low (low > low ) → bullish hidden divergence
This is one of the strongest early-reversal signals in technical analysis and often marks the exact bottom before explosive bounces.
Key Features:
• Blue square appears directly on the main chart (overlay)
• Histogram turns solid blue only on valid setups (very easy to spot)
• No repainting — 100% real-time reliable
• Works perfectly on all timeframes and assets
• All original features, colors, and logic preserved
Perfect for swing traders, reversal hunters, and anyone looking to catch major turns early.
Use with confidence — this is now one of the most complete and visually intuitive WaveTrend oscillators available on TradingView.
Enjoy the edge!

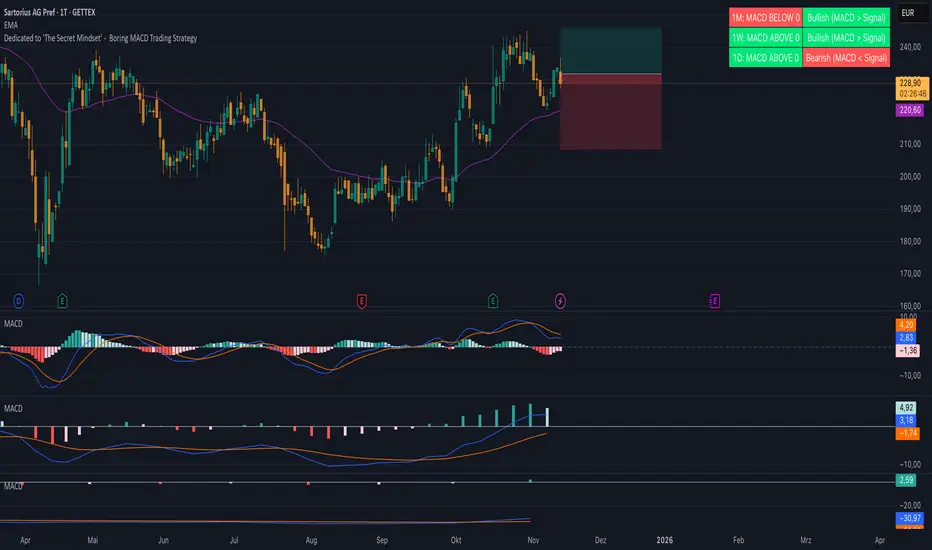
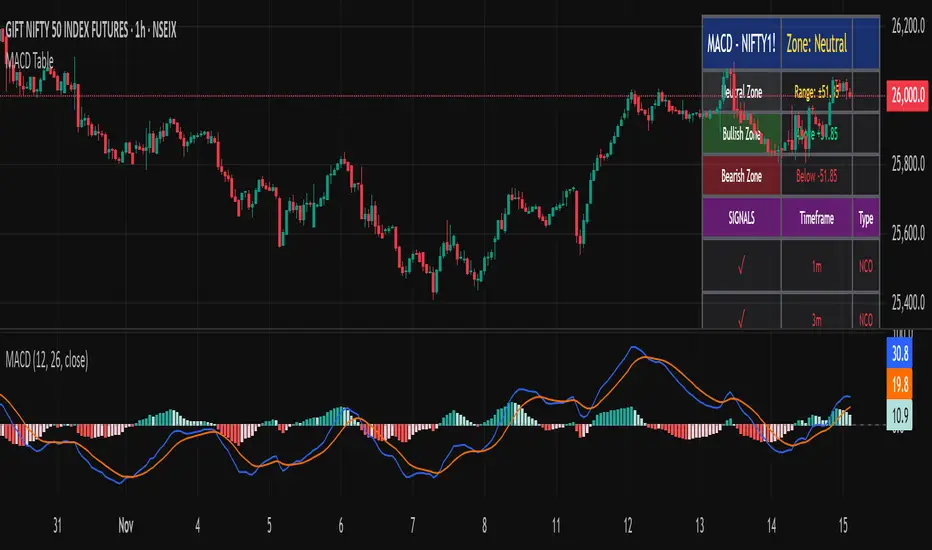
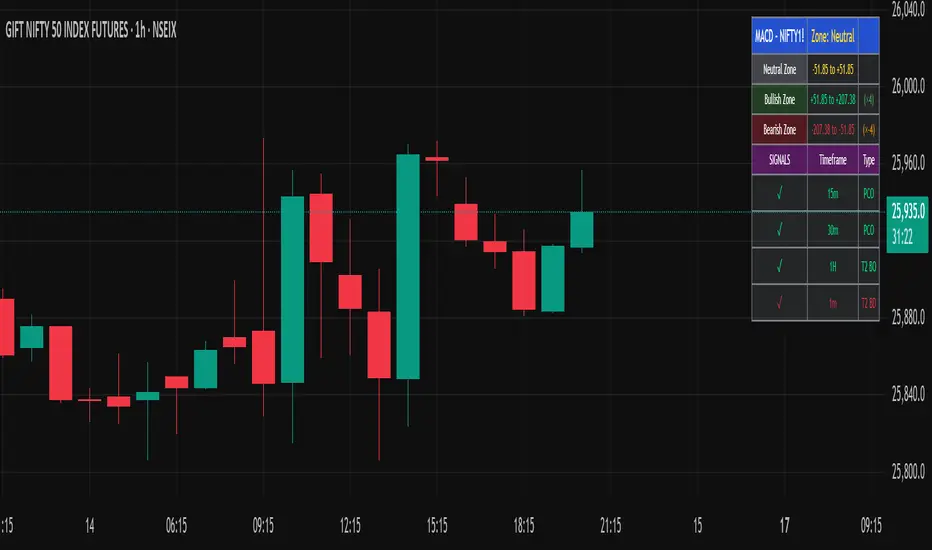
Boring MACD Trading Strategy - Dedicated to 'The Secret Mindset'This indicator displays the MACD status across three selectable timeframes, regardless of the chart timeframe you are currently viewing.
For each timeframe, it shows whether the MACD line is above or below the zero line, indicating bullish or bearish momentum.
It also shows whether the MACD line is above or below the signal line, revealing the current trend condition as bullish, bearish, or neutral.
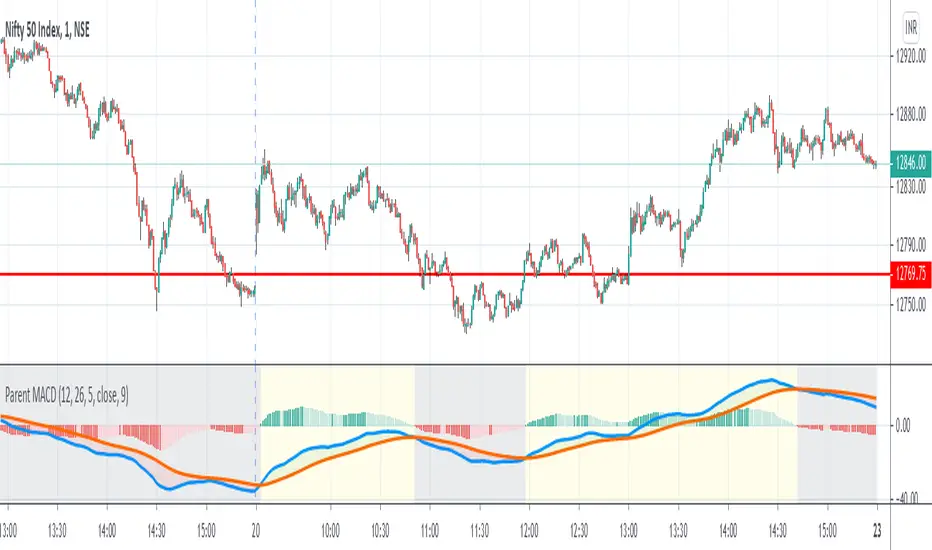
1 Parent MACDWhat is Parent MACD ?
Parent MACD is standard MACD indicator with one additional parameter of Parent. Parent MACD is designed so that you should be able to see cyclical behavior of current trend without having to switch to higher timeframe.
Why You Need This Indicator ?
Technical Analysis is defined as Art of Identifying trend in its early stages and riding on that trend until weight of evidence shows or proves the trend has finally reversed.
Technical Trading is literally 2 step process,
STEP 1 Find Direction of Trend
STEP 2 Trade in Direction of Trend
The direction of trend is taken from higher timeframe (aka parent timeframe) than your trading timeframe. The parent timeframe is 4,5 or 6 times of your trading timeframe if noise is less, if noise is extreme 6,7 or 8 is used as parent. Default Parent in this indicator is 5 and can be modified according to need of trader .
This indicator will tell you that parent timeframe is gaining momentum, if parent is gianing momentum most likely the trading time frame will also gain momentum.
How To Use This Indicator
STEP 1: Select The Time Frame You Want To Trade
STEP 2: Add the indicator on Screen
STEP 3:When you see price gaining momentum add a confirmation indicator to take trade.
Personally I use Profit Max indicator by KivancOzbilgi to confirm trade. If you are planning to use it too, don't forget to say thank you to KivancOzbilgi at in.tradingview.com
Practical Application To Trading
The indicator's most practical application is Option Trading and Trading Assets that trade 24 hours a day.
It can also be used to trade all kind of Index Options.
Indian Index Nifty
Indian Financial Index Nifty Bank
Dow Jones Industrial Average
BTC Index
IMPORTANT : The indicator only helps in trading in direction of Trend by identifying is trend regaining momentum after correction, it doesn't help you identify Trend, you have to identify trend.
Regards,
Nrupen
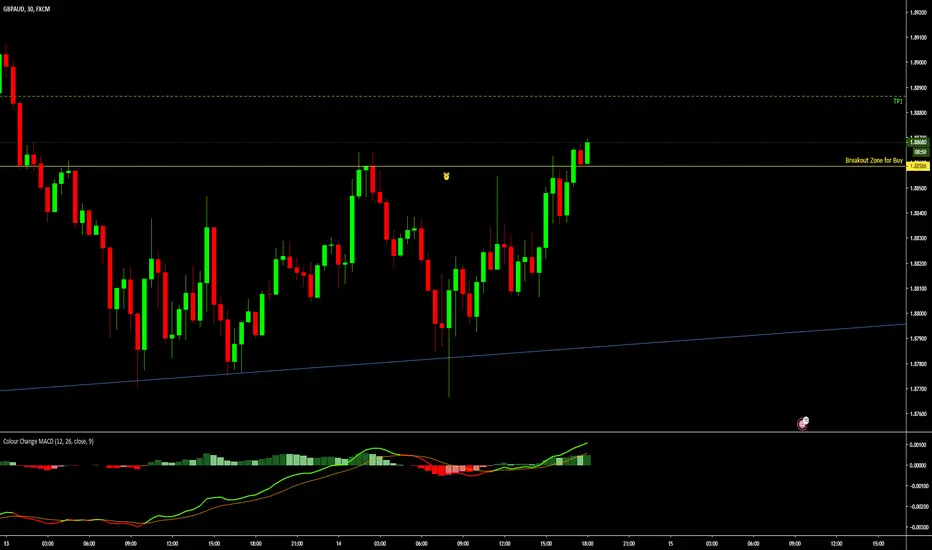
Colour Change MACDTradition MACD but the MACD Line changes colour when it crosses the Signal line
Green indicates a buyers market
Red indicates a seller's market
The ideal time to BUY is when the MACD line is GREEN heading upwards and above or crossing the Histogram
The Ideal time to sell is when the MACD line is RED heading down and Below or crossing from top to bottom of the Histogram
Adjustable MACD AlertNow u can use this script to set A-MACD long/short alert.
If u are curious about the numerical benefits of the settings, you can use the backtest version test.
Here is the backtest version link.

Custom MACDMulti indication MACD , the macd coloring indicates when the trend is aligned with the indicator direction , the macd signal line measure's market sentiment blue for bearish yellow for bullish , the histogram works off rate of change rather then the cross over and color of the histogram indicates possible bull or bear reversal of trend
Multi Color Normalized MACD + Candles (NMACD) [cI8DH]One simple indicator for volatility, divergence and relative momentum
Features:
- Normalized MACD (by slow MA)
- Candle MACD (fast MA length is set to 0 in candle mode, i.e. price minus slow MA)
- Multi color histogram
- Background coloring based on MACD direction
- Choice of different MA types (Exponential, Simple, Weighted, Smoothed, Triple EMA)
- Triple EMA smoothing
Benefits of normalization:
- Absolutely better than RSI for comparing across different periods and assets
Applications and benefits of candle visualization:
- Zero cross: most traders use MAs overlaid on the main chart and look for price distance and MA cross visually. In candle mode, this indicator measures the difference between price and the slow moving MA. When this indicator crosses zero, it means price is crossing the slow moving MA.
- Divergence: full candle visualization (OHLC) is not possible for most other indicators. Candle visualization allows measuring divergence between price high, low and close simultaneously. Some trades incorrectly measure divergence between high, low of price against indicator tops and bottoms while having the indicator input set to default (usually close). With this indicator, you don't need to worry about such complexities.
Recommended setting:
- Enjoy candle mode :)
- Source set to hlc3

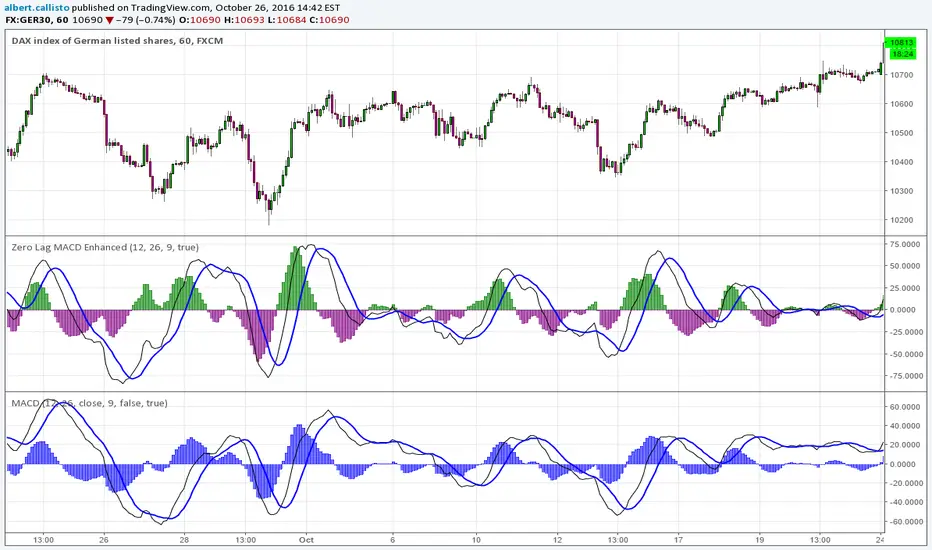
Zero Lag MACD Enhanced - Version 1.0*Zero Lag MACD indicator - Enhanced version 1.0*
Based on ZeroLag EMA - see Technical Analysis of Stocks and Commodities, April 2000
Original version by user Glaz. Thanks ! (see at the end of this description).
Tweaked by Albert Callisto
Displayed components:
Fast and slow "zero lag" moving averages
Histogram showing delta between the two moving averages
You can choose between SMA or EMA for the moving averages. They give slightly different results. Glaz had used SMA instead of EMA. Most "zero MACD" scripts are based upon EMA.
Usage is similar to the classic MACD and it can be integrated in an existing strategy, you will notice the crossing occurs earlier.
This is the original version by Glaz:
SMACD - Standardised MACDStandardised MACD - this uses the MACD indicator, but expressed as a percentage of Close price. This allows for the relative comparison between stocks which have different absolute values. MACD will give a high value to a high priced stock, whereas SMACD will represent stock performance in a standardised format, relative to the closing price of the stock. It effect it represents the MACD as a percentage of share price. An added advantage of SMACD over MACD is that since the indicator is relative to the price, later values are not inflated (assuming rising trend). Thus the scale is not linear, rather it more like a log scale, offering a truer picture of growth over time. It is for this reason the SMACD lines may slightly differ from MACD, but it is a more valid representation in my view. The difference is minor. (Developed by Des Bleakley - Melbourne)

GSC MACD by TejasThis script is based Mr. Saleel Choudhary, GSC Academy MACD Concepts. This indicator is available only for the GSC Students and No one else.
GSC MACD by TejasThis is an indicator based on Mr. Saleel Choudhary, GSC Academy MACD signals. This indicator is only and only available to GSC Students and Nobody else.
BR Cross Swing - MACD HistRawThis strategy looks at the MACD Relationship through the same logic but mainly focuses on breaking things down and the application on raw values.

Sharktank - MACD ExtendedThe MACD, but with added features. Features are:
* Different color schemes.
* Change between different MA types (EMA and SMA) for both the oscillator and the signal MA.
* Show normal bearish and bullish divergence on both the oscillator and the signal MA.
* Show hidden bearish and bullish divergence on both the oscillator MA and the signal MA.
* Change line styles.

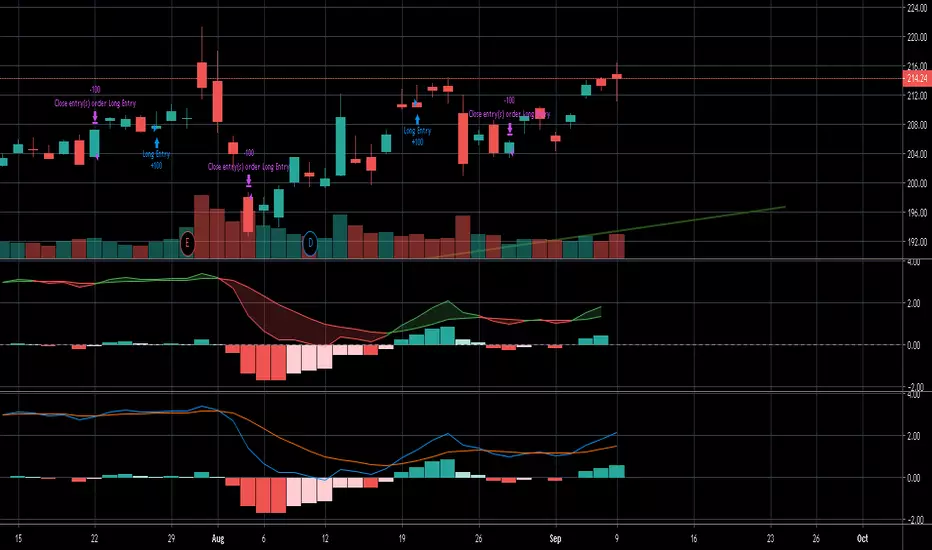
3. AutoBots Trading - BACKTEST: MACDBACKTEST: Moving Average Convergence Divergence - MACD
1. Description: a trend-following momentum indicator that shows the relationship between two moving averages of a security’s price. The MACD is calculated by subtracting the 26-period Exponential Moving Average ( EMA ) from the 12-period EMA .
2. Strategy rules: defined based on the component, signal count, entry prices, open order count, position check, position averages, conditional closes and close signals.
3. Risk management: system was defined based on the choice of only long, only short or both sides. Defining the choice of take profit, stop loss and trailing stos (no repaint).
4. Symbol: PETR4 (only)
5. Suggested Timeframe: 2H
6. Parameter for optimization: 12, 8, 9, side: long, tp: 3%, sl: 1%, ts: na
7. Walk forward simulation
7.1. In sample period: jan/2018-jan/2020
7.2. Out of sample period: jan/2020 - ago/2020
** For purpose educate only


Trading MACD with Relative Vigor indexThis script can be added to the chart and gives Long and close signals on the chart using MACD and RVI indicators.