TradingGroundhog - Strategy & Wavetrend V2#-- Public Strategy - No Repaint - Fractals - Wavetrend --
Here I come with another script, a nice and simple strategy based on fractals and Wavetrends.
#-- Synopsis --
A simple idea, on a small time frame (15 min) we buy when the opening price goes below a Bottom fractals and sell when it goes over a Top fractals, but in order to avoid bad and evil downtrends, we use Wavetrends based on a Daily time frame. From it, Tops and Bottoms are extracted. If the opening price goes above Wavetrend Tops, no trades will be conducted during the day. If the price goes below Wavetrend bottoms, no trades will be executed from 1 to N days, until a new Wavetrend bottom is generated.
I developed the strategy using BTC /EUR 15 MIN BINANCE but it can be applied to many other cryptos, I don't know for forex or others. You can use it for long term and automated trading, I implemented the Wavetrend indicator to do so, or for short term if you have spot a long coming uptrend. Test it, look at its profit and long or short period on your crypto of choice.
#-- Graph reading --
And now, how to read it ?
Wavetrends:
Red Backgrounds are associated to No Trade periods. These periods occur when the price goes below a Wavetrend bottom or above a Wavetrend Top. They are here to limit the loss.
Blue Gradient lines represent the past Tops. For each bar, only the increasing values of the Wavetrend tops are acquired. Going from light to dark blue based on the age of the Tops. Thus, if on line goes from dark to light, this means the price is approaching a previous Wavetrend top. In the opposite, if it darken, thus the price say 'buy buy' and go dropping.
Yellow Gradient lines represent the past Bottoms. They are based on the same principe that the blue lines.
Fractals:
Yellow Flags occur when the opening price goes below a Bottom fractal , it means Buy.
White Flags appear when the opening price goes over a Top fractal , it means Sell.
#-- Parameters --
*** Parameters have been intensively optimized using 10 cryptocurrency markets in order to have potent efficiency for each of them. I would recommend to only change the Can Be touch parameter. For the others, I don't recommend any modifications. The idea behind the script is to be able to switch between markets without having to optimize parameters, less work, easy to target active crypto and therefor limit the risks. ***
Can be touch :
'Combined Smoothness' : The number of open individuals used by the Wavetrend. (6 or 9, often 9 is better but with less volatile crypto it will be 6)
'Filter fractals' : Activate or Disable the filtering fractal operation. If Enable, buy during less risky periods. (Disable is often better)
Can be touch but not necessary :
'VolumeMA' : The Volume corrector used by the fractals
'Extreme window' : The number of price individuals to look for if we want to remove extreme fractals.
Not to touch :
'Limit_candle to look on' : Number of candles to use to compute the Wavetrend Tops and Bottoms.
'Length top bottom drawn' : Size of the lines
'Long Sop Loss (%)' : The minimal difference of price between a Fractal bottom and the opening price to buy.
#-- Time frame --
Should be used with the following time frames depending on the necessity:
1 MIN
3 MIN (Interesting for short term profit, may need some parameter ajustements)
5 MIN
15 MIN (Preferred for long term profit, the script was developed on it)
#-- Last words --
The script can be set up to send Tradingview signals to 3comma just by adding comment = " " in strategy.close_all() and strategy.entry().
Good trades !
Disclaimer (As it should always be one to any script)
***
This script is intended for and only to be used for personal purposes only. No such information provided by it constitutes advice or a recommendation for any investment or trading strategy for any specific person. There is no guarantee presented or implied as to the accuracy of specific forecasts, projections, or predictive statements offered by the script. Users of the script agree that its original developer does not take responsibility for any of your investment decisions. Please seek professional advice before trading.
***
# Here are the results from the 1rst of July 2021 with 100% of equity on the BTC /EUR 15 Min and with a capital of 1 000 EUR.
# As I saw, it goes from +20% to more than +100% depending on the selected crypto. Sometimes it's negative but it's quite rare on crypto using the EUR.
ค้นหาในสคริปต์สำหรับ "implied"

TradingGroundhog - Fundamental Analysis - Multiple RSI Ema(Script Available Version of my previous Fundamental Analysis - Multiple RSI Ema )
As the number of crypto currencies is expanding, we need to find the one which will boom in the next months, weeks or even days.
Therefore, I present to you a Fundamental Analysis tool based on RSI built in order to compare the RSI between the diverse cryptocurrencies.
When cryptocurrencies start to trend, become active, minable and especially "buyable", people are investing their money into them.
As a result,the Daily RSI rises and the price of the crypto in question increases steadily.
With "Fundamental Analysis - Multiple RSI EMA" you can :
Follow up to 20 RSI from different exchanges at the same time.
Find easily Increasing/Decreasing RSI as the lines get transparent if their RSI decrease.
You can also select market with high potential of booming as :
Booming Market : 60 < Daily RSI <= 100 (Strong green background)
Potent Market : 55 < Daily RSI <= 60 (Light green background)
Sleepy Market : 50 < Daily RSI <= 55 (Light red background)
Dying Market : 0 < Daily RSI <= 50 (Strong red background)
Futur booming crypto will go from the Potent Market to the Booming Market
Can be used with the following time frames depending on the necessity:
4H
Daily (Preferred)
Weekly
Monthly
Good trades !
Disclaimer (As it should always be one to any script)
***
This script is intended for and only to be used for personal purposes only. No such information provided by it constitutes advice or a recommendation for any investment or trading strategy for any specific person. There is no guarantee presented or implied as to the accuracy of specific forecasts, projections, or predictive statements offered by the script. Users of the script agree that its original developer does not take responsibility for any of your investment decisions. Please seek professional advice before trading.
***

Realtime 5D Profile [LucF]█ OVERVIEW
This indicator displays a realtime profile that can be configured to visualize five dimensions: volume, price, time, activity and age. For each price level in a bar or timeframe, you can display total or delta volume or ticks. The tick count measures activity on a level. The thickness of each level's line indicates its age, which helps you identify the most recent levels.
█ WARNING
The indicator only works in real time. Contrary to TradingView's line of volume profile indicators , it does not show anything on historical bars or closed markets, and it cannot display volume information if none exists for the data feed the chart is using. A realtime indicator such as this one only displays information accumulated while it is running on a chart. The information it calculates cannot be saved on charts, nor can it be recalculated from historical bars. If you refresh the chart, or the script must re-execute for some reason, as when you change inputs, the accumulated information will be lost.
Because "Realtime 5D Profile" requires time to accumulate information on the chart, it will be most useful to traders working on small timeframes who trade only one instrument and do not frequently change their chart's symbol or timeframe. Traders working on higher timeframes or constantly changing charts will be better served by TradingView's volume profiles. Before using this indicator, please see the "Limitations" section further down for other important information.
█ HOW TO USE IT
Load the indicator on an active chart (see here if you don't know how).
The default configuration displays:
• A double-sided volume profile showing at what price levels activity has occurred.
• The left side shows "down" volume, the right side shows "up" volume.
• The value corresponding to each level is displayed.
• The width of lines reflects their relative value.
• The thickness of lines reflects their age. Four thicknesses are used, with the thicker lines being the most recent.
• The total value of down/up values for the profile appears at the top.
To understand how to use profiles in your trading, please research the subject. Searches on "volume profile" or "market profile" will yield many useful results. I provide you with tools — I do not teach trading. To understand more about this indicator, read on. If you choose not to do so, please don't ask me to answer questions that are already answered here, nor to make videos; I don't.
█ CONCEPTS
Delta calculations
Volume is slotted in up or down slots depending on whether the price of each new chart update is higher or lower than the previous update's price. When price does not move between chart updates, the last known direction is used. In a perfect world, Pine scripts would have access to bid and ask levels, as this would allow us to know for sure if market orders are being filled on upticks (at the ask) or downticks (at the bid). Comparing the price of successive chart updates provides the most precise way to calculate volume delta on TradingView, but it is still a compromise. Order books are in constant movement; in some cases, order cancellations can cause sudden movements of both the bid and ask levels such that the next chart update can occur on an uptick at a lower price than the previous one (or vice versa). While this update's volume should be slotted in the up slot because a buy market order was filled, it will erroneously be slotted in the down slot because the price of the chart's update is lower than that of the previous one. Luckily, these conditions are relatively rare, so they should not adversely affect calculations.
Levels
A profile is a tool that displays information organized by price levels. You can select the maximum quantity of levels this indicator displays by using the script's "Levels" input. If the profile's height is small enough for level increments to be less than the symbol's tick size, a smaller quantity of levels is used until the profile's height grows sufficiently to allow your specified quantity of levels to be displayed. The exact position of levels is not tethered to the symbol's tick increments. Activity for one level is that which happens on either side of the level, halfway between its higher or lower levels. The lowest/highest levels in the profile thus appear higher/lower than the profile's low/high limits, which are determined by the lowest/highest points reached by price during the profile's life.
Level Values and Length
The profile's vertical structure is dynamic. As the profile's height changes with the price range, it is rebalanced and the price points of its levels may be recalculated. When this happens, past updates will be redistributed among the new profile's levels, and the level values may thus change. The new levels where updates are slotted will of course always be near past ones, but keep this fluidity in mind when watching level values evolve.
The profile's horizontal structure is also dynamic. The maximum length of level lines is controlled by the "Maximum line length" input value. This maximum length is always used for the largest level value in the profile, and the length of other levels is determined by their value relative to that maximum.
Updates vs Ticks
Strictly speaking, a tick is the record of a transaction between two parties. On TradingView, these are detected on seconds charts. On other charts, ticks are aggregated to form a chart update . I use the broader "update" term when it names both events. Note that, confusingly, tick is also used to name an instrument's minimal price increment.
Volume Quality
If you use volume, it's important to understand its nature and quality, as it varies with sectors and instruments. My Volume X-ray indicator is one way you can appraise the quality of an instrument's intraday volume.
█ FEATURES
Double-Sided Profiles
When you choose one of the first two configuration selections in the "Configuration" field's dropdown menu, you are asking the indicator to display a double-sided profile, i.e., where the down values appear on the left and the up ones on the right. In this mode, the formatting options in the top section of inputs apply to both sides of the profile.
Single-Sided Profiles
The six other selections down the "Configuration" field's dropdown menu select single-sided profiles, where one side aggregates the up/down values for either volume or ticks. In this mode, the formatting options in the top section of inputs apply to the left profile. The ones in the following "Right format" section apply to the right profile.
Calculation Mode
The "Calculation" input field allows the selection of one of two modes which applies to single-sided profiles only. Values can represent the simple total of volume or ticks at each level, or their delta. The mode has no effect when a double-sided profile is used because then, the total is represented by the sum of the left and right sides. Note that when totals are selected, all levels appear in the up color.
Age
The age of each level is always displayed as one of four line thicknesses. Thicker lines are used for the youngest levels. The age of levels is determined by averaging the times of the updates composing that level. When viewing double-sided profiles, the age of each side is calculated independently, which entails you can have a down level on the left side of the profile appear thinner than its corresponding up side level line on the right side because the updates composing the up side are more recent. When calculating the age of single-sided profiles, the age of the up/down values aggregated to calculate the side are averaged. Since they may be different, the averaged level ages will not be as responsive as when using a double-sided profile configuration, where the age of levels on each side is calculated independently and follows price action more closely. Moreover, when displaying two single-sided profiles (volume on one side and ticks on the other), the age of both sides will match because they are calculated from the same realtime updates.
Profile Resets
The profile can reset on timeframes or trend changes. The usual timeframe selections are available, including the chart's, in which case the profile will reset on each new chart bar. One of two trend detection logics can be used: Supertrend or the one used by LazyBear in his Weis Wave indicator . Settings for the trend logics are in the bottommost section of the inputs, where you can also control the display of trend changes and states. Note that the "Timeframe" field's setting also applies to the trend detection mechanism. Whatever the timeframe used for trend detection, its logic will not repaint.
Format
Formatting a profile for charts is often a challenge for traders, and this one is no exception. Varying zoom factors on your chart and the frequency of profile resets will require different profile formats. You can achieve a reasonable variety of effects by playing with the following input fields:
• "Resets on" controls how frequently new profiles are drawn. Spacing out profiles between bars can help make them more usable.
• "Levels" determines the maximum quantity of levels displayed.
• "Offset" allows you to shift the profile horizontally.
• "Profile size" affects the global size of the profile.
• Another "Size" field provides control over the size of the totals displayed above the profile.
• "Maximum line length" controls how far away from the center of the bar the lines will stretch left and right.
Colors
The color and brightness of levels and totals always allows you to determine the winning side between up and down values. On double-sided profiles, each side is always of one color, since the left side is down values and the right side, up values. However, the losing side is colored with half its brightness, so the emphasis is put on the winning side. When there is no winner, the toned-down version of each color is used for both sides. Single-sided profiles use the up and down colors in full brightness on the same side. Which one is used reflects the winning side.
Candles
The indicator can color candle bodies and borders independently. If you choose to do so, you may want to disable the chart's bars by using the eye icon near the symbol's name.
Tooltips
A tooltip showing the value of each level is available. If they do not appear when hovering over levels, select the indicator by clicking on its chart name. This should get the tooltips working.
Data Window
As usual, I provide key values in the Data Window, so you can track them. If you compare total realtime volumes for the profile and the built-in "Volume" indicator, you may see variations at some points. They are due to the different mechanisms running each program. In my experience, the values from the built-in don't always update as often as those of the profile, but they eventually catch up.
█ LIMITATIONS
• The levels do not appear exactly at the position they are calculated. They are positioned slightly lower than their actual price levels.
• Drawing a 20-level double-sided profile with totals requires 42 labels. The script will only display the last 500 labels,
so the number of levels you choose affects how many past profiles will remain visible.
• The script is quite taxing, which will sometimes make the chart's tab less responsive.
• When you first load the indicator on a chart, it will begin calculating from that moment; it will not take into account prior chart activity.
• If you let the script run long enough when using profile reset criteria that make profiles last for a long time, the script will eventually run out of memory,
as it will be tracking unmanageable amounts of chart updates. I don't know the exact quantity of updates that will cause this,
but the script can handle upwards of 60K updates per profile, which should last 1D except on the most active markets. You can follow the number of updates in the Data Window.
• The indicator's nature makes it more useful at very small timeframes, typically in the sub 15min realm.
• The Weis Wave trend detection used here has nothing to do with how David Weis detects trend changes.
LazyBear's version was a port of a port, so we are a few generations removed from the Weis technique, which uses reversals by a price unit.
I believe the version used here is useful nonetheless because it complements Supertrend rather well.
█ NOTES
The aggregated view that volume and tick profiles calculate for traders is a good example of one of the most useful things software can do for traders: look at things from a methodical, mathematical perspective, and present results in a meaningful way. Profiles are powerful because, if the volume data they use is of good enough quality, they tell us what levels are important for traders, regardless of the nature or rationality of the methods traders have used to determine those levels. Profiles don't care whether traders use the news, fundamentals, Fib numbers, pivots, or the phases of the moon to find "their" levels. They don't attempt to forecast or explain markets. They show us real stuff containing zero uncertainty, i.e., what HAS happened. I like this.
The indicator's "VPAA" chart name represents four of the five dimensions the indicator displays: volume, price, activity and age. The time dimension is implied by the fact it's a profile — and I couldn't find a proper place for a "T" in there )
I have not included alerts in the script. I may do so in the future.
For the moment, I have no plans to write a profile indicator that works on historical bars. TradingView's volume profiles already do that, and they run much faster than Pine versions could, so I don't see the point in spending efforts on a poor ersatz.
For Pine Coders
• The script uses labels that draw varying quantities of characters to break the limitation constraining other Pine plots/lines to bar boundaries.
• The code's structure was optimized for performance. When it was feasible, global arrays, "input" and other variables were used from functions,
sacrificing function readability and portability for speed. Code was also repeated in some places, to avoid the overhead of frequent function calls in high-traffic areas.
• I wrote my script using the revised recommendations in the Style Guide from the Pine v5 User Manual.
█ THANKS
• To Duyck for his function that sorts an array while keeping it in synch with another array.
The `sortTwoArrays()` function in my script is derived from the Pine Wizard 's code.
• To the one and only Maestro, RicardoSantos , the creative volcano who worked hard to write a function to produce fixed-width, figure space-padded numeric values.
A change in design made the function unnecessary in this script, but I am grateful to you nonetheless.
• To midtownskr8guy , another Pine Wizard who is also a wizard with colors. I use the colors from his Pine Color Magic and Chart Theme Simulator constantly.
• Finally, thanks to users of my earlier "Delta Volume" scripts. Comments and discussions with them encouraged me to persist in figuring out how to achieve what this indicator does.

Fundamental Analysis - Multiple RSI EMAAs the number of crypto currencies is expanding, we need to find the one which will boom in the next months, weeks or even days.
Therefore, I present to you a Fundamental Analysis tool based on RSI built in order to compare the RSI between the diverse cryptocurrencies.
When cryptocurrencies start to trend, become active, minable and especially "buyable", people are investing their money into them.
As a result,the Daily RSI rises and the price of the crypto in question increases steadily.
With "Fundamental Analysis - Multiple RSI EMA" you can :
Follow up to 20 RSI from different exchanges at the same time.
Find easily Increasing/Decreasing RSI as the lines get transparent if their RSI decrease.
You can also select market with high potential of booming as :
Booming Market : 60 < Daily RSI <= 100 (Strong green background)
Potent Market : 55 < Daily RSI <= 60 (Light green background)
Sleepy Market : 50 < Daily RSI <= 55 (Light red background)
Dying Market : 0 < Daily RSI <= 50 (Strong red background)
Futur booming crypto will go from the Potent Market to the Booming Market
Can be used with the following time frames depending on the necessity:
4H
Daily (Preferred)
Weekly
Monthly
Good trades !
Disclaimer (As it should always be one to any script)
***
This script is intended for and only to be used for personal purposes only. No such information provided by it constitutes advice or a recommendation for any investment or trading strategy for any specific person. There is no guarantee presented or implied as to the accuracy of specific forecasts, projections, or predictive statements offered by the script. Users of the script agree that its original developer does not take responsibility for any of your investment decisions. Please seek professional advice before trading.
***

ORB with Shorty Targets
The ORBS indicator study utilizes the theory of an Opening Range Breakout occurring on a security. The indicator uses data collected from the first thirty minute session of the trading day to create fibonacci retracements at specific positions. The 'session' high and low are derived from the first thirty minutes and used as a basis to plot these values. Fibonacci retracement lines are plotted at key positions above and below the high/low values pulled during the opening 'session'. These fibonacci retracement lines are plotted at: 0 (ORB high); 1.272; 1.618; 2.00; 2.175; 2.618; and 3.236. Levels in-between these values are known as 'ranges'. Upper lines are shown green in color and indicate key levels at which the price may react within the market. No guarantees are given nor implied - ORBs is simply a tool to help plot out key fibonacci levels at specific levels accurately and completely.
This will only work on 3min or 5mins and it is intended for intraday trading only.
ORH - opening range high
ORL - opening range low
OR50% - mid between ORH and ORL aka 50% fib
The way i use ORBS:
1. ORH break - i go long on 3min or 5 min close above ORH. I use heiken-ashi candles.
2. ORL breal - i will short on 3min or 5 min close below ORL
3. Double bottoms on reclaims of ORL - i will go long with SL being the ORL
4. Double tops on ORH considering market is weak i will short with SL being the ORH
Trendbar:
Trendbar use combo of CCI and ATR to help figure out the trend the stock is in. Stock moving below the trendbar indicates it is loosing the trend dependent on what time-frame you are using it.
Pivots:
Shorty Pivots are a collection of daily/weekly/ monthly pivots indicator that allows for plotting a daily, weekly, and monthly line on a chart. The values are pulled from the three separate resolutions (daily, weekly, and monthly), and shown on the chart each day. Calculations pulled from each respective high/low/close (divided by 3.0) for the session values.
Settings:
Show Daily/Weekly/Monthly Pivot - Shows/Hides each respective pivot .
Pivot Colors - Change the color of each pivot .
Pivot Width - Line width of the plotted pivot .
Line Style - Choose Solid, Dashed, or Dotted to view different styled lines.
Label Text Color - Choose the label text color if it clashes with your chosen line color(s).
Extend Pivot Lines to Right Offset: This allws you to extend each pivot line to the right by an offset of X bars.
Day Session Timeframe - Ignore this setting.
Pivot Adjustment Timeframe - Ignore this setting.

Kaufman's Efficiency Ratio Strategy [KL]I recently published an indicator called "Kaufman's Efficiency Ratio Indicator". In the description of that script, I hypothesized about how the Efficiency Ratio could be applied to identify bullish moves in instances where price had already gone up steeply, but rests for a while, allowing for entry in expectation that price will continually rise. I decided to test out this idea with Pinescript.
About Kaufman's Efficiency Ratio ("ER")
ER was developed by a systematic trader by the name of Perry J. Kaufman.
Formula
The formula is:
= A divided by B,
where:
A = Current closing price minus the closing price at the start of the lookback period
B = Sum of differences between closing prices (in absolute terms) of consecutive bars over the lookback period
How this strategy enters a trade (Long):
- code: entry_signal_long = ER > 0 and ER_is_mid
- meaning: when ER is positive, strategy assumes price has risen. Usually ER value begins high (red), and unless it is a false move, then it should stay positive. This strategy will patiently wait until ER drops to medium (yellow), and then place a trade.
- how low/medium/high is dynamically determined: Refer to the description of my other script("Kaufman's Efficiency Ratio Indicator") for details. Trying to keep this as short as possible.
How this strategy exits a trade (Long):
- when price hits stop limit; stop limit is based on low of bars, trails upward based on ATR
- included a feature called "tightening TSL", which tries to reduce the stop-buffer during periods of high volatility implied by ER (very experimental, opening the floor for suggestions on how this can be improved)

Hophop Reversion Strategy
█ OVERVIEW
Mean reversion is a financial term assuming that an asset's price will tend to converge to the average price over time.
Due to the trending nature of the crypto markets, mean reversion on a high timeframe could be pretty dangerous. When it comes to running mean reversion strategy on low timeframe, commission and slippage may cost more than strategy gains.
In this strategy, I tried to achieve being conservative in the trending market while avoiding trades if necessary and trading high probability reversion opportunities .
█ CONCEPTS
Strategy is build based on the combination of the momentum and the historical / implied volatility; when the price exceeds the potential volatility range, the strategy places the orders, and the target point is the mean of the expected range high and range low.
The range low and high lines displayed on the chart shows where to short or long, to make sure that the orders are limit orders; orders are placed 0.5% above/below the ranges!
Key information about the strategy
• All the orders are limit entry
• 0.02% commission is included in the backtest
• 30 ticks set for Verify Price Limit for Orders
• 30 ticks set for Slippage
• Initial version does not include the money management and hard stops hence you need to be extra cautious in trending markets
• Restricted to be used for BTC and ETH for 15 min timeframe
█ Ozet
Ortalamaya dönme, bir varlığın fiyatının zaman içinde ortalama fiyata yakınsama eğiliminde olacağını varsayan bir finansal terimdir.
Kripto piyasalarının trend egilimli doğası nedeniyle, yüksek zaman diliminde ortalamaya dönüş oldukça tehlikeli olabilir.
Ortalama geri dönüş stratejisini düşük zaman diliminde calistirmak söz konusu olduğunda, komisyon ve kayma, strateji kazanımlarından daha pahalıya mal olabilir.
Bu stratejide, gerektiğinde alım satımlardan kaçınırken ve yüksek olasılıklı ortalamaya dönüş fırsatlarını degerlendiren, trend olan piyasada ise isleme girerken temkinli olmasi uzerine calistim
█ Aciklama
Strateji, momentum ve tarihsel / zımni oynaklığın birleşimine dayalı olarak inşa edilmistir; fiyat potansiyel oynaklık aralığını aştığında, strateji emirleri verir ve hedef nokta, beklenen yüksek aralığın ve düşük aralığın ortalamasıdır.
Grafikte görüntülenen aralık alt ve üst satırları,
Stratejiye ait onemli bilgiler/b]
• Tüm emirler limit emirdir girişlidir
• Backtest performansinda %0.02 komisyon dahildir
• Limit Emir fiyat dogrulamasi icin 30 tick bekleme kullanilmistir
• Slippage için 30 tick bekleme kullanilmistir
• İlk sürüm para yönetimini ve stoploss içermez, bu nedenle trend olan piyasalarda ekstra dikkatli olmanız gerekir.
• 15 dakikalık zaman dilimi ile BTC ve ETH için kullanımla sınırlıdır
Emirlerin limit emir olduğundan emin olmak için nerede short veya long isleme girilecegini gosteren cizgilerin %0.5 üstünde/altında verilir!

CryptoSignalScanner - MACD Multiple Time FramesDESCRIPTION:
After receiving some multiple request to provide a MACD indicator that displays multiple timeframes at the same time I created this simple script.
You can use this script for free and adjust it as much you like.
With this script you can plot 6 MACD lines & 6 Signal lines.
• Current Timeframe MACD Line
• Current Timeframe Signal Line
• 15 minute candle MACD Line
• 15 minute candle Signal Line
• 30 minute candle MACD Line
• 30 minute candle Signal Line
• 1 hour candle MACD Line
• 1 hour candle Signal Line
• 2 hour candle MACD Line
• 2 hour candle Signal Line
• 4 hour candle MACD Line
• 4 hour candle Signal Line
HOW TO USE:
• When multiple MACD lines on an uptrend are grouped together it is time to SELL.
• When multiple MACD lines on a downtrend are grouped together it is time to BUY.
• The higher to length of the MACD lines the stronger the BUY/SELL signal.
FEATURES:
• You can show/hide the preferred MACD lines.
• You can show/hide the preferred Signal lines.
How MACD works
The MACD indicator is generated by subtracting two exponential moving averages (EMAs) to create the main line (MACD line), which is then used to calculate another EMA that represents the signal line. In addition, there is the MACD histogram, which is calculated based on the differences between those two lines. The histogram, along with the other two lines, fluctuates above and below a center line, which is also known as the zero line.
The MACD indicator consists of three elements moving around the zero line:
• The MACD line. By default the MACD line is calculated by subtracting the 26-day EMA from the 12-day EMA.
MACD line = 12d EMA - 26d EMA
• The signal line. By default the signal line is calculated from a 9-day EMA of the MACD line.
Signal line = 9d EMA of MACD line
• Histogram. The histogram is nothing more than a visual record of the relative movements of the MACD line and the signal line.
It is simply calculated as: MACD line - signal line
REMARKS:
• This advice is NOT financial advice.
• We do not provide personal investment advice and we are not a qualified licensed investment advisor.
• All information found here, including any ideas, opinions, views, predictions, forecasts, commentaries, suggestions, or stock picks, expressed or implied herein, are for informational, entertainment or educational purposes only and should not be construed as personal investment advice.
• We will not and cannot be held liable for any actions you take as a result of anything you read here.
• We only provide this information to help you make a better decision.
• While the information provided is believed to be accurate, it may include errors or inaccuracies.
Good Luck,
SEOCO

Volume using Candle RangeAnother way of finding out a rough estimate of the volume or how much bulls or bears were in control using only the range of the candlesticks in relation to the closing price. If the close is in the higher range zone then the volume is said to have been positive, if the close is in the lower range zone then the volume is said to have been negative. The close is compared to the midpoint of the candle to see how far from the midpoint the close was.
The columns bars show how far each candlestick's close price is to the midpoint of its high and low. It's possible for the column bar to be a different color than the candlestick itself if the close was above or below the midpoint. An average line is shown that takes the average of a given length amount of column bars. There is an option to show the absolute value only of the columns and the average line.
This is based on an idea I found about candlestick range bars implying volume. This is an attempt to put that theory into practice and to see if there's any truth to it. It's not exactly volume and may not always look like it, and it does not show how many trades took place but instead tries to use price in relation to the high and low range.

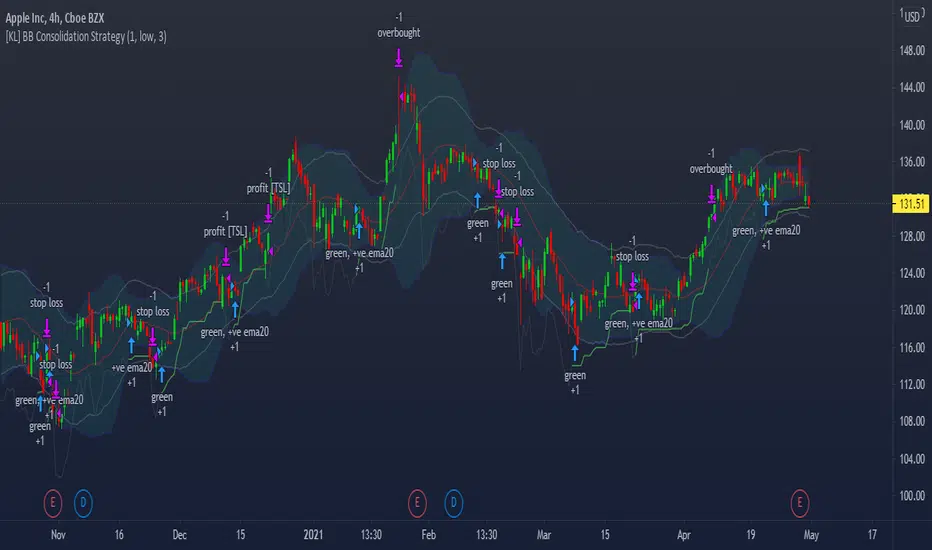
[KL] Bollinger Bands Consolidation StrategyThis strategy will enter into long position based on the volatility of prices implied by indicators of (a) Bollinger bands, and (b) ATR.
Application of Bollinger bands ("BOLL")
Using plain vanilla settings for BOLL (i.e. 20 period moving average, and 2 standard deviations of closing prices), we are interested to know about the shape of the area that is bounded by the upper and lower bands.
In theory, consolidation happens when volatility of price decreases. Visually speaking, this is represented by the narrowing of the upper/lower bands. This strategy considers the narrowing of BOLL bands as the primary indicator for long-entry.
Application of ATRs (as confirmations)
Firstly, to confirm that BOLL bands are narrowing (as mentioned above), the ATR at a potential point of entry is compared against the standard deviation of prices over BOLL's lookback periods. Once again, visualizing the shape of BOLL bands during consolidation, we assume the lines begin to squeeze when the distance between the center line and upper/lower band is less than two current ATRs.
Secondly, this strategy looks into the moving average of ATRs to assure that prices are not too choppy when entering into market. If the moving average of ATR decreases at a point in time such that all the above conditions are met, then we can assert that the volatility of price is decreasing.
Thirdly, ATR is used for determining the size of our trailing stop loss. We will keep the multiplier fixed at two.
MOVE/VXTLT CorrelationMany know of the VIX for equity trading. Yet, many are unaware that there is the same kind of volatility measure for trading bonds, called the MOVE Index.
"The Merrill Lynch Option Volatility Estimate (MOVE) Index is a yield curve weighted index of the normalized implied volatility on 1-month Treasury options which are weighted on the 2, 5, 10, and 30 year contracts."
With this script one can see the the correlation and divergences between bonds and its volatility measure to make educated decisions in trading or hedging.
The idea of this script comes from NicTheMajestic.

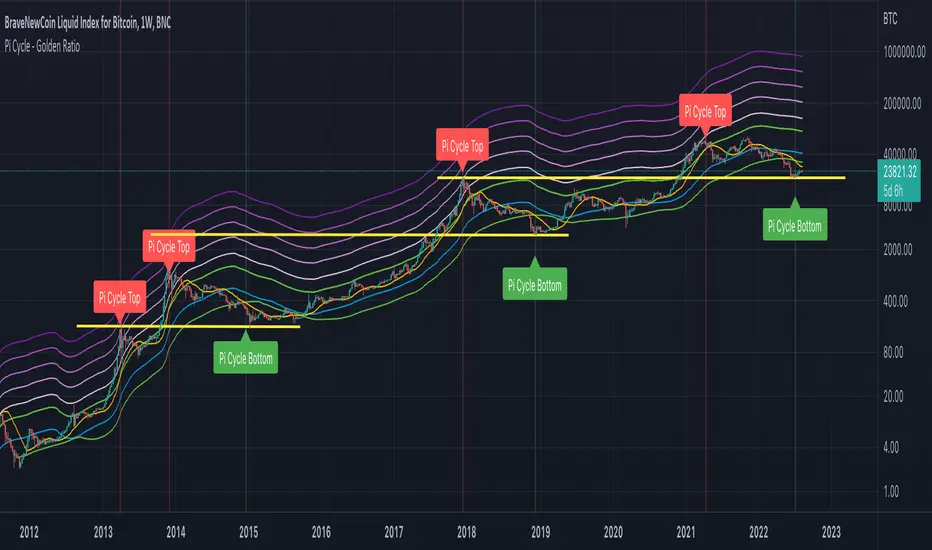
CryptoSignalScanner - Pi Cycle - Golden Ratio MultiplierDESCRIPTION:
All credits are going to Philip Swift who has written an article on Medium about the PI Cycle Top and The Golden Ratio Multiplier .
Based on the article this indicator has been created to display and indicate the Bitcoin PI Cycle Top which has historically been effective in picking out the market cycle highs within 3 days. It also displays the Golden Ratio Multiplier which explores Bitcoin's adoption curve and market cycles.
• The PI Cycle Top is based on the 350DMA (Daily Moving Average) multiplied by 2 and the 111DMA (Daily Moving Average)
• The Golden Ratio Multiplier is based on the 350DMA (Daily Moving Average) the The Golden Ratio which is defines as 350DMA * 1.61803398875 and the Fibonacci Sequence which is defined as 350DMA * 2, 350DMA * 3, 350DMA * 5, 350DMA * 8, 350DMA * 13 and 350DMA * 21
HOW TO USE:
• The PI Cycle Top is picking the market cycle tops within 3 days.
When the 350DMA x2 crosses below the 111DMA Bitcoin price peaks in its market cycle. This indicates that the market is overbought and it is time to take profit.
• The Golden Ratio Multiplier pics the top on every market cycle in Bitcoin’s history and forecasts when Bitcoin will top in the coming market cycle.
In 2011 the top was at 350DMA * 21
In 2013 the top was at 350DMA * 13
In 2014 the top was at 350DMA * 8
In 2018 the top was at 350DMA * 5
If we look at the results above the forecast for next top should be at 350DMA * 3
FEATURES:
• You can change the Long Moving Average which is by default 350
• You can change the Short Moving Average which is by default 111
• You can show/hide the Pi Cycle Top labels
• You can show/hide the Pi Cycle Bottom labels
• You can show/hide the Pi Cycle Moving Averages
• You can show/hide the Golden Ratio
• You can show/hide the Fibonacci Sequence
• You can set an alert when the Pi Cycle Top is reached
REMARKS:
• This advice is NOT financial advice.
• We do not provide personal investment advice and we are not a qualified licensed investment advisor.
• All information found here, including any ideas, opinions, views, predictions, forecasts, commentaries, suggestions, or stock picks, expressed or implied herein, are for informational, entertainment or educational purposes only and should not be construed as personal investment advice.
• We will not and cannot be held liable for any actions you take as a result of anything you read here.
• We only provide this information to help you make a better decision.
• While the information provided is believed to be accurate, it may include errors or inaccuracies.
HOW TO GET ACCESS TO THE SCRIPT:
• Access to this script is free of charge
• You can drop me a message to get access to the script
Good Luck,
SEOCO
GBTC holdings USD market valueThis script estimates GBTC bitcoins per share, rather than hardcoding as in other scripts. Its result is an estimate of GBTC holdings USD market value.
Per share bitcoin estimates are adjusted by 2.0% / 365 per day from 2019 year end holdings. Calendar year 2019 ending bitcoins and shares were 261,192 bitcoins and 269,445,300 shares. From the 2019 Form 10-K: 'The Trust’s only ordinary recurring expense is the Sponsor’s Fee. The Sponsor’s Fee accrues daily in U.S. dollars at an annual rate of 2.0% of the Bitcoin Holdings.. The Sponsor’s Fee is payable in Bitcoins to the Sponsor monthly in arrears.'
No attempt is made to account for leap years.
Per share bitcoin estimate is converted to USD market value by multiplying by the simple average BTCUSD price at Coinbase and Bitstamp. Grayscale uses the TradeBlock XBX index, a volume weighted average of Coinbase Pro, Kraken, LMAX Digital and Bitstamp prices.
Spot checks vs archive.org captures of daily bitcoins per share and the chart on Grayscale's site:
The estimate for market close January 22 2021 is 0.00094899 bitcoins per share, the published datum on Grayscale's web site was 0.00094898. The estimate matches at 20:30 rather than at 16:00.
The estimate for December 31 2018 is 0.000988965 vs a published 0.00098895.
The estimate for December 29 2017 market value is $14.58 vs $14.65.
The estimate for December 30 2016 market value is $0.99 vs $0.98.
The estimate for January 4 2016 market value is $0.46 vs $0.45.
No estimates before 2016.
The default style is to draw a blue line with two thirds transparency outside market hours and for first/last minutes of trading, switching to daily or greater periodicity hides this.
No warranty is expressed or implied , I am not a lawyer, etc etc etc.
This is not investing advice . Always do your own due diligence .

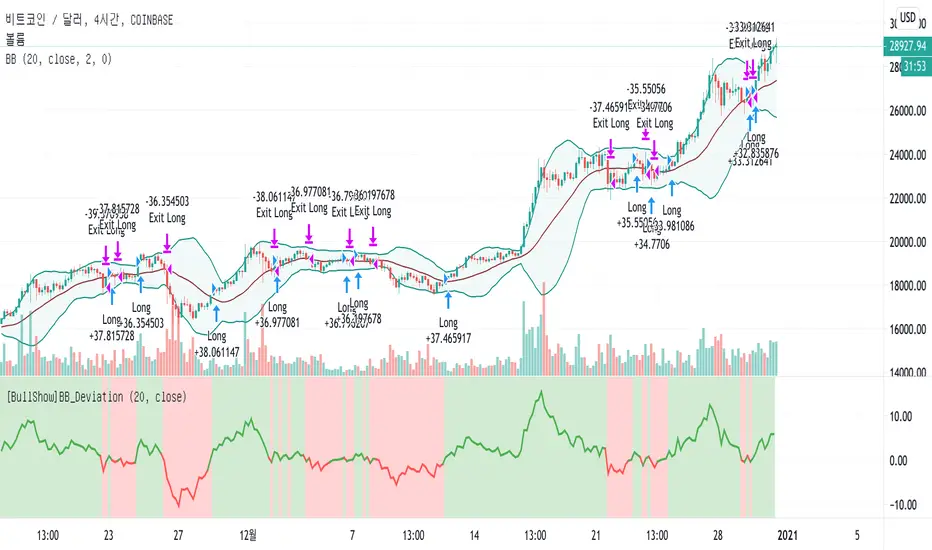
[BullShow]BollingerBands_Deviation StrategyHello Everyone.
Are you enjoying this crazy bull market?
I want to Introduce very classic and simple but powerful strategy.
My strategy is using Bollinger Bands. Yes! It's the indicator that everyone knows and uses.
First of all, let's look at how Wikipedia defines the Bollinger Bands.
Bollinger Bands - Wikipedia
------------
Introduce
Bollinger Bands (/ˈbɒlɪnjdʒər bændz/) are a type of statistical chart characterizing the prices and volatility over time of a financial instrument or commodity, using a formulaic method propounded by John Bollinger in the 1980s.
Purpose
The purpose of Bollinger Bands is to provide a relative definition of high and low prices of a market. By definition, prices are high at the upper band and low at the lower band. This definition can aid in rigorous pattern recognition and is useful in comparing price action to the action of indicators to arrive at systematic trading decisions.
Interpretation
The use of Bollinger Bands varies widely among traders. Some traders buy when price touches the lower Bollinger Band and exit when price touches the moving average in the center of the bands. Other traders buy when price breaks above the upper Bollinger Band or sell when price falls below the lower Bollinger Band. Moreover, the use of Bollinger Bands is not confined to stock traders; options traders, most notably implied volatility traders, often sell options when Bollinger Bands are historically far apart or buy options when the Bollinger Bands are historically close together, in both instances, expecting volatility to revert towards the average historical volatility level for the stock.
------------
However, the use of the Bollinger Bands described on the website is only very abstract without precise guidelines.
So, by calculating the deviation of the 20-days moving average line, the center line of the Bollinger Bands, I chose a strategy to buy when the deviation starts to widen and sell when the separation starts to narrow again.
As a result, I found a strategy that would give you a decent return.
Due to the nature of the strategy, trades in the box zone are frequent, so the win rate is small, but when the price trend is confirmed, you can get a big profit.
Therefore, you can expect good returns from pair with a clear trend rather than pair that trade frequently in the box zone.
If you are interested in my strategy, Use the link below to obtain access to this indicator or PM me to obtain access
Thank you for your supporting.
안녕하세요 여러분.
이 미친 강세장을 즐기고 있습니까?
매우 고전적이고 단순하지만 강력한 전략을 소개하고 싶습니다.
제 전략은 볼린저 밴드를 사용하는 것입니다. 예! 모두가 알고 사용하는 그 지표입니다.
그러나 웹에서 설명하는 사용 방법은 정확한 지침없이 매우 추상적 일 뿐입니다.
따라서 저는 볼린저 밴드의 중심선 인 20 일 이동 평균선의 편차를 계산하여 편차가 확대되기 시작하면 매수하고 편차가 다시 좁아지기 시작하면 매도하는 전략을 선택했습니다.
결과적으로, 나는 당신에게 적절한 수익을 줄 전략을 찾았습니다.
전략의 특성상 박스 존에서의 거래가 빈번해 승률은 적지 만 가격 추세가 확인되면 큰 수익을 얻을 수 있습니다.
따라서 박스 존에서 자주 거래되는 패어보다는 명확한 추세의 패어에서 좋은 수익을 기대할 수 있습니다.
전략에 관심이 있으시거나 사용을 원하신다면 아래를 참고 해 주시거나 PM을 보내주세요.
감사합니다.
Back Testing
*initial_capital: $10000
*default_qty_value: 100%
*commission_value: 0.1%
*Period: 2017.01.01~
Profit
BTCUSD: 3109%
ETHUSD: 11160%
YFIUSDT: 823.88%
ZILUSDT: 570.84%
BNBUSDT: 937.18%
LINKUSDT: 471.41%
*Due to the nature of the strategy, a pair with a strong trend yields better results.
*전략 특성상 추세가 강한 패어에서 더 좋은 결과를 도출합니다.
*Optimized for a 4 hour time frame and a 12 hour time frame.
*4 시간 시간 프레임과 12 시간 시간 프레임에 최적화되었습니다.
[Steve Woods Float Analysis ] Volume Float Indicator This Indicator is developed as mentioned in Steve Woods Book
"Float Analysis, Powerful technical Indicators using Price and Volume"
Overview
Float analysis is a holistic approach to studying the technical behavior
of stocks. By this I mean it treats the shares actually being traded as equal in importance to price and volume activity. Thus, price and volume are seen as only two-thirds of the picture, with the number of shares actually traded being the final third that completes the picture. The power of looking at stocks this way is that it demonstrates a direct relationship between the volume of shares traded in the past and subsequent future movements in price. Thus, float analysis is a powerful tool to predict future stock price movements. In addition, by studying stocks holistically, float analysis expands and clarifies the definition of several technical terms. These include bottoms and tops, support and resistance, and accumulation and distribution.
Float analysis also allows us to create a model of price, volume, and tradeable shares activity. As a model it does not claim to be the “truth” of all stock price and volume activity. It is, of course, just one point of view among many. But like any valid model, it has the ring of truth; and to all who listen, float analysis rings rather loudly. Its appeal as a model of stock behavior is three- fold. First, it is based on several discoveries that are easy to understand. Second, it is backed up by hard data. And third, it makes common sense.
The first and most important discovery, made in 1993, is a simple concept with profound implications. In order to understand this discovery, we need to know two key terms: float and float turnover. The float is well known to knowledgeable market players. I coined the term float turnover to explain the discovery.
The Float
Any given stock has only a certain number of shares that are actually avail- able for trading. These freely traded shares in the hands of the public are called the float, a shortened version of the floating supply of shares. For big companies, like Intel or Microsoft, the number can be over a billion shares. For a small, obscure company, it may be a few hundred thousand. But every company has a specific number of shares that is actually traded by the pub- lic. The float should not be confused with the shares outstanding, which includes both the floating supply of shares and those shares held tightly by the company’s management. The float number for any given company can change periodically; the management might issue more shares, they might sell their shares, or the shares might go through a stock split. The number of shares in a company’s float is not a secret. It is a publicly accessible from a number of sources
A Float Turnover
A float turnover is the amount of time it takes for a number of shares to trade that cumulatively corresponds with the number of shares in the stock’s float. For example, if a company’s float has 100 million shares that are actively trading and the total cumulative volume of shares traded over the last year was 100 million shares, then a single float turnover would be a one-year span starting from the current date and going back to the day when the cumulative total of the volume equaled 100 million shares. In other words, all we’ve done is add the volume numbers from a starting point back to a date when the total equals the float number. There is in this definition an important point that needs to be noted. Although the company’s float is 100 million shares and 100 million shares were traded in a one-year span, we cannot say that all the shares in the float have been traded. This is because it is impossible to know the intentions of all the market participants. There may be short-term day traders who buy and sell several times during a float turnover, and there may be long-term investors who are holding their shares and not trading at all. This being the case, we can only say approximately all the shares in the float were traded. We can, however, quite correctly say that the total number of shares that were traded corresponds to the number of shares in the stock’s float. This is because we can add up the number of shares that were traded during any time frame and compare it to the stock’s float number. When the number of shares traded in any time frame is the same as the float number, we can say that by our definition we have a float turnover.
To some degree, a complete change of ownership in the company is implied by a float turnover, but it can never be measured with any degree of precision.
Real Life Applications
One can make a good strategy out of it
Can be used as confirmations to the old school patterns observed
Useful in deciding recovery points
Useful in deciding reverse trade points
Useful in deciding catastrophic Exit Plan
Some more Visual Examples
Which Timeframes it can be used
Can be used in any timeframes
like : 15s, 30s, 1m, 3m .... 1D, 1W, 1M,
Only to be used for securities for which tradingview provides volume data
How can you get this Indicator
You get this indicator only by messaging me privately , do not use the comment box for requesting access to the indicator, as it is against the house rules of Tradingview community. Use comments only for adding or suggesting constructive stuffss.
Last but not the least Thanks to TradingView for providing us such an awesome platform!

Normalized Volatility IndicatorFrom an article by Rajesh Kayakkal:
"Early bear phase signals can help you get out of the market before it turns down. This indicator tells you how.
There are many ways to identify the trend of a financial market, the most common being the 200-day exponential moving average (Ema). When price is trending down below the 200-day Ema, the market is believed to be in a bear phase. If the market is trending up above the 200-day Ema, it is considered to be in a bull phase.
Since every indicator fails at times, I wanted to find other indicators to confirm a trend. In my quest for another indicator to determine the trend for the financial markets, I found the Cboe Volatility Index (Vix) to be a good indicator of the market direction. The Vix is calculated from the weighted average of the implied volatilities of various options on the Standard & Poor’s 500 index futures.
J. Welles Wilder’s average true range can also give an indication of the financial market trends; that is, when the market is in a bull phase, the average true range narrows, and when it is in a bear phase, the average true range expands. The normalized volatility indicator (Nvi) is based on this behavior.
Normalized volatility indicator (Nvi)
Average true range (Atr) varies depending on time. But how do we determine the phase of the financial market with Atr? Perhaps some type of ratio could give us a clue. A ratio presents a relationship of a quantity with respect to another. I did some research based on a ratio of the 64-day average true range and the end-of-day value of equity indexes such as the Standard & Poor’s 500 (Spx). I selected the 64-day period since it is close to the average number of trading days in a quarter. The ratio of the 64-day average true range and closing price does discount seasonal variations in the average true range and gives a single number that can be used to compare volatility of an instrument across many decades. I call this ratio the normalized volatility indicator.
I found an interesting correlation between Nvi and cycles of major equity market indexes. The formula for the Nvi is:
Nvi = 64 - Day average true range/End-of-day price * 100
The NVI gave advanced signals before the cyclical bear phase of SPX commenced in October 2000 and was almost on the spot with the bull phase that began in 2003 and the current secular bear market cycle, which started in November 2007."
Includes options to show inverse NVI and change the ATR length and smoothing.

Volatility Rainbow [Nic]What is this
The volatility rainbow tracks divergences in a security and its volatility index. This can be used to identify periods of heightened implied (future) risk.
About Volatility
The volatility is calculated by looking at put / call ratios. When VIX goes up it means that puts are outpacing calls. This is a bearish signal.
About Correlation
When the security goes up while the VIX goes up, the divergence on the plot will increase and turn a color. This should be a warning.
Colors
RED - DIA
BLUE - SPX
GREEN - IWM
GOLD - GLD
YELLOW - QQQ
ORANGE - TLT
White- VVIX
Related

Volatility Prism [Nic]What is this
The volatility rainbow tracks divergences in a security and its volatility index. This can be used to identify periods of heightened implied (future) risk.
About Volatility
The volatility is calculated by looking at put / call ratios. When VIX goes up it means that puts are outpacing calls. This is a bearish signal.
About Correlation
When the security goes up while the VIX goes up, the divergence on the plot will increase and turn a color. This should be a warning.
Volatility Rainbow
This is a similar indicator, but this one merges all signals into a single line.

VIX MTF MomentumSweet little momentum gadget to track the VIX Index.
What is the VIX?
The CBOE S&P 500 Volatility Index (VIX) is known as the 'Fear Index' which can measure how worried traders are that the S&P 500 might suddenly drop within the next 30 days.
When the VIX starts moving higher, it is telling you that traders are getting nervous. When the VIX starts moving lower, it is telling you that traders are gaining confidence.
VIX calculation?
The Chicago Board of Options Exchange Market Volatility Index (VIX) is a measure of implied volatility (Of the S&P 500 securities options), based on the prices of a basket of S&P 500 Index options with 30 days to expiration.
How to use:
If VIX Momentum is above 0 (RED) traders are getting nervous.
If VIX Momentum is below 0 (GREEN) traders are gaining confidence.
Follow to get updates and new scripts: www.tradingview.com

Risk RangeThis indicator creates risk ranges using implied volatility (VIX) or historical volatility, skewness ( Cboe SKEW or estimate ) and kurtosis.
Realized Variables for Options ComparisonThese variables can be used in comparison with the implied volatility of options.
Variables:
Realized Volatility
mathematical notation lowercase 'sigma'
Realized Variance
mathematical notation lowercase 'sigma' squared
Realized Beta
mathematical notation lowercase 'beta'
Timeframes:
Yearly = 250 or 365
Quarterly = 50 or 90
Monthly = 20 or 30
Important Note:
Options Contract Expiry = barmerge.lookahead_on
"Merge strategy for the requested data position. Requested barset is merged with current barset in the order of sorting bars by their opening time. This merge strategy can lead to undesirable effect of getting data from "future" on calculation on history. This is unacceptable in backtesting strategies, but can be useful in indicators."
[ All other timeframes barmerge.lookahead is disabled.

CryptoSignalScanner - OverBought/OverSold Zone IndicatorDESCRIPTION:
This indicator has been designed to do some swing trading on 4 hour and daily candles.
It also gives good results on the lower timeframes 5m, 15m and 1h but trading on those levels is time consuming and stressful.
• This indicator is based on RSI, Stochastic RSI and some other indicator(s).
• This indicator is based on our "CryptoSignalScanner - Advanced BUY/SELL Indicator" but with a small difference in calculation to define the OverBought and OverSold zones.
• It displays the OverBought and OverSold zones.
• It is also possibility to set an OverBought/OverSold, OverBought and OverSold alert.
HOW TO USE:
• When the OverBought zone is displayed it means that the trading pair is OverBought. Wait for the reversal to SELL. Use the Fibonacci tool together with the Eliot Waves Theory to SELL.
• When the OverSold zone is displayed it means that the trading pair is OverSold. Wait for the reversal to BUY. Use the Fibonacci tool together with the Eliot Waves Theory to BUY.
FEATURES:
• You can adjust the OverBought and OverSold zones.
• You can display/hide the RSI.
• You can adjust RSI values.
• You can display/hide the Stochastic RSI.
• You can adjust Stochastic RSI values.
• You can display/hide the ...
• You can adjust the ...
• You can set OverBought/OverSold alert.
• You can set OverBought alert.
• You can set OverSold alert.
• Etc...
REMARKS:
• This advice is NOT financial advice.
• We do not provide personal investment advice and we are not a qualified licensed investment advisor.
• All information found here, including any ideas, opinions, views, predictions, forecasts, commentaries, suggestions, or stock picks, expressed or implied herein, are for informational, entertainment or educational purposes only and should not be construed as personal investment advice.
• We will not and cannot be held liable for any actions you take as a result of anything you read here.
• We only provide this information to help you make a better decision.
• While the information provided is believed to be accurate, it may include errors or inaccuracies.
HOW TO GET ACCESS TO THE SCRIPT:
• Use the link below to subscribe to our indicators.
Good Luck,
SEOCO

PAI band (PP & ATR & IV)3つの抵抗帯
○インプライド・ボラティリティ
○アベレージ・トゥルー・レンジ
○ピボットポイント
を利用して、日単位・週単位で価格が到達するであろう境界線を表示します。
中途半端な価格帯での狼狽売買を避けて、優位性が期待できる値位置でエントリー・エグジットを検討できます。
価格がPAI bandに到達した時に、あなたが愛用している他のテクニカルのサインと合わせて使うのもいいでしょう。
3 resistance bands
○ Implied volatility
○ Average True Range
○ Pivot point
Use to display the boundaries that the price will reach on a daily/weekly basis.
You can consider entry/exit at a value position where you can expect superiority, avoiding discouragement in the half price range.
When the price reaches the PAI band, you can use it along with other technical signatures that you love.
