VIX9D to VIX RatioVIX9D to VIX Ratio
The ratio > 1 can signal near-term fear > long-term fear (potential short-term stress).
The ratio < 1 implies long-term implied volatility is higher — more typical in calm markets.
ค้นหาในสคริปต์สำหรับ "implied"

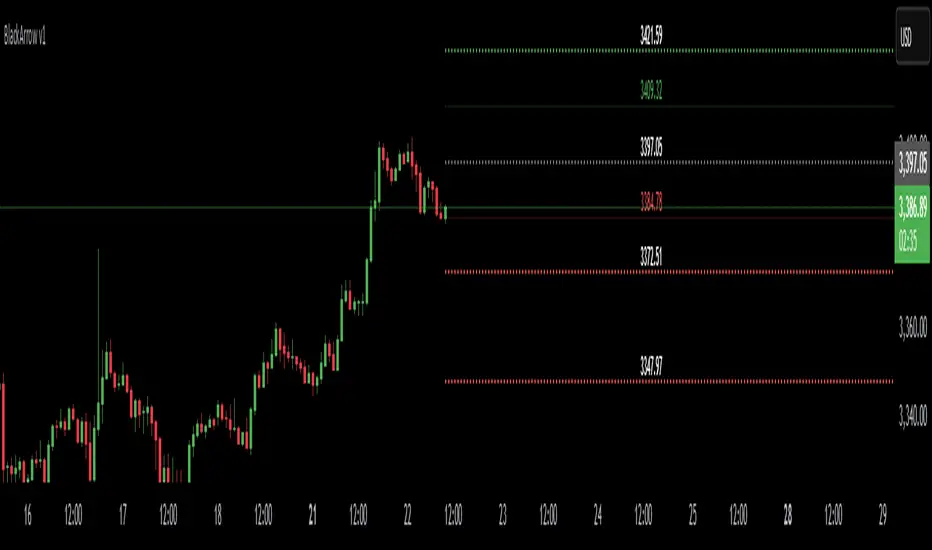
Black ArrowExpected Move Levels - Closer Prices
This script calculates and displays the expected move based on Implied Volatility (IV) and Days to Expiration (DTE). It helps traders visualize potential price movement ranges over a defined period using historical close price.
🔹 Key Features:
Customizable IV and DTE inputs
Displays 2 green levels above price and 2 red levels below, representing half and full expected move
Mid-lines between base price and first green/red level
Each level is labeled with its price value
Lines are drawn short and don't extend through the full chart for clarity
📘 Formula:
Expected Move = Price × IV × √(DTE / 365)
Use this tool to estimate market volatility zones and potential price targets without relying on traditional indicators.
BullTrading Easy Tops & BottomsTRADING TOOL OVERVIEW
The Easy Tops & Bottoms indicator identifies potential reversal points on intraday charts by analysing volatility patterns and momentum shifts during major trading sessions. It projects horizontal zones that may act as support or resistance, adapting dynamically to price behavior.
This indicator is designed for use on intraday timeframes from 1-minute to 15-minute charts only.
HOW THE INDICATOR WORKS
The indicator uses an adaptive algorithm to evaluate momentum exhaustion and volatility clusters within intraday sessions (aligned with New York local time). It generates time based zones when conditions indicate potential trend reversals, such as after volatility spikes followed by contraction. These zones extend horizontally until price breaks boundaries or a bar limit is reached.
- Support Zones : Formed during bullish sessions with tail volatility, suggesting potential bottoms.
- Resistance Zones : Formed during bearish sessions with wick volatility, suggesting potential tops.
Zones are filtered for significant sessions to focus on meaningful price action. Signals trigger based on price interaction with the zone, requiring a specific relationship between the candle's low, high, and close relative to the zone level—for example, engulfing the level but closing in the reversal direction.
Note that signals and zone behaviors will differ across timeframes (e.g., 1m, 5m, 15m) due to varying candle sizes affecting how closes relate to zone triggers. Shorter timeframes may show more frequent but noisier interactions, while longer ones capture broader momentum shifts.
USERS GUIDE
What the Indicator Does?
The indicator has two operating modes: Buy/Sell Signal Mode (suitable for beginners and trend-following traders—important note: trend-following traders must filter according to their own trend criteria) and Support/Resistance Mode, which is a full and complete trading system.
- Plots Dynamic Zones: Horizontal boxes appear at qualifying session ends, representing support (bottoms) or resistance (tops).
- Active zones use a semi-transparent colour (customisable) and extend rightward while valid.
- Expired zones (after break or timeout) shift to a historical colour for reference.
- Generates Signals (in Buy/Sell Signal Mode): Labels appear on zone interactions confirming reversal potential:
- "BUY" (green) for support zones.
- "SELL" (red) for resistance zones.
- Time Based Focus: Ties to intraday periods like Asian, London, and New York transitions. Use NY Local Time in your charts.
- Additional Elements: Includes a watermark with symbol, timeframe, and date; an optional NotePad table for notes.
How to Interpret Signals
- Zone Dynamics: Active zones indicate ongoing validity; expiration signals a potential shift (e.g., a support break may turn it into resistance).
- Signal Triggers: Require price to test the zone level with a closing bias toward reversal. These are suitable for beginners learning basic reversals or trend traders adding their own filters (e.g., moving averages for direction).
- Value for Users: Beginners can use zone height to set stop-loss (SL) below/above the box, enabling a 1:2 risk-reward ratio (RR) for take-profit (TP) at twice the zone distance.
- Timeframe Variations: Expect different signals on 1m vs. 15m, as smaller candles on lower frames may trigger more selectively based on close positions relative to zones.
- Note on Entries in Internal Range Zones: For all entries (the Internal Range inside range zones), when a big zone swallows smaller zones ahead, consider using the bigger zone or the SL price level as an entry level.
PRACTICAL TRADING SCENARIOS
Here, we expand on how to apply the indicator in real-world trading, with detailed examples for each mode. These scenarios assume a basic understanding of risk management, such as position sizing at 0.5-1.5% of account capital per trade. Always backtest these ideas on historical data for your specific instrument (e.g., forex pairs like EUR/USD or indices like US30).
Buy/Sell Signal Mode: Reversal and Trend-Following Applications
This mode is ideal for spotting reversal opportunities while allowing flexibility for trend filters. Signals appear as labels when price interacts with zones in a confirmatory way, making it beginner-friendly for learning entry points. Trend-following traders should overlay their preferred trend indicators (e.g., a 50-period EMA) to avoid counter-trend trades.
Important critical note: In this mode, the 1:2 RR is based and measured directly on the zone height (not on the actual distance from entry price to SL). The correct SL placement is at the far edge of the zone (e.g., zone bottom for buys, zone top for sells), and TP is set at twice the zone height from the signal level (the key trigger price where the label appears).
- Basic Reversal Scalping (Beginner-Friendly): On a 5-minute chart during the London session open, after a sharp down-move in EUR/USD, a support zone forms with signal level at 1.0850 (zone top) and height of 10 pips (zone bottom at 1.0840). Wait for a "BUY" signal when price dips to test the zone (low touches 1.0850) but closes above it. Enter long at the current price (e.g., 1.0855). Set SL at the zone bottom (1.0840), and TP at the signal level + 2x zone height (1.0850 + 20 pips = 1.0870). This ensures the 1:2 RR is measured purely on the zone (risk = 10 pips zone height, reward = 20 pips), regardless of exact entry. If volatility is high (filter enabled), this setup prioritizes stronger sessions for better win rates.
- Trend-Following with Filter: On a 15-minute chart of GBP/JPY during New York AM, the overall trend is upward (price above a 200-period SMA). A support zone appears with signal level at 185.20 (zone top) after a pullback, with a height of 20 pips (zone bottom at 185.00). Ignore any "SELL" signals as they counter the trend; instead, wait for a "BUY" when price tests the zone from above and closes bullishly. Enter long at the current price (e.g., 185.25). Set SL at the zone bottom (185.00), and TP at the signal level + 2x zone height (185.20 + 40 pips = 185.60). Add a trend filter like MACD histogram turning positive for confirmation, reducing whipsaws in ranging markets. The RR remains 1:2 based on the zone (risk = 20 pips height, reward = 40 pips).
- Range-Bound Day Trading: In a 1-minute chart of USD/JPY during Asian session consolidation, multiple zones form stacking as support/resistance. Monitor for "SELL" at a resistance zone with signal level at 147.80 (zone bottom) and height of 8 pips (zone top at 147.88) after an uptick. Enter short on the signal at the current price (e.g., 147.78). Set SL at the zone top (147.88), and TP at the signal level - 2x zone height (147.80 - 16 pips = 147.64). Shorter timeframes like 1m may produce more signals due to tighter candle closes, but use the volatility filter to avoid flat periods—test historically to see how 1m noise compares to 15m's smoother triggers. The RR is fixed at 1:2 on the zone (risk = 8 pips height, reward = 16 pips).
Support/Resistance Mode: Standalone Contrarian System for Fading Breaks
This mode hides signals and labels, turning the indicator into a complete contrarian trading system focused on fading zone breaks. It treats broken zones as "flips"—a broken support becomes potential resistance, and vice versa. Entries use limit orders at a distance equal to the zone height, with fixed 1:2 RR based on that height. No additional filters are required, but combining with session timing enhances edge. Alerts fire on new zone creation, allowing proactive setup.
When a setup results in a stop loss in Support/Resistance Mode, the original zone can be used for a "Stop & Reverse" trade with the same trading proportions. This means reversing the position direction upon hitting SL, using the original zone to set the new entry (at the box top/bottom trigger level), SL (at the opposite box edge), and TP (2x the height beyond entry)—effectively capturing momentum in the opposite direction while maintaining the 1:2 RR.
- Fading a Support Break (Short Setup): On a 5-minute chart of AUD/USD during NY PM, a support zone at 0.6650 (height 12 pips) breaks when low pierces below 0.6638. Consider the zone flipped to resistance. Place a sell limit order 12 pips above the broken zone (at 0.6662), SL 12 pips above entry (0.6674), and TP 24 pips below entry (0.6638, achieving 1:2 RR). This anticipates sellers re-entering on pullbacks to the former support. If the volatility filter is on, this only applies to significant breaks; historically, test on pairs with clear pip values to adjust for spreads.
Stop & Reverse Scenario: If the short position hits SL at 0.6674 (price rallies above), reverse to a long position. Use the original 12-pip zone: Place a buy limit order on the original broken support (now acting as flipped resistance, at 0.6650 box top), SL 12 pips below the new entry (0.6638 box bottom), and TP 24 pips above the new entry (0.6674, maintaining 1:2 RR). This captures potential upside momentum after the false break.
- Fading a Resistance Break (Long Setup): In a 15-minute chart of Nasdaq futures (NQ) during London close, a resistance zone at 18500 (height 50 points) breaks upward (high > 18550). Flip it to support. Place a buy limit order 50 points below the broken zone (at 18450), SL 50 points below entry (18400), TP 100 points above entry (18550). This catches pullbacks in uptrends. Longer timeframes like 15m may show fewer but more reliable breaks due to broader candle relationships—compare to 1m, where smaller candles might invalidate zones quicker.
Stop & Reverse Scenario: If the long position hits SL at 18400 (price drops below), reverse to a short position. Use the original 50-point zone: Place a sell limit order on the original broken resistance (now acting as flipped support, at 18500 box bottom), SL 50 points above the new entry (18550 box top), and TP 100 points below the new entry (18400, maintaining 1:2 RR). This captures potential downside momentum after the false break.
- Multi-Zone Contrarian Scalping in High-Volatility Sessions: On a 1-minute chart of Bitcoin (BTC/USD) during NY open, several zones form and break in quick succession. After a resistance at 65000 (height 200 USD) breaks, place buy limit 200 USD below (64800), SL at 64600, TP at 65200. Conversely, for a broken support at 64000 (height 150 USD), sell limit 150 USD above (64150), SL 64300, TP 63850. Use the max bars setting to limit zone lifespan in fast markets; enable volatility filter to focus on explosive sessions like news releases. This mode's standalone nature suits automated mindsets—backtest to quantify edge, noting 1m's frequent triggers vs. 15m's strategic ones.
Stop & Reverse Scenario: For the buy after resistance break, if it hits SL at 64600 (price falls below), reverse to short. Use the original 200 USD zone: Place a sell limit order on the original broken resistance (now acting as flipped support, at 65000 box bottom), SL 200 USD above the new entry (65200 box top), TP 400 USD below the new entry (64600, maintaining 1:2 RR). Similarly, for the sell after support break, if it hits SL at 64300 (price rallies above), reverse to buy: Use the original 150 USD zone: Place a buy limit order on the original broken support (now acting as flipped resistance, at 64000 box top), SL 150 USD below the new entry (63850 box bottom), TP 300 USD above the new entry (64300, maintaining 1:2 RR). This captures potential momentum after the false breaks.
- Risk Considerations for Both Modes: Always test scenarios historically and adjust for instrument specifics like pip/point values and spreads. For example, forex might use 1-2 pip buffers, while crypto needs larger due to volatility. This is not trading advice; users should evaluate independently and consult professionals.
KEY SETTINGS
- Indicator Mode: "Buy/Sell Signal Mode" for signals; "Support/Resistance Mode" for zones only.
- Show S/R Zones: Toggle box visibility.
- Colours: Customise active/historical zones, buy/sell labels.
- Max Bars for Signal: Zone extension limit (default: 288).
- Require Significant Volatility: Filter for notable sessions (default: true).
- Days to Keep Historical Zones: Retention period (default: 7).
- Show NotePad?: Toggle notes table.
ALERTS
- Signal Mode: On BUY/SELL triggers.
- S/R Mode: On new zone creation.
Backtest thoroughly before use.
Why Protected?
This script uses a proprietary zone detection method designed to highlight support/resistance zones in a clear, structured way. To maintain the integrity and unique utility of the algorithm, the code is closed-source.
Important Considerations
This tool does not guarantee profits and is not intended to replace sound trade management or risk discipline. It is designed to aid traders in visualiSing market structure. Use responsibly with appropriate risk measures.
Legal Disclaimer
This indicator is provided for educational and informational purposes only. It is not intended as financial, investment, or trading advice, and does not constitute a recommendation to buy, sell, or hold any financial instrument.
Trading financial markets involves substantial risk. Past performance of any trading strategy or indicator is not indicative of future results. Users of this indicator assume full responsibility for their trading decisions. No guarantees are made regarding the accuracy, reliability, or profitability of the signals generated by this tool.
This indicator is published as-is, without any express or implied warranties. The publishers shall not be held liable for any losses or damages, direct or indirect, arising from the use, misuse, or reliance on this tool.
All trading decisions should be made with consideration of your financial situation and risk tolerance. Consultation with a licensed financial advisor is strongly recommended before making any investment decisions.
By using this indicator, you acknowledge and agree to these terms. Your use constitutes acceptance of full responsibility and the understanding that trading is inherently risky and should be approached with caution and discipline.

Real 10Y Yield (DGS10 - T10YIE)The Real 10Y Yield (DGS10 – T10YIE) indicator computes the inflation-adjusted U.S. 10-year Treasury yield by subtracting the 10-year breakeven inflation rate (T10YIE) from the nominal 10-year Treasury yield (DGS10), both sourced directly from FRED. By filtering out inflation expectations, this script reveals the true, real borrowing cost over a 10-year horizon—one of the most reliable gauges of overall risk sentiment and capital–market health.
How It Works
Data Inputs
• DGS10 (Nominal 10-Year Treasury Yield)
• T10YIE (10-Year Breakeven Inflation Rate)
Both series are fetched on a daily timeframe via request.security from FRED.
Real Yield Calculation
pine
Copy
Edit
real10y = DGS10 – T10YIE
A positive value indicates that nominal yields exceed inflation expectations (real yields are positive), while a negative value signals deep-negative real rates.
Thresholds & Coloring
• Bullish Zone: Real yield < –0.1 %
• Bearish Zone: Real yield > +0.1 %
The background turns green when real yields drop below –0.1 %, reflecting an ultra-accommodative environment that historically aligns with risk-on rallies. It turns red when real yields exceed +0.1 %, indicating expensive real borrowing costs and a potential shift toward risk-off.
Alerts
• Deep-Negative Real Yields (Bullish): Triggers when real yield < –0.1 %
• High Real Yields (Bearish): Triggers when real yield > +0.1 %
Why It’s Powerful
Forward-Looking Sentiment Gauge
Real yields incorporate both market-implied inflation and nominal rates, making them a leading indicator for risk appetite, equity flows, and crypto demand.
Clear, Actionable Zones
The –0.1 % / +0.1 % thresholds cleanly delineate structurally bullish vs. bearish regimes, removing noise and false signals common in nominal-only yield studies.
Macro & Cross-Asset Confluence
Combine with equity indices, dollar strength (DXY), or credit spreads for a fully contextual macro view. When real yields break deeper negative alongside weakening dollar, it often precedes stretch in risk assets.
Automatic Alerts
Never miss regime shifts—alerts notify you the moment real yields breach key zones, so you can align your strategy with prevailing macro momentum.
How to Use
Add to a separate pane for unobstructed visibility.
Monitor breaks beneath –0.1 % for early “risk-on” signals in stocks, commodities, and crypto.
Watch for climbs above +0.1 % to hedge or rotate into defensive assets.
Combine with your existing trend-following or mean-reversion strategies to improve timing around major market turning points.
–––
Feel free to adjust the threshold lines to your preferred sensitivity (e.g., tighten to ±0.05 %), or overlay with moving averages to smooth out whipsaws. This script is ideal for macro traders, portfolio managers, and quantitative quants who demand a distilled, inflation-adjusted view of real rates.

Volatility Strategy 01a quantitative volatility strategy (especially effective in trend direction on the 15min chart on the s&p-index)
the strategy is a rule-based setup, which dynamically adapts to the implied volatility structure (vx1!–vx2!)
context-dependent mean reversion strategy based on multiple timeframes in the vix index
a signal is provided under following conditions:
1. the vvix/vix spread has deviated significantly beyond one standard deviation
2. the vix is positioned above or below 3 moving averages on 3 minor timeframes
3. the trade direction is derived from the projected volatility regime, measured via vx1! and vx2! (cboe)

headmapOverview
Advanced Price-Action Zones is a comprehensive, professional-grade indicator designed to automatically map and visualize the most critical historical price levels on your chart. Moving beyond simple lines, it renders these levels as dynamic, semi-transparent zones, providing an intuitive 'heatmap' of significant support, resistance, and potential liquidity areas.
This tool is built for traders who demand a clean, data-rich chart that adapts in real-time to market movements, with a fully customizable interface for personal tuning.
Core Features
Automated Multi-Timeframe Analysis: Automatically plots the high and low of the previous Daily, Weekly, Monthly, and 12-Hour sessions, forming the backbone of your structural analysis.
Heatmap-Style Visualization: Levels are displayed as colored zones rather than simple lines. This allows you to instantly spot areas of confluence where multiple historical levels overlap, indicating stronger S/R.
Dynamic Daily Highlighting: The most recent previous day's high/low is shown in a primary color (default: yellow). As a new day begins, these zones automatically fade to a distinct historical color (default: grey), keeping your focus on the most relevant and recent price action.
Intraday Liquidity Targets: Temporary 12-hour zones are plotted with "L. Shorts" and "L. Longs" labels, highlighting potential short-term reversal areas or stop-run targets. These zones automatically expire to keep the chart clean.
Daily Range Context: A subtle background fill visualizes the entire range of the previous trading day, extending into the current session to provide immediate context for breakouts or range-bound behavior.
Toggleable Volume Data: Get deeper insights with floating labels showing the volume on the bar that created a key Daily, Weekly, or Monthly level. This feature can be turned on or off in the settings.
Full Customization: Every color for every zone type, background, and text element is fully adjustable via the indicator's input menu.
On-Chart Informative Legend: A clean legend in the top-right corner explains the color-coding and the implied importance of each timeframe.
How to Interpret the Visuals
High-Timeframe Levels (Monthly/Red, Weekly/Orange): Use these major zones to identify significant market turning points, high-probability reversal areas, and logical take-profit targets for swing trades.
Mid-Timeframe Levels (Daily): The yellow zones (most recent) represent the immediate battlefield. A decisive move beyond this area can set the tone for the session. The grey zones provide a historical map of prior daily structures.
Short-Timeframe Levels (12-Hour/Blue): Treat these as intraday targets. They often represent areas where stop-losses and liquidations might be clustered, making them magnets for price in the short term.
Disclaimer & Technical Notes
Disclaimer: This tool is for educational and analytical purposes only and does not constitute financial advice or trade signals. All trading involves significant risk.
Technical Note on lookahead: This indicator correctly uses lookahead = barmerge.lookahead_on when requesting higher-timeframe data. This is the standard, industry-accepted method to ensure that a completed historical value (e.g., the previous day's high) is plotted consistently and accurately across all chart timeframes. It does not "repaint" in the conventional sense of changing past signals, but rather ensures data stability.
This is a protected, closed-source script.

FeraTrading Pattern Recognition Engine🧠 Overview:
The FeraTrading Pattern Recognition Engine (PRE) is a lightweight, adaptive model that transforms raw chart data into pattern signatures and tracks their performance in real time.
Instead of relying on fixed formulas or lagging indicators, it learns from what has worked before on your chart—highlighting bull and bear patterns that have a track record of hitting a profit target within a specified number of bars.
This system is ideal for traders who want evolving entries that reflect live market behavior without repainting or hardcoding.
⚙️ How It Works:
🔹 Pattern Encoding:
The script monitors recent price action and builds a unique pattern ID using selected features:
Up to 10 feature toggles (detailed below)
Each feature is converted into a categorical value
The combination of features over a lookback window defines the pattern signature
Bullish and bearish patterns are tracked separately.
🔹 Pattern Evaluation & Learning:
As each pattern appears:
A unique ID is generated.
The script checks if price reaches the required % move within N bars.
If successful, it logs the pattern as a win.
Accuracy and sample size are updated.
Only patterns with 10+ past samples are eligible for live signals.
🔹 Signal Generation:
When today's pattern matches one of the top historically successful bull or bear patterns:
🟢 Green Triangle (below bar) = Bullish pattern match
🔴 Red Triangle (above bar) = Bearish pattern match
Signals are confirmed one bar after pattern completion to avoid repainting.
🧶 Feature Toggles:
Each of the following can be turned on/off to customize the pattern logic:
Candle Type: Bullish, Bearish, or Doji classification.
RSI > 50: Adds momentum context.
Higher High / Lower Low: Tracks continuation or breakout structure.
Volume Spike: Flags volume > 1.5x 20-bar average.
Relative Range: True if bar range > 5-bar average.
Body-to-Range > 60%: Filters for full-bodied candles.
Wick Dominance: Flags wicky/exhaustion candles.
EMA Alignment: Checks if price is in directional alignment with fast/slow EMAs.
Gap From Prior Close: Flags price gaps from previous close.
RSI Slope: Captures trend acceleration or deceleration in RSI.
Tip: 2–3 features = broader learning. 5+ features = more selective precision.
🤷 Inputs & Customization:
Target Move %: How far price must move to qualify as a win.
Lookback Bars: How far back to check for pattern definition.
Bars Forward: How much time the pattern has to hit target.
Signal Toggles: Enable/disable bullish and bearish signals.
🎯 What Makes It Original:
Learns from live data—no static formulas or preset patterns.
Signals only appear if historical accuracy + sample size threshold is met.
One-bar delayed confirmation = no repainting.
Configurable features allow full user control of complexity.
Works on any asset, any timeframe.
✅ How to Use:
Add to any intraday chart (1m–30m ideal).
Start with 2–3 features toggled on.
Let the script learn as data comes in.
Watch for triangle signals (green = bullish, red = bearish).
Combine with other tools for added confluence.
Over time, the engine becomes more selective and accurate.
💎 Why It’s Worth Paying For
The PRE isn’t a repackaged signal script—it’s a real-time learning engine. It provides:
A dynamic model that evolves with your chart
Customizable pattern encoding across 10 behavioral features
Verified, statistically accurate signals
Confirmed, non-repainting outputs
Applicability to any asset or market condition
This isn't theoretical—it's performance-driven signal logic trained by your own chart.
✅ Compliance & Originality This tool was developed from scratch by FeraTrading using fully original logic. No open-source logic or reused libraries were used. All detection methods, signal logic, and pattern encodings are unique and built with compliance in mind. This is absolutely an original script, one we think may be unique to TradingView completely and never seen before.
⚠️ Risk Disclaimer & Access Policy
This script is a historical pattern tracker—not a forecasting engine. No prediction of future price behavior is implied or guaranteed.
Use with proper risk management and trade discretion.
To protect the core pattern engine, this script is invite-only and closed-source. Opening the source would allow cloning of its real-time pattern encoding and filtering logic.
Restricting access ensures:
Proper use by qualified traders
Prevention of misuse or unauthorized distribution
Protection of the tool’s proprietary logic and long-term value
The PRE is designed to be part of a professional workflow, and its access model reflects that goal.

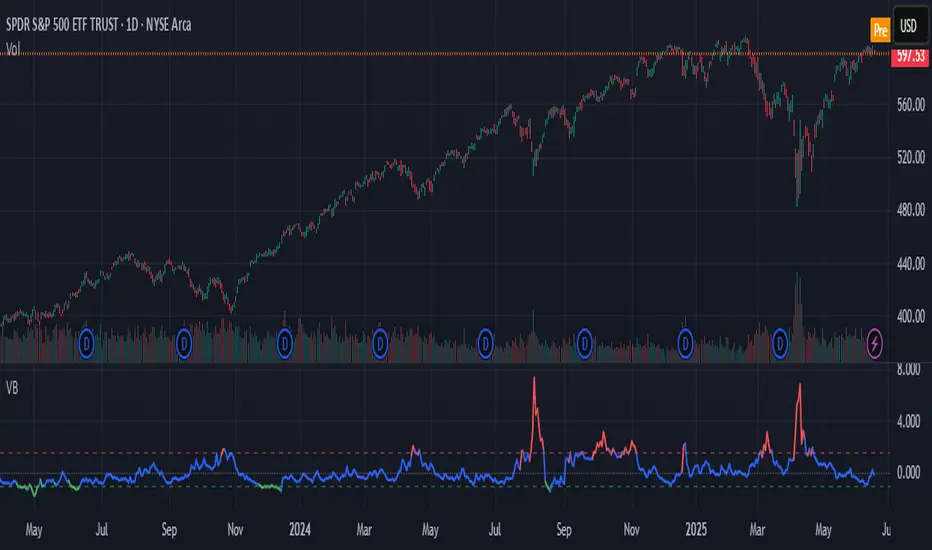
Volatility Barometer (VB)Volatility Barometer (VB)
The Volatility Barometer (VB) is a comprehensive market sentiment indicator designed to measure aggregate stress and fear in the equity market. It consolidates three critical volatility metrics into a single, easy-to-interpret score, providing a broader view of market conditions than any single metric alone.
Core Components
The barometer synthesizes information from:
VIX Index (VIX): The standard measure of implied 30-day stock market volatility.
VVIX Index (VVIX): The volatility of the VIX itself, often seen as the "volatility of volatility." High VVIX readings can signal uncertainty about the VIX's future path.
VIX Futures Term Structure (VX1!−VX2!): The spread between the front-month and second-month VIX futures. A positive spread (contango) is typical, while a negative spread (backwardation) often signals imminent market stress.
How It Works
To create a unified view, the indicator normalizes each of these three components using a Z-score. The Z-score measures how many standard deviations a value is from its historical mean over a user-defined period (defaulting to 252 days, or one trading year).
These three standardized Z-scores are then combined into a final VB Score using a weighted average. Users can customize these weights in the indicator's settings to emphasize the components they find most important.
How to Interpret
The VB Score is plotted as a single line that oscillates around a zero level, with its color changing to reflect the prevailing market regime:
High Stress (Red Line): When the score rises above the "High stress threshold" (default: 1.5), it indicates heightened market fear and risk-off sentiment. This is a period of significant stress, often associated with market downturns.
Low Stress (Green Line): When the score falls below the "Low stress threshold" (default: -1.0), it signals complacency and low perceived risk in the market. Extreme low readings can sometimes precede volatility spikes.
Neutral (Blue Line): Scores between the high and low thresholds represent normal market conditions.
By providing a weighted, multi-faceted view of volatility, the Volatility Barometer helps traders and investors identify market regimes, confirm trading biases, and anticipate potential shifts in market sentiment.
OptionHawk1. What makes the script original?
• Unique concept: It integrates a Keltner based custom supertrend with a multi-EMA energy visualization, ATR based multi target management, and on chart options (CALL/PUT) trade signals—creating a toolkit not found in typical public scripts.
• Innovative use: Instead of off the shelf indicators, it reinvents them:
• Keltner bands used as dynamic Supertrend triggers.
• Fifteen EMAs layered for “energy” zones (bullish/bearish heatmaps).
• ATR dynamically scales multi-TP levels and stop loss.
These are creatively fused into a unified signal and automation engine.
________________________________________
2. What value does it provide to traders?
• Clear entries & exits: Labels for entry price/time, five TP levels, and SL structure eliminate guesswork.
• Visualization & automation: Real-time bar coloring and energy overlays allow quick momentum reads.
• Targeted to common pain points: Many traders struggle with manual TP/SL and entry timing—this automates that process.
• Ready for real use: Just plug into intraday (e.g., 5 min) or swing setups; no manual calculations. Signals are actionable out of the box.
________________________________________
3. Why invite only (worth paying)?
• Proprietary fusion: Public indicators like Supertrend or EMA are common—but your layered use, ATR based scaling, and label logic are exclusive.
• Auto-generated options format: Unique labeling for CALL/PUT, with graphical on chart signals, isn’t offered freely elsewhere.
• Time-saver & edge-provider: Saves traders hours of configuration and enhances consistency—worth the subscription cost over piecing together mash ups.
________________________________________
4. How does it work?
• Signal backbone: Custom supertrend uses Keltner bands crossing with close for direction, filtered by trend direction EMAs.
• Multi time logic: Trend defined by crossover of price over dynamic SMA thresholds built from ATR.
• Energy bar-colors/EMAs: 15 fast EMAs color-coded green/red to instantly show momentum.
• Entry logic: “Bull” when close crosses above supertrend; “Bear” when crosses below.
• Risk management: SL set at previous bar; up to 5 ATR scaled targets (or percentage based).
• Options formatted alerts: CALL/PUT labels with ₹¬currency values, embedded timestamp, SL/TP all printed on the chart.
________________________________________
5. How should traders use it?
• Best markets & timeframes: Ideal for intraday / low timeframe (1 15m) setups and 1 hour swing trades in equities, indices, options.
• Conditions: Works best in trending or volatility driven sessions—visible via Keltner bands and EMA energy alignment.
• Recommended combo: Use alongside volume filters or broader cycles; when supertrend & energy EMAs align, validation is stronger.
________________________________________
6. Proof of effectiveness?
• On chart visuals: Entry/exit labels, confirmed labels, TP and SL markers make past hits obvious.
• Real trade examples: Highlighted both bull & bear setups with full profit realization or SL hits.
• Performance is paint tested: Easy to showcase historic signals across multiple tickers.
• Data-backed: Users can export chart data to calculate win rate and avg return per trade.
________________________________________
Summary Pitch:
OptionHawk offers a holistic, execution-ready trading tool:
1. Proprietary blend of Keltner-supertrend and layered EMAs—beyond standard scripts.
2. Automates entries, multi-tier targets, SL, and options-format labels.
3. Visual energy overlays for quick momentum readings.
4. Use-tested in intraday and swing markets.
5. Installs on chart and works immediately—no setup complexity.
It's not a public indicator package; it's a self-contained, plug and play trade catalyst—worth subscribing for active traders seeking clarity, speed, and structure in their decision-making.
6. While OptionHawk is designed for clarity and structure, no script can predict the market. Always use with discretion and proper risk management.
---------------------------------------------------------------------------------------------------------------------
OptionHawk: A Comprehensive Trend-Following & Volatility-Adaptive Trading System
The "OptionHawk" script is a sophisticated trading tool designed to provide clear, actionable signals for options trading by combining multiple technical indicators and custom logic. It aims to offer a holistic view of market conditions, identifying trend direction, momentum, and potential entry/exit points with dynamic stop-loss and take-profit levels.
________________________________________
1. Why These Specific Indicators and Code Elements?
The "OptionHawk" script is a strategic fusion of the Supertrend indicator (modified with Keltner Channels), a multi-EMA "Energy" ribbon, dynamic trend lines (based on SMA and ATR), a 100-period Trend Filter EMA, and comprehensive trade management logic (SL/TP). My reason and motivation for this mashup stem from a desire to create a robust system that accounts for various market aspects often overlooked by individual indicators:
• Supertrend with Keltner Channels: The standard Supertrend is effective for trend identification but can sometimes generate whipsaws in volatile or ranging markets. By integrating Keltner Channels into the Supertrend calculation, the volatility measure becomes more adaptive, using the (high - low) range within the Keltner Channel for its ATR-like component. This aims to create a more responsive yet less prone-to-false-signals Supertrend.
• Multi-EMA "Energy" Ribbon: This visually striking element, composed of 15 EMAs, provides a quick glance at short-to-medium term momentum and potential support/resistance zones. When these EMAs are stacked and moving in one direction, it indicates strong "energy" behind the trend, reinforcing the signals from other indicators.
• Dynamic Trend Lines (SMA + ATR): These lines offer a visual representation of support and resistance that adapts to market volatility. Unlike static trend lines, their ATR-based offset ensures they remain relevant across different market conditions and asset classes, providing context for price action relative to the underlying trend.
• 100-Period Trend Filter EMA: A longer-period EMA acts as a higher-timeframe trend filter. This is crucial for confirming the direction identified by the faster-acting Supertrend, helping to avoid trades against the prevailing broader trend.
• Comprehensive Trade Management Logic: The script integrates automated calculation and display of stop-loss (SL) and multiple take-profit (TP) levels, along with trade confirmation and "TP Hit" labels. This is critical for practical trading, providing immediate, calculated risk-reward parameters that individual indicators typically don't offer.
This combination is driven by the need for a multi-faceted approach to trading that goes beyond simple signal generation to include trend confirmation, volatility adaptation, and essential risk management.
________________________________________
2. What Problem or Need Does This Mashup Solve?
This mashup addresses several critical gaps that existing individual indicators often fail to fill:
• Reliable Trend Identification in Volatile Markets: While Supertrend is good, it can be late or whipsaw. Integrating Keltner Channels helps it adapt to changing volatility, providing more reliable trend signals.
• Confirmation of Signals: A common pitfall of relying on a single indicator is false signals. "OptionHawk" uses the multi-EMA "Energy" ribbon and the 100-period EMA to confirm the trend identified by the Keltner-Supertrend, reducing false entries.
• Dynamic Support/Resistance & Trend Context: Static support and resistance levels can quickly become irrelevant. The dynamic SMA + ATR trend lines provide continually adjusting zones that reflect the current market's true support and resistance, giving traders a better understanding of price action within the trend.
• Integrated Risk and Reward Management: Most indicators just give entry signals. This script goes a significant step further by automatically calculating and displaying clear stop-loss and up to five take-profit levels (either ATR-based or percentage-based). This is a vital component for structured trading, allowing traders to pre-define their risk and reward for each trade.
• Visual Clarity and Actionable Information: Instead of requiring traders to layer multiple indicators manually, "OptionHawk" integrates them into a single, cohesive display with intuitive bar coloring, shape plots, and informative labels. This reduces cognitive load and presents actionable information directly on the chart.
In essence, "OptionHawk" provides a more comprehensive, adaptive, and actionable trading framework than relying on isolated indicators.
________________________________________
3. How Do the Components Work Together?
The various components of "OptionHawk" interact in a synergistic and often sequential manner to generate signals and manage trades:
• Keltner-Supertrend as the Primary Signal Generator: The supertrend function, enhanced by keltner_channel, is the core of the system. It identifies potential trend reversals and continuation signals (bullish/bearish crosses of the supertrendLine). The sensitivity and factor inputs directly influence how closely the Supertrend follows price and its responsiveness to volatility.
• Multi-EMA "Energy" Ribbon for Momentum and Confirmation: The 15 EMAs (from ema1 to ema15) are plotted to provide a visual representation of short-term momentum. When the price is above these EMAs and they are spread out and pointing upwards, it suggests strong bullish "energy." Conversely, when price is below them and they are pointing downwards, it indicates bearish "energy." This ribbon serves as a simultaneous visual confirmation for the Supertrend signals; a buy signal from Supertrend is stronger if the EMA ribbon is also indicating upward momentum.
• Dynamic Trend Lines for Context and Confirmation: The sma_high and sma_low lines, incorporating ATR, act as dynamic support and resistance. The trend variable, determined by price crossing these lines, provides an overarching directional bias. This component works conditionally with the Supertrend; a bullish Supertrend signal is more potent if the price is also above the sma_high (indicating an uptrend).
• 100-Period Trend Filter EMA for Macro Trend Confirmation: The ema100 acts as a macro trend filter. Supertrend signals are typically considered valid if they align with the direction of the ema100. For example, a "BUY" signal from the Keltner-Supertrend is ideally taken only if the price is also above the ema100, signifying that the smaller trend aligns with the larger trend. This is a conditional filter.
• Trade Confirmation and SL/TP Logic (Sequential and Conditional):
• Once a bull or bear signal is generated by the Keltner-Supertrend, the tradeSignalCall or tradeSignalPut is set to true.
• A confirmation step then occurs for a "BUY" signal, the script checks if the close of the next bar is higher than the entry bar's close. For a "SELL" signal, it checks if the close of the next bar is lower. This is a sequential confirmation step aimed at filtering out weak signals.
• Upon a confirmed signal, the stop-loss (SL) is immediately set based on the previous bar's low (for calls) or high (for puts).
• Multiple take-profit (TP) levels are calculated and stored in arrays. These can be based on a fixed percentage or dynamic ATR multiples, based on user input.
• The TP HIT logic continuously monitors price action simultaneously against these pre-defined target levels, displaying labels when a target is reached. The SL HIT logic similarly monitors for a stop-loss breach.
In summary, the Supertrend generates the initial signal, which is then confirmed by the dynamic trend lines and the 100-period EMA, and visually reinforced by the EMA "Energy" ribbon. The trade management logic then takes over, calculating and displaying vital risk-reward parameters.
________________________________________
4. What is the Purpose of the Mashup Beyond Simply Merging Code?
The purpose of "OptionHawk" extends far beyond merely combining different indicator codes; it's about creating a structured and informed decision-making process for options trading. The key strategic insights and functionalities added by combining these elements are:
• Enhanced Signal Reliability and Reduced Noise: By requiring multiple indicators to align (e.g., Keltner-Supertrend signal confirmed by EMA trend filter and dynamic trend lines), the script aims to filter out false signals and whipsaws that commonly plague individual indicators. This leads to higher-probability trade setups.
• Adaptive Risk Management: The integration of ATR into both the Supertrend calculation and the dynamic stop-loss/take-profit levels makes the entire system adaptive to current market volatility. This means stop-losses and targets are not static but expand or contract with the market's price swings, promoting more realistic risk management.
• Clear Trade Entry and Exit Framework: The script provides a complete trading plan with each signal: a clear entry point, a precise stop-loss, and multiple cascading take-profit levels. This holistic approach empowers traders to manage their trades effectively from initiation to conclusion, rather than just identifying a potential entry.
• Visual Confirmation of Market Strength: The "Energy" ribbon and dynamic trend lines provide an immediate visual understanding of the market's momentum and underlying trend strength, helping traders gauge conviction behind a signal.
• Improved Backtesting and Analysis: By combining these elements into one script, traders can more easily backtest a comprehensive strategy rather than trying to manually combine signals from multiple overlaying indicators, leading to more accurate strategy analysis.
• Suitability for Options Trading: Options contracts are highly sensitive to price movement and volatility. This script's focus on confirmed trend identification, dynamic volatility adaptation, and precise risk management makes it particularly well-suited for the nuanced demands of options trading, where timing and defined risk are paramount.
________________________________________
5. What New Functionality or Insight Does Your Script Offer?
"OptionHawk" offers several new functionalities and insights that significantly enhance decision-making, improve accuracy, and provide clearer signals and better timing for traders:
• "Smart" Supertrend: By basing the Supertrend's volatility component on the Keltner Channel's range instead of a simple ATR, the Supertrend becomes more sensitive to price action within its typical bounds while still adapting to broader market volatility. This can lead to earlier and more relevant trend change signals.
• Multi-Confirmation System: The script doesn't just provide a signal; it layers multiple confirmations (Keltner-Supertrend, multi-EMA "Energy" coloration, dynamic trend lines, and the 100-period EMA). This multi-layered validation significantly improves the accuracy of signals by reducing the likelihood of false positives.
• Automated and Dynamic Risk-Reward Display: This is a major functionality enhancement. The automatic calculation and clear display of stop-loss and five distinct take-profit levels (based on either ATR or percentage) directly on the chart, along with "TP HIT" and "SL HIT" labels, streamline the trading process. Traders no longer need to manually calculate these crucial levels, leading to enhanced decision-making and better risk management.
• Visual Trend "Energy" and Momentum: The vibrant coloring of the multi-EMA ribbon based on price relative to the EMA provides an intuitive and immediate visual cue for market momentum and "energy." This offers an insight into the strength of the current move, which isn't available from single EMA plots.
• Post-Signal Confirmation: The "Confirmation" label appearing on the bar after a signal, if the price continues in the signaled direction, adds an extra layer of real-time validation. This helps to improve signal timing by waiting for initial follow-through.
• Streamlined Options Trading Planning: For options traders, having clear entry prices, stop-losses, and multiple target levels directly annotated on the chart is invaluable. It helps in quickly assessing potential premium movements and managing positions effectively.
In essence, "OptionHawk" transitions from a collection of indicators to a semi-automated trading assistant, providing a comprehensive, visually rich, and dynamically adaptive framework for making more informed and disciplined trading decisions.
----------------------------------------------------------------------------------------------------------------
Performance & Claims
1. What is the claimed performance of the script or strategy?
Answer: The script does not claim any specific performance metrics (e.g., win rate, profit factor, percentage gains). It's an indicator designed to identify potential buy/sell signals and target/stop-loss levels. The labels it generates ("BUY CALL," "BUY PUT," "TP HIT," "SL HIT") are informational based on its internal logic, not a representation of actual trading outcomes.
2. Is there any proof or backtesting to support this claim?
Answer: No, the provided code does not include any backtesting functionality or historical performance proof. As an indicator, it simply overlays visual signals on the chart. To obtain backtesting results, the logic would need to be implemented as a Pine Script strategy with entry/exit rules and commission/slippage considerations.
3. Are there any unrealistic or exaggerated performance expectations being made?
Answer: The script itself does not make any performance expectations. It avoids quantitative claims. However, if this script were presented to users with implied promises of profit based solely on the visual signals, that would be unrealistic.
4. Have you clearly stated the limitations of the performance data (e.g., “based on backtesting only”)?
Answer: There is no statement of performance data or its limitations because the script doesn't generate performance data.
5. Do you include a disclaimer that past results do not guarantee future performance?
Answer: No, the script does not include any disclaimers about past or future performance. This is typically found in accompanying documentation or marketing materials for a trading system, not within the indicator's code itself.
________________________________________
Evidence & Transparency
6. How are your performance results measured (e.g., profit factor, win rate, Sharpe ratio)?
Answer: Performance results are not measured by this script. It's an indicator.
7. Are these results reproducible by others using the same script and settings?
Answer: The visual signals and calculated levels (Supertrend line, EMAs, target/SL levels) generated by the script are reproducible on TradingView when applied to the same instrument, timeframe, and with the same input settings. However, the actual trading results (profit/loss) are not generated or reproducible by this indicator.
8. Do you include enough data (charts, equity curves, trade logs) to support your claims?
Answer: No, the script does not include or generate equity curves or trade logs. It provides visual labels on the chart, which can be seen as a form of "data" to support the signal generation, but not the performance claims (as none are made by the code).
________________________________________
Future Expectations
9. Are you making any predictions about future market performance?
Answer: No, the script does not make any explicit predictions about future market performance. Its signals are based on historical price action and indicator calculations.
10. Have you stated clearly that the future is fundamentally uncertain?
Answer: No, the script does not contain any statements about the uncertainty of the future.
11. Are forward-looking statements presented with caution and appropriate language?
Answer: The script does not contain any forward-looking statements beyond the visual signals it generates based on real-time data.
________________________________________
Risk & Disclosure
12. Have you disclosed the risks associated with using your script or strategy?
Answer: No, the script does not include any risk disclosures. This is typically found in external documentation.
13. Do you explain that trading involves potential loss as well as gain?
Answer: No, the script does not contain any explanation about the potential for loss in trading.
________________________________________
Honesty & Integrity
14. Have you avoided hype words like “guaranteed,” “foolproof,” or “no losses”?
Answer: Yes, the script itself avoids these hype words. The language used within the code is technical and describes the indicator's logic.
15. Is your language grounded and realistic rather than promotional?
Answer: Yes, the language within the provided Pine Script code is grounded and realistic as it pertains to the technical implementation of an indicator.
16. Are you leaving out any important details that might mislead users (e.g., selective performance snapshots)?
Answer: From the perspective of the code itself, no, it's not "leaving out" performance details because it's not designed to generate them. However, if this indicator were to be presented as a "strategy" that implies profitability without accompanying disclaimers, backtesting results, and risk disclosures, then that external presentation could be misleading. The script focuses on signal generation and visual representation.
⚠️ Disclaimer:
This indicator is for informational and educational purposes only. It does not guarantee any future results or performance. All trading involves risk. Please assess your own risk tolerance and consult a licensed financial advisor if needed. Past performance does not indicate future returns.

Indicator: Volatility Candle Based 📊 Volatility Candle-Based Indicator (Pine Script v6)
This custom TradingView indicator is designed for futures traders who want to analyze volatility, candle patterns, and support/resistance zones within specific market hours. It overlays price charts and provides visual signals that help determine potential momentum shifts, trend continuations, or reversals.
🔧 Core Features
⏰ Futures Time Filter
The indicator activates only during specific trading hours, customized per futures contract (e.g., NQ, ES, GC).
Time is adjusted to the New York (EST) timezone.
This ensures the logic only runs during relevant futures market sessions.
💹 Contract-Specific Multipliers
Applies custom point multipliers for futures contracts (e.g., GC = 30, ES = 24).
Supports three types of multipliers:
Trailing Stop
Trailing Plot Stop
Stop Loss
Ensures accurate backtesting and risk modeling for each contract.
📈 Trendline Support & Resistance
Uses pivot high/low logic to dynamically plot:
Central pivot zones
Step-like support/resistance lines
These trendlines update based on price behavior and can indicate bullish or bearish control.
🔍 Candle Momentum Analysis
Evaluates each candle's:
Body-to-range ratio (e.g., Marubozu, Doji)
Shadow dominance (upper/lower wicks)
Detects important reversal or continuation patterns such as:
Bullish/Bearish Inside Candles
Doji Star formations
Uses a custom moving average to confirm directional bias.
🕯️ Plotter Candle Signals
Identifies BullishPlotter and BearishPlotter candles:
Highlights candles likely to signal upcoming momentum.
Also accounts for neutral signals when no clear bias is detected.
Tracks the high/low of recent signal candles for reference.
📌 Visual Elements (not shown in snippet but implied by logic)
Signal arrows, dashed current levels, and filled support/resistance zones can be plotted to provide real-time feedback.
These are useful for both manual trading and strategy development.
🎯 Use Case
Perfect for intraday or short-term futures traders on instruments like:
🟡 Gold (GC), 🟠 Silver (SI)
📉 Nasdaq (NQ/MNQ), S&P 500 (ES/MES)
This script provides both structural context (trendlines, pivots) and price action signals (candle formations, momentum shifts), helping traders align their decisions with the underlying market flow.

Malama's big MACDPurpose: Malama's Big MACD is a multi-faceted Pine Script indicator designed for traders on short timeframes (1-5 minute charts) to identify high-probability trading opportunities. It combines a Stochastic Price Predictor (SPP) with a comprehensive set of technical indicators, including MACD, RSI, moving average crossovers, ATR, volume spikes, and a custom JKH RSI, to generate robust buy and sell signals. The indicator aims to solve the problem of filtering out market noise in fast-moving markets by integrating probability-based predictions with traditional technical analysis, providing traders with clear entry/exit signals, trend visualization, and risk management levels.
Originality and Usefulness
This script is a unique mashup of a Stochastic Price Predictor (SPP) and a comprehensive indicator suite, tailored for short-term trading. The SPP uses a Monte Carlo simulation combined with ATR and Stochastic RSI to forecast price movements, while the comprehensive indicator suite leverages MACD crossovers, RSI overbought/oversold conditions, moving average crossovers, volume spikes, and a custom JKH RSI for confirmation. Unlike standalone MACD or RSI indicators available in TradingView’s public library, this script’s originality lies in its hybrid approach, blending probabilistic forecasting with multiple confirmatory signals to enhance reliability. The integration of user-defined sentiment input and customizable risk management levels further differentiates it from generic open-source alternatives, making it particularly useful for scalpers and day traders seeking precise, actionable signals.
How It Works
The script operates in two primary modules: the Stochastic Price Predictor (SPP) and the Comprehensive Indicator Suite, which work together to generate and confirm trading signals. Signal strength is calculated to quantify the confidence of bullish or bearish conditions.
Stochastic Price Predictor (SPP):
Core Logic: The SPP forecasts price movements using a Monte Carlo simulation based on historical returns, ATR-based volatility, and Stochastic RSI filtering. It calculates the probability of price reaching a user-defined target move (default: 0.3%) within a specified forecast horizon (default: 3 bars).
Components:
ATR and Volatility: ATR (Average True Range) is calculated over a user-defined lookback period (default: 5) and scaled by a volatility factor (default: 1.5) to estimate price volatility. A volatility ratio (current volatility vs. average) filters out signals during extreme volatility (>2x average).
Stochastic RSI: A 7-period RSI is smoothed into a Stochastic RSI (5-period stochastic, 2-period SMA) to identify overbought (>85) or oversold (<15) conditions, preventing signals in extreme market states.
Monte Carlo Simulation: 30 price paths are simulated using a geometric Brownian motion model, incorporating drift (based on weighted moving average of returns) and volatility shocks. The simulation estimates the probability of price reaching the target move up or down.
Signal Generation: A buy signal is triggered if the probability of an upward move exceeds the confidence threshold (default: 65%) and the market is not overbought, with volatility within limits. A sell signal is triggered similarly for downward moves.
Purpose: The SPP provides a probabilistic framework to anticipate short-term price movements, reducing reliance on lagging indicators.
Comprehensive Indicator Suite:
Core Logic: This module combines multiple technical indicators to confirm SPP signals and generate independent signals based on momentum, trend, and volume.
Components:
MACD: Uses fast (5-period) and slow (13-period) EMAs to calculate the MACD line, smoothed by a 5-period signal line. A crossover above a threshold (default: 0.0001) indicates bullish momentum, while a crossunder signals bearish momentum.
RSI: A 14-period RSI identifies overbought (>70) or oversold (<30) conditions to filter signals.
Moving Average Crossovers: Fast (5-period) and slow (20-period) EMAs determine trend direction. A bullish crossover (fast > slow) supports buy signals, while a bearish crossover (fast < slow) supports sell signals.
Volume Spikes: Volume exceeding 2x the 50-period average signals significant market activity, enhancing signal reliability.
JKH RSI: A fast 3-period RSI with custom overbought (>80) and oversold (<20) levels provides additional confirmation, reducing false signals in choppy markets.
Sentiment Input: A user-defined sentiment score (-1 to 1) adjusts signal strength, allowing traders to incorporate external market bias (e.g., news or fundamentals).
Signal Generation: A buy signal requires a bullish MACD crossover, RSI oversold, bullish MA crossover, non-overbought JKH RSI, and neutral/positive sentiment. A sell signal requires the opposite conditions.
Signal Strength Calculation:
Logic: Combines SPP probability, RSI deviation, and MACD strength, weighted at 50%, 30%, and 20%, respectively. Sentiment input scales the final strength (0–100).
Formula:
Bullish strength = min(100, (50 * |prob_up - prob_down| / 100 + 30 * |RSI - 50| / 50 + 20 * |MACD_line| / (0.1 * ATR)) * (1 + max(0, sentiment)))
Bearish strength is calculated similarly, using the absolute negative sentiment.
Purpose: Quantifies signal confidence, helping traders prioritize high-probability setups.
Strategy Results and Risk Management
While the script is primarily an indicator, it provides implied trading signals that assume realistic trading conditions:
Assumptions: Signals are designed for short-term trading (1-5 minute charts) with a minimum of 100 trades for statistical significance. The script assumes typical commission (e.g., 0.1% per trade) and slippage (e.g., 0.05%) for liquid markets. Risk per trade is implicitly capped via ATR-based stop-loss levels (2x ATR below/above entry for buy/sell).
Default Settings:
Lookback (5), volatility factor (1.5), and forecast horizon (3) are optimized for short timeframes.
ATR-based stop-loss and profit target levels (2x ATR) provide a risk-reward ratio of approximately 1:1.
Confidence threshold (65%) balances signal frequency and reliability.
Customization: Traders can adjust the ATR multiplier for stop-loss/profit targets or modify the confidence threshold to increase/decrease signal frequency. Lowering the target move (e.g., to 0.2%) or shortening the forecast horizon (e.g., to 2 bars) can tighten risk parameters for scalping.
Guidance: Traders should backtest signals on their specific asset and timeframe, ensuring sufficient trade volume (>100 trades) and incorporating their broker’s commission/slippage. Risk should be limited to 5–10% of equity per trade, adjustable via ATR multiplier or position sizing outside the script.
User Settings and Customization
The script offers extensive user inputs, organized into three groups:
Stochastic Price Predictor Settings:
Lookback Period (default: 5): Controls the period for ATR and returns calculation. Shorter periods increase sensitivity.
Volatility Factor (default: 1.5): Scales ATR for volatility shocks in the Monte Carlo simulation.
Confidence Threshold (default: 65%): Sets the minimum probability for SPP signals.
Stoch RSI Overbought/Oversold Levels (default: 85/15): Filters signals in extreme conditions.
Forecast Horizon (default: 3): Number of bars for price prediction.
Target Move (default: 0.3%): Expected price movement for probability calculation.
Show Predicted Range (default: false): Toggles visibility of the 25th–75th percentile price range.
Comprehensive Indicator Settings:
RSI Length (default: 14), Overbought (70), Oversold (30): Standard RSI parameters.
ATR Length (default: 14): Period for ATR calculation.
Volume Spike Multiplier (default: 2.0): Threshold for detecting volume spikes.
Sentiment Input (default: 0.0, range: -1 to 1): Scales signal strength based on external bias.
MACD Fast/Slow/Signal Lengths (default: 5/13/5), Crossover Threshold (0.0001): Controls MACD sensitivity.
MA Fast/Slow Lengths (default: 5/20): Defines trend direction.
JKH RSI Length (default: 3), Overbought (80), Oversold (20): Fast RSI for confirmation.
Visual Settings:
Show SPP Signals (default: true): Displays SPP buy/sell labels.
Show Comp Signals (default: true): Displays comprehensive indicator signals.
Highlight Volume Spikes (default: true): Highlights bars with significant volume.
Show ATR Levels (default: true): Plots stop-loss and profit-target lines.
Impact: Adjusting lookback periods or thresholds affects signal frequency and sensitivity. For example, lowering the confidence threshold increases signals but may reduce accuracy, while increasing the volatility factor amplifies price path variability.
Visualizations and Chart Setup
The script plots clear, relevant elements on the chart to aid decision-making:
Trend Line: Plots the close price, colored green (bullish, fast MA > slow MA), red (bearish), or orange (neutral).
SPP Signals: Green "BUY (SPP)" labels below bars and red "SELL (SPP)" labels above bars when conditions are met.
Predicted Range: Optional blue step lines showing the 25th–75th percentile price range from the Monte Carlo simulation, with a semi-transparent fill.
Comprehensive Signals:
Blue upward triangles for bullish MACD crossovers, orange downward triangles for bearish crossovers.
Green circles above bars for RSI overbought, red circles below for oversold.
Green "BUY (Comp)" labels (offset by 1x ATR below) and red "SELL (Comp)" labels (offset by 1x ATR above) for comprehensive signals.
Green upward triangles for bullish MA crossovers, red downward triangles for bearish crossovers.
Volume Spikes: Yellow background highlights bars with volume >2x the 50-period average.
ATR Levels: Purple dotted lines for stop-loss (close - 2x ATR) and profit target (close + 2x ATR).
Moving Averages: Fast MA (blue, 5-period) and slow MA (red, 20-period) for trend reference.
Clarity: Only relevant elements are plotted, ensuring traders can quickly identify trends, signals, and risk levels without clutter.

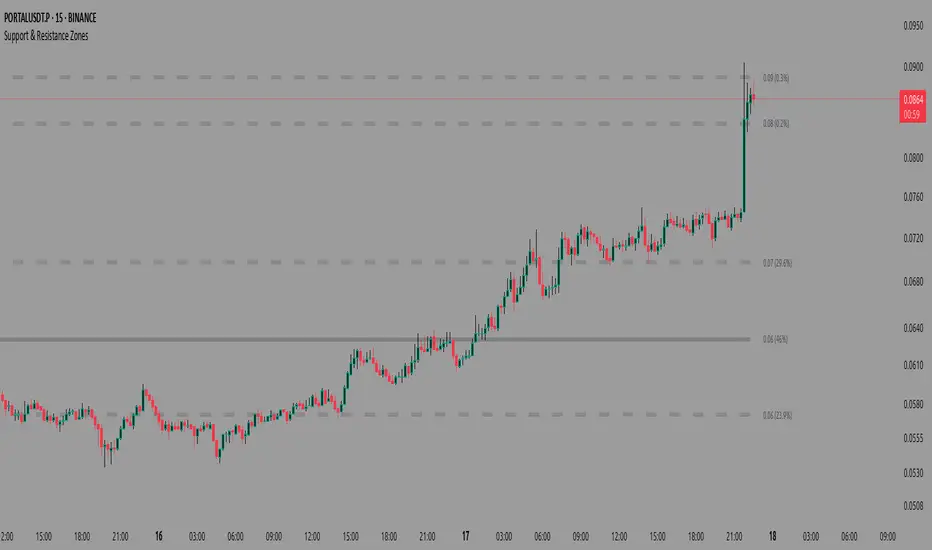
Support & Resistance ZonesAdvanced Support & Resistance Detection Algorithm
This indicator identifies meaningful price levels by analyzing market structure using a proprietary statistical approach. Unlike traditional methods that rely on simple swing highs/lows or moving averages, this system dynamically detects zones where price has shown consistent interaction, revealing true areas of supply and demand.
Core Methodology
Price Data Aggregation
Collects highs and lows over a configurable lookback period.
Normalizes price data to account for volatility, ensuring levels remain relevant across different market conditions.
Statistical Significance Filtering
Rejection of random noise: Eliminates insignificant price fluctuations using adaptive thresholds.
Volume-weighted analysis (implied): Stronger reactions at certain price levels are given higher priority, even if volume data is unavailable.
Dynamic Level Extraction
Density-based S/R Zones: Instead of fixed swing points, the algorithm identifies zones where price has repeatedly consolidated.
Time decay adjustment: Recent price action has more influence, ensuring levels adapt to evolving market structure.
Strength Quantification
Each level is assigned a confidence score based on:
Touch frequency: How often price revisited the zone.
Reaction intensity: The magnitude of bounces/rejections.
Time relevance: Whether the level remains active or has been broken decisively.
Adaptive Level Merging & Pruning
Proximity-based merging: If two levels are too close (within a volatility-adjusted threshold), they combine into one stronger zone.
Decay mechanism: Old, untested levels fade away if price no longer respects them.
Why This Approach Works Better Than Traditional Methods
✅ No subjective drawing required – Levels are generated mathematically, removing human bias.
✅ Self-adjusting sensitivity – Works equally well on slow and fast-moving markets.
✅ Focuses on statistically meaningful zones – Avoids false signals from random noise.
✅ Non-repainting & real-time – Levels only update when new data confirms their validity.
How Traders Can Use These Levels
Support/Resistance Trading: Fade bounces off strong levels or trade breakouts with confirmation.
Confluence with Other Indicators: Combine with RSI, MACD, or volume profiles for higher-probability entries.
Stop Placement: Place stops just beyond key levels to avoid premature exits.
Technical Notes (For Advanced Users)
The algorithm avoids overfitting by dynamically adjusting zones sensitivity based on market conditions.
Unlike fixed pivot points, these levels adapt to trends, making them useful in both ranging and trending markets.
The strength percentage helps filter out weak levels—only trade those with a high score for better accuracy.
Note: Script takes some time to load.
Goldman Sachs Risk Appetite ProxyRisk appetite indicators serve as barometers of market psychology, measuring investors' collective willingness to engage in risk-taking behavior. According to Mosley & Singer (2008), "cross-asset risk sentiment indicators provide valuable leading signals for market direction by capturing the underlying psychological state of market participants before it fully manifests in price action."
The GSRAI methodology aligns with modern portfolio theory, which emphasizes the importance of cross-asset correlations during different market regimes. As noted by Ang & Bekaert (2002), "asset correlations tend to increase during market stress, exhibiting asymmetric patterns that can be captured through multi-asset sentiment indicators."
Implementation Methodology
Component Selection
Our implementation follows the core framework outlined by Goldman Sachs research, focusing on four key components:
Credit Spreads (High Yield Credit Spread)
As noted by Duca et al. (2016), "credit spreads provide a market-based assessment of default risk and function as an effective barometer of economic uncertainty." Higher spreads generally indicate deteriorating risk appetite.
Volatility Measures (VIX)
Baker & Wurgler (2006) established that "implied volatility serves as a direct measure of market fear and uncertainty." The VIX, often called the "fear gauge," maintains an inverse relationship with risk appetite.
Equity/Bond Performance Ratio (SPY/IEF)
According to Connolly et al. (2005), "the relative performance of stocks versus bonds offers significant insight into market participants' risk preferences and flight-to-safety behavior."
Commodity Ratio (Oil/Gold)
Baur & McDermott (2010) demonstrated that "gold often functions as a safe haven during market turbulence, while oil typically performs better during risk-on environments, making their ratio an effective risk sentiment indicator."
Standardization Process
Each component undergoes z-score normalization to enable cross-asset comparisons, following the statistical approach advocated by Burdekin & Siklos (2012). The z-score transformation standardizes each variable by subtracting its mean and dividing by its standard deviation: Z = (X - μ) / σ
This approach allows for meaningful aggregation of different market signals regardless of their native scales or volatility characteristics.
Signal Integration
The four standardized components are equally weighted and combined to form a composite score. This democratic weighting approach is supported by Rapach et al. (2010), who found that "simple averaging often outperforms more complex weighting schemes in financial applications due to estimation error in the optimization process."
The final index is scaled to a 0-100 range, with:
Values above 70 indicating "Risk-On" market conditions
Values below 30 indicating "Risk-Off" market conditions
Values between 30-70 representing neutral risk sentiment
Limitations and Differences from Original Implementation
Proprietary Components
The original Goldman Sachs indicator incorporates additional proprietary elements not publicly disclosed. As Goldman Sachs Global Investment Research (2019) notes, "our comprehensive risk appetite framework incorporates proprietary positioning data and internal liquidity metrics that enhance predictive capability."
Technical Limitations
Pine Script v6 imposes certain constraints that prevent full replication:
Structural Limitations: Functions like plot, hline, and bgcolor must be defined in the global scope rather than conditionally, requiring workarounds for dynamic visualization.
Statistical Processing: Advanced statistical methods used in the original model, such as Kalman filtering or regime-switching models described by Ang & Timmermann (2012), cannot be fully implemented within Pine Script's constraints.
Data Availability: As noted by Kilian & Park (2009), "the quality and frequency of market data significantly impacts the effectiveness of sentiment indicators." Our implementation relies on publicly available data sources that may differ from Goldman Sachs' institutional data feeds.
Empirical Performance
While a formal backtest comparison with the original GSRAI is beyond the scope of this implementation, research by Froot & Ramadorai (2005) suggests that "publicly accessible proxies of proprietary sentiment indicators can capture a significant portion of their predictive power, particularly during major market turning points."
References
Ang, A., & Bekaert, G. (2002). "International Asset Allocation with Regime Shifts." Review of Financial Studies, 15(4), 1137-1187.
Ang, A., & Timmermann, A. (2012). "Regime Changes and Financial Markets." Annual Review of Financial Economics, 4(1), 313-337.
Baker, M., & Wurgler, J. (2006). "Investor Sentiment and the Cross-Section of Stock Returns." Journal of Finance, 61(4), 1645-1680.
Baur, D. G., & McDermott, T. K. (2010). "Is Gold a Safe Haven? International Evidence." Journal of Banking & Finance, 34(8), 1886-1898.
Burdekin, R. C., & Siklos, P. L. (2012). "Enter the Dragon: Interactions between Chinese, US and Asia-Pacific Equity Markets, 1995-2010." Pacific-Basin Finance Journal, 20(3), 521-541.
Connolly, R., Stivers, C., & Sun, L. (2005). "Stock Market Uncertainty and the Stock-Bond Return Relation." Journal of Financial and Quantitative Analysis, 40(1), 161-194.
Duca, M. L., Nicoletti, G., & Martinez, A. V. (2016). "Global Corporate Bond Issuance: What Role for US Quantitative Easing?" Journal of International Money and Finance, 60, 114-150.
Froot, K. A., & Ramadorai, T. (2005). "Currency Returns, Intrinsic Value, and Institutional-Investor Flows." Journal of Finance, 60(3), 1535-1566.
Goldman Sachs Global Investment Research (2019). "Risk Appetite Framework: A Practitioner's Guide."
Kilian, L., & Park, C. (2009). "The Impact of Oil Price Shocks on the U.S. Stock Market." International Economic Review, 50(4), 1267-1287.
Mosley, L., & Singer, D. A. (2008). "Taking Stock Seriously: Equity Market Performance, Government Policy, and Financial Globalization." International Studies Quarterly, 52(2), 405-425.
Oppenheimer, P. (2007). "A Framework for Financial Market Risk Appetite." Goldman Sachs Global Economics Paper.
Rapach, D. E., Strauss, J. K., & Zhou, G. (2010). "Out-of-Sample Equity Premium Prediction: Combination Forecasts and Links to the Real Economy." Review of Financial Studies, 23(2), 821-862.

NY Reversal Pattern StatsThe NY Reversal Pattern Stats indicator is a tool for identifying and analyzing specific price action patterns that occur during the New York trading session. Its goal is to highlight potential reversal or continuation opportunities that may arise from market manipulation or shifts in volatility within this key market window. Beyond simply identifying patterns, the indicator provides valuable historical statistics on their performance, helping traders evaluate their effectiveness.
Key Features
New York Session Highlighting: Clearly visualizes the defined New York trading session directly on your chart.
Automated Pattern Detection: Automatically detects two types of patterns within the New York session:
Manipulation Wick: Identifies instances where price attempts to push significantly beyond a recent session extreme but is rejected, resulting in a wick with the close returning to the original side.
Low Volatility Reversal: Detects price interaction with a recent session extreme where the resulting candle shows lower-than-average volatility, suggesting potential exhaustion or a reversal point.
Pattern Confirmation Tracking: Tracks whether a detected pattern leads to a follow-through move based on a defined confirmation rule (currently, price returning to the session midpoint).
Comprehensive Statistics Table: Displays a detailed table on the chart summarizing:
Total patterns observed.
Number of patterns that were confirmed.
Success and failure rates.
Maximum losing streak.
Statistical relevance metrics (Sigma, Z-Score, P-value) to help assess if the observed success rate is likely due to chance.
A clear description interpreting the statistical relevance and pattern performance (more often right/wrong).
Customizable Visuals: Allows users to control the appearance of the session background and pattern labels.
Alerts: Provides options to set alerts when a new pattern is detected or when a detected pattern is confirmed.
How to Use the Indicator
Add to Chart: Apply the "NY Reversal Pattern Stats" indicator to your desired chart in TradingView.
Configure Inputs: Open the indicator's settings to customize the parameters:
Session Time Definition: Set the exact start hour, minute, and duration (in hours) for the New York session you wish to analyze. Use the "NY Time" inputs (e.g., 6:00 AM - 10:00 AM for Indices, 5:00 AM - 9:00 AM for Forex). The indicator uses the "America/New_York" timezone to handle Daylight Saving Time.
NY Session Visuals: Choose whether to display the session background and pattern labels, and customize their colors.
Pattern Detection: Adjust the sensitivity of the Manipulation Wick threshold and configure the settings for the Low Volatility Reversal pattern detection (enable/disable, ATR length, volatility factor).
Confirmation: Enable or disable the session midpoint confirmation criterion.
Show Statistics Table: Toggle the visibility of the statistics table.
Interpret the Chart: Observe the highlighted New York session windows and the labels indicating detected and confirmed patterns.
Analyze the Statistics Table: Refer to the statistics table for historical performance data.
Total Patterns: Indicates the sample size. More patterns generally lead to more statistically reliable results.
Confirmed/Failed: Shows the raw counts of successful and unsuccessful patterns based on the confirmation rule.
Success/Fail Rate (%): Provides the percentage of patterns that met or did not meet the confirmation criterion.
Statistical Relevance: Read the description provided in the table. It interprets the Z-Score and sample size to tell you if the observed success rate is statistically significant (i.e., unlikely to be just random chance).
Pattern Performance: Read the description indicating whether the pattern has historically been "More often right than wrong" or "More often wrong than right" based on the success rate.
Sigma / Z-Score / P-value: These are standard statistical measures. A higher absolute Z-Score and a lower P-value (especially below 0.05 or 0.01) suggest stronger statistical evidence that the pattern's success rate is different from a random 50/50 outcome.
Set Alerts: If desired, configure alerts to be notified when patterns are detected or confirmed, allowing you to potentially take action in real-time.
Interpretation of Results
High Success Rate + High Statistical Relevance: This combination suggests the detected pattern, as defined and confirmed by the indicator, has historically shown a consistent edge within the specified New York session window, and this performance is unlikely due to random chance.
High Success Rate + Low Statistical Relevance: The pattern has performed well in the observed data, but the sample size might be too small for high confidence that this performance will continue.
Low Success Rate + High Statistical Relevance: The pattern, as defined, has historically shown a tendency to fail more often than succeed, and this underperformance is statistically significant.
Low Statistical Relevance (Regardless of Success Rate): The sample size is insufficient to draw strong conclusions about the pattern's effectiveness. More historical data is needed.
Remember that past performance is not indicative of future results. Statistical analysis provides insights into historical tendencies, but trading decisions should always involve a comprehensive analysis and risk management plan.
Limitations
Timeframe Dependency: The pattern detection and session high/low accumulation operate on the chart's current timeframe. It does not specifically analyze only the 4-hour candles as might be implied by "4H Candle Profiling Patterns".
Confirmation Criterion: The confirmation rule is fixed to price returning to the session midpoint. If your strategy uses a different confirmation or target, this indicator's statistics may not directly reflect its performance.
No London/Asia Filter: The indicator does not check the performance or characteristics of the London or Asia sessions to filter for instances where "London and Asia Fail".
Potential Timezone Compiler Issues: While the code uses standard v6 timezone handling, some specific TradingView environments may exhibit unexpected behavior with timezone strings, potentially affecting the precise timing of the session boundaries.
This indicator is a powerful tool for analyzing specific price action patterns during the New York session. By understanding its inputs, outputs, and limitations, traders can gain valuable insights into potential trading opportunities.
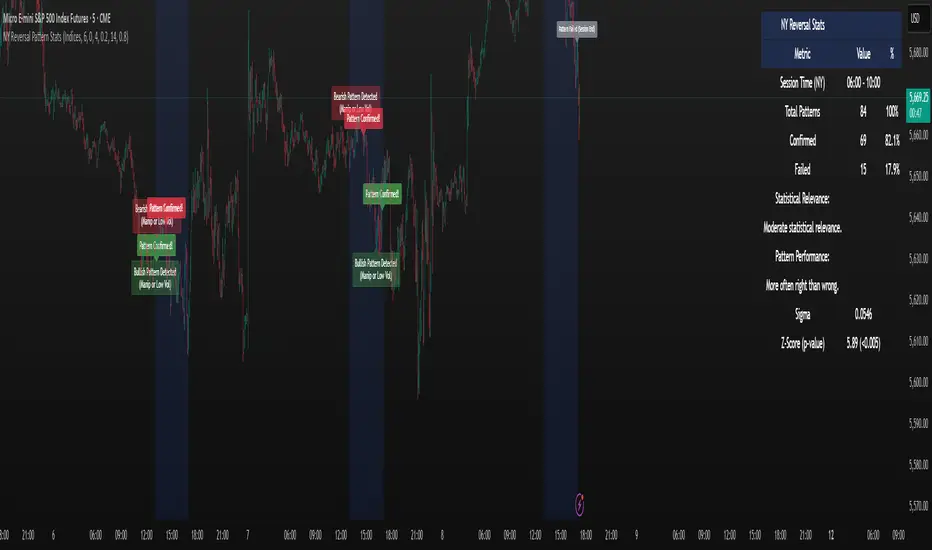
GEX and OI levelsIntroduction
Harness the power of institutional options flow analysis with the GEX & OI Levels indicator – an advanced tool that brings professional-grade options analytics directly to your TradingView charts. This comprehensive indicator visualizes Gamma Exposure (GEX) and Open Interest (OI) data, revealing hidden market forces that drive price action and potential reversal points. Designed for serious traders who understand that options positioning often precedes price movement.
What Is GEX & OI Levels?
GEX & OI Levels is a sophisticated indicator that analyzes options market positioning through the lens of dealer gamma exposure and open interest concentration. By visualizing where market makers must hedge their options positions, you can identify potential support/resistance levels, price magnets, and likely volatility zones. The indicator processes strike-by-strike options data to generate actionable insights about institutional positioning and potential price behavior.
Key Features
Complete Gamma Exposure Analysis
Dynamic GEX histogram showing dealer positioning at each strike
Visual identification of positive and negative gamma zones
Smoothed total GEX calculation with customizable parameters
Zero gamma level identification - critical price points where dealer behavior changes
Critical Price Level Identification
Gamma flip points that often act as magnets for price
Gamma walls where significant hedging activity may create support/resistance
Golden strike detection where both call and put OI show unusual concentration
Max pain calculation showing the price point where options expiration causes maximum loss
Dealer Positioning Intelligence
Analysis of dealer hedging requirements for price movements
Calculation of expected dealer behavior during rallies and dips
Signal strength indicators showing potential hedging impact
Delta-adjusted GEX for more accurate near-expiration analysis
Comprehensive Data Visualization
Highly configurable visualization of GEX histogram with logarithmic scaling
Strike-by-strike data table with color-coded gamma values
Top OI levels for both calls and puts with customizable highlighting
Detailed metrics panel showing all key GEX and options analytics
Use Cases
1. Identifying Potential Price Magnets
Gamma flip points often act as magnets for price, especially near expiration
Zero gamma levels show where dealer hedging pressure changes direction
Golden strikes reveal where both call and put sellers have significant exposure
2. Discovering Support & Resistance Zones
Gamma walls indicate where dealer hedging may create price barriers
Top OI levels often become psychological support/resistance points
Max pain level shows where options writers have incentive to push price
3. Predicting Market Volatility
Low GEX environments signal potential for increased volatility
High GEX environments typically lead to price compression and reduced volatility
Dealer positioning metrics indicate whether market makers are dampening or amplifying moves
4. Timing Market Reversals
Extreme dealer positioning often precedes market reversals
Proximity to flip points provides timing signals for potential turns
Signal strength measurement helps quantify the potential impact
5. Enhancing Trading Strategy
Align your trades with or against dealer hedging flows
Use dealer positioning analysis to set more precise stop losses and targets
Combine with technical analysis for high-probability trading setups
Customization Options
The indicator offers extensive customization capabilities:
Data Input & Configuration
CSV data input for option chain information
Adjustable DTE (Days To Expiration) settings
Risk-free rate and implied volatility parameters
Custom symbol formatting for different data providers
Calculation Settings
Gamma weight multiplier for sensitivity adjustment
Strike range limitations to focus on relevant price zones
Gamma scaling options based on strike distance
Static IV mode for environments without option price data
Visualization Options
Customizable histogram appearance including scale and transparency
Color settings for positive/negative GEX, flip points, and gamma walls
OI level display with configurable number of levels
Strike data table with adjustable strike count
Analytics Settings
Delta-adjusted GEX for improved accuracy
Dealer positioning analytics with hedge efficiency parameters
Alerting capabilities for price approaching key levels
Golden strike highlighting for significant option activity zones
How to Use
Apply the indicator to your chart
Input your options data in CSV format using the required structure
Configure the expiration date to match your analysis timeframe
Adjust gamma calculation parameters based on your instrument
Use the GEX histogram and key levels to identify potential price targets
Monitor dealer positioning metrics to anticipate market behavior
Trade with confidence knowing where institutional hedging activity is concentrated
Perfect for options traders, futures traders, swing traders, and anyone who wants to incorporate institutional-level options analysis into their technical trading strategy.
Elevate your trading with GEX & OI Levels - where options positioning reveals future price action.

Supply and Demand Order Blocks - Nadeem Al-QahwiThis advanced order block detection system identifies key supply and demand zones on your chart using a proprietary multi-factor algorithm. Unlike basic implementations that only look for engulfing patterns, this indicator incorporates price momentum, volume confirmation, and swing point analysis to filter out false signals and highlight only the most significant trading zones.
Unique Features
Dual Detection System:
Identifies both internal order blocks (within trends) and swing order blocks (at market turns)
Separate customization for each type allows focused analysis
Smart Zone Validation:
Dynamic strength calculation based on price rejection intensity
Timeframe-sensitive filtering (automatically adjusts for different chart intervals)
Minimum price movement threshold to eliminate insignificant zones
Advanced Visualization:
Three display modes (Boxes & Levels, Boxes Only, Levels Only)
Gradient coloring system showing zone strength intensity
Configurable midline markers for precise entry/exit planning
Methodology
The indicator scans the specified lookback period for:
Bullish Order Blocks: Last bearish candle before a sustained upward move
Bearish Order Blocks: Last bullish candle before a sustained downward move
Each potential zone is evaluated using:
Price Action Confirmation:
Minimum required price move (configurable as percentage)
Consecutive closes beyond the order block range
Volume Analysis (implied through price movement):
Significant expansion beyond the zone
Sustained momentum after breakout
Zone Quality Filters:
Overlap prevention (merges similar zones)
Strength ranking system (prioritizes zones with strongest reactions)
Usage Instructions
Primary Settings:
Adjust lookback period (default 500 bars)
Select display style based on your trading needs
Zone Customization:
Internal Order Blocks: Best for trending markets
Swing Order Blocks: Ideal for reversal trading
Configure colors and styles for visual clarity
Advanced Filters:
Minimum price move: Increase for higher timeframes
Overlap threshold: Adjust based on market volatility
Strength filter: Focus only on high-probability zones
Trading Applications
Trend Trading: Use internal order blocks as continuation signals
Reversal Trading: Swing order blocks mark potential turning points
Risk Management: Zone boundaries serve as natural stop levels
Multiple Timeframe Analysis: Combine settings for different chart intervals
Originality Statement
This implementation differs from basic order block indicators through:
Proprietary strength calculation algorithm
Adaptive timeframe filtering
Intelligent zone merging technology
Configurable display system for personalized charting
While the concept of order blocks is not novel, this particular implementation adds significant value through its sophisticated filtering mechanisms and customizable visualization options that aren't available in open-source alternatives.

Z-Score Normalized VIX StrategyThis strategy leverages the concept of the Z-score applied to multiple VIX-based volatility indices, specifically designed to capture market reversals based on the normalization of volatility. The strategy takes advantage of VIX-related indicators to measure extreme levels of market fear or greed and adjusts its position accordingly.
1. Overview of the Z-Score Methodology
The Z-score is a statistical measure that describes the position of a value relative to the mean of a distribution in terms of standard deviations. In this strategy, the Z-score is calculated for various volatility indices to assess how far their values are from their historical averages, thus normalizing volatility levels. The Z-score is calculated as follows:
Z = \frac{X - \mu}{\sigma}
Where:
• X is the current value of the volatility index.
• \mu is the mean of the index over a specified period.
• \sigma is the standard deviation of the index over the same period.
This measure tells us how many standard deviations the current value of the index is away from its average, indicating whether the market is experiencing unusually high or low volatility (fear or calm).
2. VIX Indices Used in the Strategy
The strategy utilizes four commonly referenced volatility indices:
• VIX (CBOE Volatility Index): Measures the market’s expectations of 30-day volatility based on S&P 500 options.
• VIX3M (3-Month VIX): Reflects expectations of volatility over the next three months.
• VIX9D (9-Day VIX): Reflects shorter-term volatility expectations.
• VVIX (VIX of VIX): Measures the volatility of the VIX itself, indicating the level of uncertainty in the volatility index.
These indices provide a comprehensive view of the current volatility landscape across different time horizons.
3. Strategy Logic
The strategy follows a long entry condition and an exit condition based on the combined Z-score of the selected volatility indices:
• Long Entry Condition: The strategy enters a long position when the combined Z-score of the selected VIX indices falls below a user-defined threshold, indicating an abnormally low level of volatility (suggesting a potential market bottom and a bullish reversal). The threshold is set as a negative value (e.g., -1), where a more negative Z-score implies greater deviation below the mean.
• Exit Condition: The strategy exits the long position when the combined Z-score exceeds the threshold (i.e., when the market volatility increases above the threshold, indicating a shift in market sentiment and reduced likelihood of continued upward momentum).
4. User Inputs
• Z-Score Lookback Period: The user can adjust the lookback period for calculating the Z-score (e.g., 6 periods).
• Z-Score Threshold: A customizable threshold value to define when the market has reached an extreme volatility level, triggering entries and exits.
The strategy also allows users to select which VIX indices to use, with checkboxes to enable or disable each index in the calculation of the combined Z-score.
5. Trade Execution Parameters
• Initial Capital: The strategy assumes an initial capital of $20,000.
• Pyramiding: The strategy does not allow pyramiding (multiple positions in the same direction).
• Commission and Slippage: The commission is set at $0.05 per contract, and slippage is set at 1 tick.
6. Statistical Basis of the Z-Score Approach
The Z-score methodology is a standard technique in statistics and finance, commonly used in risk management and for identifying outliers or unusual events. According to Dumas, Fleming, and Whaley (1998), volatility indices like the VIX serve as a useful proxy for market sentiment, particularly during periods of high uncertainty. By calculating the Z-score, we normalize volatility and quantify the degree to which the current volatility deviates from historical norms, allowing for systematic entry and exit based on these deviations.
7. Implications of the Strategy
This strategy aims to exploit market conditions where volatility has deviated significantly from its historical mean. When the Z-score falls below the threshold, it suggests that the market has become excessively calm, potentially indicating an overreaction to past market events. Entering long positions under such conditions could capture market reversals as fear subsides and volatility normalizes. Conversely, when the Z-score rises above the threshold, it signals increased volatility, which could be indicative of a bearish shift in the market, prompting an exit from the position.
By applying this Z-score normalized approach, the strategy seeks to achieve more consistent entry and exit points by reducing reliance on subjective interpretation of market conditions.
8. Scientific Sources
• Dumas, B., Fleming, J., & Whaley, R. (1998). “Implied Volatility Functions: Empirical Tests”. The Journal of Finance, 53(6), 2059-2106. This paper discusses the use of volatility indices and their empirical behavior, providing context for volatility-based strategies.
• Black, F., & Scholes, M. (1973). “The Pricing of Options and Corporate Liabilities”. Journal of Political Economy, 81(3), 637-654. The original Black-Scholes model, which forms the basis for many volatility-related strategies.

Waves and Harmonic Patterns by BULL┃NETThe B | N WAHA (Waves and Harmonic Patterns by BULL | NET)
indicator provides traders using CFD brokers with the most significant price and time events from the stock exchange of the underlying original index or security. For example traders are able to easily identify the price at the Daily Open and Close time of up to three additional stock exchanges. Traders can choose from a huge list of options including the values from the current and previous Day, Week, Month and Year. In addition traders can enable the display of the Expected Move by either implied or historical volatility. The indicator can show Open Gaps (gap between close and open of two trading sessions) also which traders would usually see only on the original chart of an index or security.
The B | N WAHA indicator can help traders to make better entry decisions based on the real market sessions.
█ ⚠️ DISCLAIMER – READ BEFORE YOU USE ⚠️
█ FEATURES
— PATTERN OPTIONS
● Deviation for ratio calculation
Any pattern has a unique set of ratios for different retracements. In a perfect world each ratio would be hit exactly. But the stock market is far from perfect and especially in volatile markets ratios have to be adjusted. The default is 5%. The maximum is 10%
● (Name of pattern)
The list of patters recognized will grow with new versions of the indicator. The settings for each pattern are the same.
Each available pattern will be recognized and drawn by default. If you disable the checkbox in front of the pattern name the indicator will ignore this pattern completely no matter if another checkbox for this pattern is active.
● Developing
As soon as a new possible pattern is recognized, the indicator will draw a label at the starting point (0, A or X) of the pattern. For the indicator “possible” means there is only the last point missing, which is D in case of ABCD and XABCD patterns. Once the last point has reached the completion price range, the indicator will draw the pattern. If you enable this checkbox the indicator will draw a zickzack line between the already existing points.
● Projection
If there is a new possible pattern the indicator will draw a projection box to indicate the price range where the final point has to be located for completion of the pattern. Don’t confuse this with a buy or sell signal! The appearance of the box doesn’t tell anything about the chance of a pattern to get completed. It simply tells you that the price has to reach the box and to retrace within the box to form a valid pattern. This allows you to prepare a strategy if the price hits the box. If you disable the checkbox no box will be drawn.
● History
For backtesting or learning purpose you can display all historical occurrences of a pattern. Best practice is to disable all other patterns and enable the history checkbox only together with the checkbox of the patten name.
— PIVOPOINT OPTIONS
To identify patterns you need pivot points. True high and lows in the chart. If you use B | N GABO or B | N DESC you already know about this concept. The indicator is using three different levels of pivot points in parallel for better detection of patterns.
● Level 1
This is the fast running pivot level. You can choose from 2 to 4. Default is 3.
● Level 2
This is the pivot level with medium pace. Selectable levels are 5 to 9. Default is 5.
● Level 3
This is the slow running pivot level. The minimum level is 10, the maximum is 20. The default is 15.
● Pivotpoints
By default pivot points are not displayed on the chart because this ads a lot of noise. For backtesting and learning purposes you can enable this option.
● Label
● Text
● Size
This three settings define the appearance of the pivot points.
— HARMONIC PATTERN OPTIONS
The settings in this section control how the zickzack line of a pattern gets drawn on the chart. The settings for bullish and bearish pattern are identical.
● Show bullish/bearish pattern
By default both types of patterns are drawn on the chart. For backtesting or learning purpose you can disable it.
● Line
The color of the zickzack lines.
● ABC
The line style to connect points A, B and C.
● CD
The line style to connect points C and D.
● (Line Width)
The width of lines ABC and CD.
● Label
The color of the label for a completed pattern. This label marks starting point.
● Developing
The color of the label while a pattern is developing.
● Text
The color of the text in the label.
● (Text size)
The size of the text.
— HARMONIC PATTERN LABEL OPTIONS
The label which marks the start of a pattern can contain multiple information. To reduce noise on the chart you can disable each information separately. If you disable them all, the label will display the designation of the pattern starting point, e.g. “A” for an ABCD or “X” for an XABCD.
● Title
The title identifies the type of pattern. E.g. a possibly developing ABCD pattern will display ABC at the beginning to denote the point A, B and C have been detected. If this pattern completes the title would change to ABCD in case of a standard ABCD pattern or to AB=CD if the pattern matches all criteria needed for this ‘perfect’ type of ABCD.
● Number
Each pattern carries a unique number needed to identify the projection and targets in case there are multiple patterns in parallel.
● Ratio
First this is the retracement level of point C from point B toward point A. It is the decimal value of the percentage. In a perfect world this would be 0.618 (61.8%). In volatile markets this can be as low as 0.382 and as high as 0.786. If Ratio is enabled BD ratio will get displayed as well once point D is about to complete a ABCD pattern.
● Tooltip
Enabled by default the tooltip shows all the information and more if you hover the mouse pointer over the label.
● Perfect
If the pattern is formed “perfect” it will change its color to denote a possibly strong trend reversal. E.g. a perfect AB=CD is formed if the time and price difference between A and B is equal to the time and price difference between C and D. The calculation contains a 5% deviation to reflect usual market conditions.
— PROJECTION OPTIONS
If the “Projection” checkbox of a pattern is enabled (See PATTERN OPTIONS) the indicator will display the price range where the final point must sit to form a valid pattern. You can customize the box that marks this price range or disable it at all.
● Bull / Bear
The color of the box border.
● (Style)
The line style of the box border.
● Background
The background color of the box.
● Text
The color of the text in the box.
● (Text size)
The size of the text.
— PROJECTION DESCRIPTION OPTIONS
The box which marks the possible landing zone for pattern completion can contain multiple information. To reduce noise on the chart you can disable each information separately.
● Price Range
To complete a pattern successfully point D needs to be located within the minimum and maximum price of the range. For bullish pattern the price range is increasing (e.g. 100 – 120) and for bearish pattern it is decreasing (e.g. 100 – 80).
● Title
The title identifies the type of pattern. E.g. a possibly developing ABCD pattern will display ABC at the beginning to denote the point A, B and C have been detected. If this pattern completes the title would change to ABCD in case of a standard ABCD pattern or to AB=CD if the pattern matches all criteria needed for this ‘perfect’ type of ABCD.
● Number
Each pattern carries a unique number needed to identify the projection and targets in case there are multiple patterns in parallel.
— TARGET OPTIONS
● Display ABCD Targets
Once a pattern is completed the indicator will display multiple price lines for targets or other important price levels. This is enabled by default.
The cosmetic setting are separated for bullish and bearish pattern targets. However they are identical.
● Bull / Bear Line
The color of the target lines.
● (Line style)
The style of the target lines.
● Label
The color of the label which contains information about the target.
● Text
The color of the text in the label.
● (Text size)
The size of the text.
— TARGET LABEL OPTIONS
The target label can contain multiple information. To reduce noise on the chart you can disable each information separately. If you disable all information a blank label will be displayed necessary to hold the tooltip.
● Price
The target price.
● Number
The unique number of the pattern.
● Title
The target identifier.
● Direction
New traders often get confused with bullish and bearish pattern. A small arrow facing down or up will tell them the expected price move to reach the targets.
● Tooltip
If enabled the tooltip shows all the information and more if you hover the mouse pointer over the label.
● Remove if hit
By default target lines and labels will get removed one bar after the price has hit the target. If you disable this option target lines will stay together with the pattern until it gets invalidated.
— DISPLAY OPTIONS
● 2 Decimals
To streamline the appearance of prices they are set to display two decimals only. Numbers get rounded! However, trading currency pairs or crypto assets might need to display the full amount of decimals. In this case simply disable the setting “2 Decimals”.
— ALERT OPTIONS
Bevor you can use alerts in TradingView you have to activate them.
1. Click on the alert button
2. From the first drop down in conditions select B | N WAHA
3. From the third drop down (the one below the first one) select Any alert() function call
4. Skip the expiration if you want the alerts to be active for ever
5. Give The Alert a name or keep the default
6. Click on create
You have to repeat this procedure in every timeframe you use. This is not a limitation of the indicator. This is how TradingView alerts work.
Now you can select the events in the alert options of B | N WAHA you want to get noticed about. Alerts get fired when a bar gets confirmed which is the last close of a bar.
-------------------------------------------------------
Disclaimer BullNet: The information provided in this document is for educational and informational purposes only and does not constitute financial, investment, or trading advice. Any use of the content is at your own risk. No liability is assumed for any losses or damages resulting from reliance on this information. Trading financial instruments involves significant risks, including the potential loss of all invested capital. There is no guarantee of profits or specific outcomes. Please conduct your own research and consult a professional financial advisor if needed.
Disclaimer TradingView: According to the www.tradingview.com
Copyright: 2025-BULLNET - All rights reserved.
Roadmap:
Version 1.0 03.03.2025

ATR 3x Multiplier StrategyBeta version
Volatility and Candle Spikes in Trading
Volatility
Volatility refers to the degree of variation in the price of a financial asset over time. It measures how much the price fluctuates and is often associated with risk and uncertainty in the market. High volatility means larger price swings, while low volatility indicates more stable price movements.
Key aspects of volatility:
Measured using indicators like Average True Range (ATR), Bollinger Bands, and Implied Volatility (IV).
Influenced by factors such as market news, economic events, and liquidity.
Higher volatility increases both risk and potential profit opportunities.
Candle Spikes
A candle spike (or wick) refers to a sudden price movement that forms a long shadow or wick on a candlestick chart. These spikes can indicate strong buying or selling pressure, liquidity hunts, or stop-loss triggers.
Types of candle spikes:
Bullish Spike (Long Lower Wick): Indicates buyers rejected lower prices, pushing the price higher.
Bearish Spike (Long Upper Wick): Suggests sellers rejected higher prices, pushing the price lower.
Stop-Loss Hunt: Market makers may trigger stop-losses by creating artificial spikes before reversing the price.
News-Induced Spikes: Economic data releases or unexpected events can cause sudden price jumps.
Understanding volatility and candle spikes can help traders manage risk, spot entry/exit points, and avoid false breakouts. 🚀📈

Black-Scholes Probability Model with Time-Based VolatilityI developed this tool to automate probability calculations and to verify if Polymarkets accurately reflects Bitcoin's value. The indicator uses a modified Black-Scholes model to estimate the likelihood of Bitcoin exceeding or falling below a $97,000 strike price by a specified end date, providing a "fair value" probability.
Key Features:
- Timeframe Control: Displays data only between a defined start and end date, ensuring relevance during the prediction period.
- Dynamic Volatility Calculation: Offers a choice between manual input and auto-calculated annualized volatility. The auto-calculation derives historical volatility from recent price data over a selected lookback period and adjusts it based on the time remaining until expiration. More time implies greater expected price movement; less time indicates a narrower expected range.
- Probability Estimation: Calculates an adjusted parameter (d1) and applies a normal cumulative distribution function (CDF) to determine:
- "Yes" (Green Line): Probability that Bitcoin will exceed $97,000.
- "No" (Red Line): Probability that Bitcoin will remain below $97,000.
When Bitcoin's price is exactly $97,000, the tool sets the probabilities to a balanced 50/50 split, indicating fair value.
- Fair Value Indicator: Includes a static white reference line at 50% probability. A 50/50 probability suggests Bitcoin is fairly valued at $97,000; deviations indicate potential overvaluation or undervaluation.
- Polymarkets Tracking & Trading Strategy: I use Polymarkets to access cost-effective, high-leverage long call options on Bitcoin. However, these options don't always mirror Bitcoin's price movements precisely. For instance, if I anticipate Bitcoin rising from $95,000 to $97,000 by day's end, the tool might show a fair value probability of 50%. If Polymarkets quotes a 50% chance, the alignment indicates a fair trade. In such cases, I can avoid an unfavorable trade or exploit the difference as an arbitrage opportunity.
- Personal Motivation: This indicator eliminates the need for manual calculations and ensures I can quickly assess when Polymarkets' pricing aligns with Bitcoin's actual value, leading to more informed trading decisions.
This tool automates probability and fair value assessments, serving as a practical resource for verifying and potentially capitalizing on discrepancies in Polymarkets' Bitcoin pricing. It helps identify when there's a mismatch between the market's implied probability and the calculated fair value, allowing me to avoid unnecessary premiums on high-leverage options.

Bionic -- Expected Weekly Levels (Public)This script will draw lines for Expected Weekly Levels based upon Previous Friday Close, Implied Volatility (EOD Friday), and the square root of Days to Expire (always 7) / 365.
Script will draw 2 high and low levels:
*1st levels are 1 standard deviation from the Previous Friday Close.
* 2nd levels are 2 standard deviation from the Previous Friday Close.
There are also a 1/2 Low and 1/2 Low 1st level. These are 1/2 a standard deviation and act more as a point of interest level. 1/2 levels have 34% probability.
Configurations:
* All lines styles are individually configurable
* All lines can individually be turned on/off
* Text for all lines can be changed
* Global config allows for the
* Lines to show the price on the label
* Lines to have text in the label
* Hide or show all labels
* Lines offset from price is configurable
* Label size is configurable
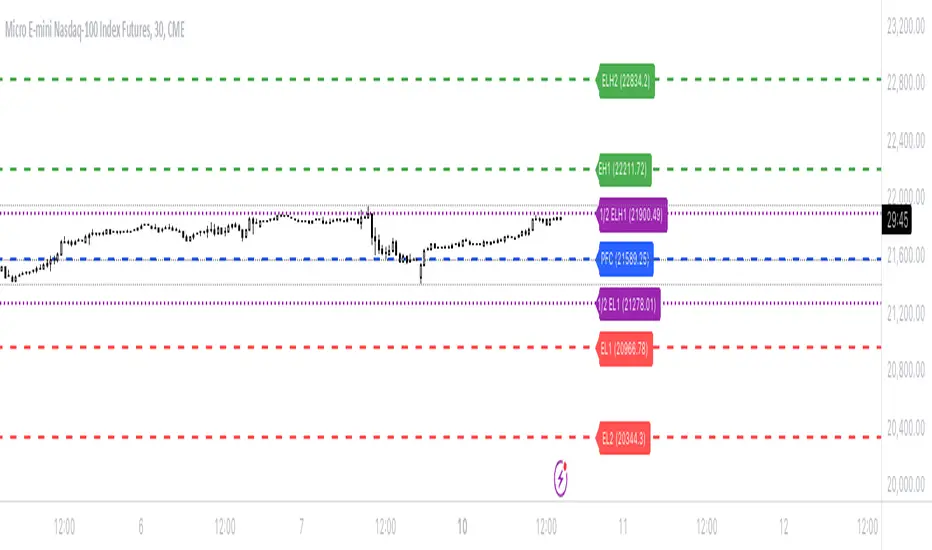
Adaptive On Balance Volume with Trend█ Introduction
The Adaptive On Balance Volume (AOBV) indicator enhances the traditional On Balance Volume (OBV) by introducing adaptability, volatility detection, and trend analysis. It helps traders identify the direction of volume flow, assess volume momentum, and spot potential reversals in the market.
Detecting market tops and bottoms is crucial for making informed trading decisions. The AOBV indicator offers a method for identifying these points by using an adaptive volatility detection function that highlights potential volume peaks or climaxes, suggesting when a price top or bottom may be forming.
█ Understanding the AOBV
Note: Details on how calculations are conducted can be found at the end of this script description.
1. The Basics of the AOBV Function:
• Adaptive Momentum Calculation: Instead of using a fixed momentum formula, the AOBV uses the original formula for basic momentum and enhances it based on relative strength and applies an adaptive smoothing function.
• Dynamic Smoothing:
• Strong Momentum: When the AOBV detects significant changes (strong momentum), it reduces smoothing. This makes the indicator more responsive to major market movements.
• Weak Momentum: When momentum is weak (small changes), it increases smoothing to filter out market noise.
This adaptability allows the AOBV to more accurately reflect volume momentum, responding promptly during significant market moves and remaining stable during quieter periods.
To determine the trend direction (bullish or bearish), the indicator calculates a signal curve and displays the difference as bars:
• Bar Above the Middle Line: Indicates a bullish trend.
• Bar Below the Middle Line: Indicates a bearish trend.
2. Volatility Function:
The volatility function measures how much the AOBV deviates from its average by comparing it to its smoothed version. It calculates the exponential standard deviation to estimate volatility.
• Purpose: Identifies when volume momentum is near a climax or when a trend is nearing exhaustion.
• How It Works:
• Compares current volatility to previous bars.
• Computes a percentage indicating how often the current volatility is higher than past values.
• If this percentage exceeds a defined threshold, it signals a significant volatility event by plotting a dot above or below the bar.
This pattern typically manifests itself during strong runs on price followed by a period of consolidation. Thus, estimating volatility would be an acceptable measure of when a market is reaching or nearing an implied top or bottom.
3. The Trend Function:
The trend function combines several common indicators to gauge buildup toward a reversal or a continuation of a trend when the AOBV changes direction.
• Components:
• AOBV Strength Percentage: Calculates the percentage change in the AOBV to gauge its strength and direction.
• Supertrend Indicator: Acts as the main driver for trend buildup.
• Vertical Horizontal Filter (VHF): Measures market consolidation, adjusting the trend strength accordingly.
• Adaptive RSI: Further refines the trend strength based on volume momentum.
• Trend Ranking:
• Assigns a trend rank to the AOBV that reflects both market direction and momentum.
• Colors are used to represent different trend strengths: Strong Bullish, Bullish, Strong Bearish, and Bearish.
█ How to Use the AOBV
• Above the Middle Line: Suggests a bullish trend.
• Below the Middle Line: Suggests a bearish trend
• The Volatility dots:
• Indicate strong momentum relative to previous bars.
• Signal that the trend may be nearing a climax or exhaustion.
• Can imply a potential market top or bottom.
• Consolidation can be detected by visually comparing current bars to previous ones. This should be obvious since, and as described, the AOBV bars represent volume momentum.
• The trend function is used to gauge the likelihood of a reversal or a continuation of a trend; trend is represented with several colors: strong bullish trend, bullish trend, strong bearish trend, and finally simply a bearish trend.
It is important to understand that this trend function is not the typical trend function found on other technical indicators. It must be viewed within the context of the AOBV momentum. For example, if AOBV is exerting a bullish trend (bars above middle line), then a bearish trend with no major change in momentum and no volatility indication could mean a false reversal. Conversely, a large charge in AOBV could be a strong indication of a market reversal.
█ Key Features
• Two Display Modes: Curve and Bars:
The Adaptive OBV can be viewed in two different display modes: Curve and Bars Mode. "Curve Mode" offers the classic OBV representation (but as AOBV) with trend, while "Bars Mode" incorporates volatility detection and trend, making it the recommended mode.
• Volatility Function:
• Dots appear above or below the volume bars when significant volatility events are detected.
• The sensitivity can be adjusted by changing the percentage threshold.
• Trend Analysis:
• Helps gauge the likelihood of a trend continuation or reversal.
• Uses color-coded trend ranks for easy interpretation.
• Flexible Lookback Period:
Lookback periods for the main AOBV, its signal line, trend function, and volatility function can be customized.
• Recommendations:
• Match the main lookback period with the volatility period: Ensures consistency in momentum and volatility measurements.
• Match the trend lookback period with the signal AOBV lookback period: Aligns trend analysis with the underlying momentum signals.
Below is a sample demonstrating the utility on a 1- minute chart.
█ Calculation Details:
• AOBV Calculations
The AOBV differs the traditional OBV by focusing on the differences in OBV values rather than absolute price movements. Initially, it calculates the standard OBV by accumulating volume based on whether the closing price is higher or lower than the previous close. Next, it computes the difference between the current OBV and the previous OBV to measure changes in volume momentum. It calculates the average net change and average total change of these OBV differences over a specified period using a selected averaging method (e.g., EMA, SMA). By dividing the average net change by the average total change, it obtains a change ratio that reflects the strength and direction of volume momentum.
This change ratio is then scaled to an RSI-like value between 0 and 100, which is used to derive an adaptive smoothing factor (alpha). The alpha adjusts dynamically—when the change ratio indicates strong momentum, alpha increases, making the indicator more responsive to recent changes; when momentum is weak, alpha decreases, increasing smoothing to filter out noise.
The adaptive OBV is calculated by applying this alpha to combine the current OBV and the previous adaptive OBV value. This adaptive smoothing allows the indicator to adjust its sensitivity based on market conditions, becoming more responsive during strong momentum and more stable during weak momentum.
A smoothed OBV signal line is also computed using weighted moving averages for comparison. By analyzing the difference between the adaptive OBV and this smoothed signal line, the indicator identifies bullish or bearish trends. Positive differences suggest bullish momentum (bars above the middle line), while negative differences indicate bearish momentum (bars below the middle line).
• Volatility Calculations
The volatility function in the AOBV indicator identifies significant changes in volume momentum by estimating the variability of recent momentum shifts. It begins by calculating the difference between the AOBV and its smoothed signal line, capturing the current change in volume momentum. To assess volatility, the function employs exponential smoothing to compute adaptive averages of both the volume and the squared volume over a specified lookback period. By combining these averages, it estimates the current standard deviation of the volume momentum changes, effectively measuring how much the momentum deviates from its average level.
This estimated volatility is then compared to historical volatility values over the lookback period to determine how frequently the current volatility exceeds past levels. If the proportion of times the current volatility is higher than previous values and it surpasses a user-defined threshold, it signals a significant volatility event, indicating a potential volume climax
• Trend Calculations
As outlined earlier in description, the trend function is composed of several components:
The Supertrend indicator calculates dynamic support and resistance levels based on price movements and volatility using the Average True Range. It assesses whether the closing price is above or below these levels to determine the primary trend direction. If the price is above the Supertrend line: The market is considered to be in an uptrend. If the price is below the Supertrend line: The market is considered to be in a downtrend.
The Vertical Horizontal Filter measures the strength of the trend by comparing the price range over a period to the sum of absolute price changes. It does this by comparing the difference between the highest and lowest prices over a given period (the "vertical" movement) to the sum of the absolute differences between consecutive prices (the "horizontal" movement). A higher VHF value indicates a stronger, more directional trend, while a lower value suggests that the market is moving sideways without a clear trend.. If the VHF detects consolidation, it downgrades the trend strength indicated by the Supertrend. This prevents the trend function from overemphasizing the Supertrend's signals when the market lacks clear direction.
The Adaptive RSI Analyzes recent changes in the AOBV to identify whether volume momentum is strengthening or weakening (based on the volume percent change) correlating price movement with volume momentum. It only upgrades or downgrades on a bar by bar basis if price movement is correlating with percent change. This acts as a corrective measure against the VHF since quiet periods (consolidation) can occur between strong moves. The alpha generated from the adaptive function is the same as the one generated with the AOBV calculations.
█ Disclaimer
This script is provided for educational and informational purposes only and should not be considered financial advice. Trading financial instruments carries a high level of risk and may not be suitable for all investors. Before using this script, please consult with a qualified financial advisor to ensure it aligns with your individual circumstances. The author does not guarantee the accuracy or completeness of the script and is not responsible for any losses or damages that may occur from its use. Use this script at your own risk.

HTC peppermint_07 CCI w signal + s&r RSI
This CCI version enhances the traditional Commodity Channel Index (CCI) by integrating a dynamically calculated Relative Strength Index (RSI) that acts as support and resistance as shown in the screenshot, it can add as a confirmation to the divergence found in the CCI.
Key Features:
Enhanced CCI: The primary plot (black line but customizable) represents the standard CCI, providing insight into price momentum and potential overbought/oversold conditions.
Dynamic RSI Support/Resistance: The upper and lower bands (medium cyan line) are derived from a smoothed RSI, dynamically adjusting to the current market volatility. These bands serve as potential support and resistance levels for the CCI as additional confirmation for the divergence.
Overbought/Oversold Zones: The traditional overbought (+100) and oversold (-100) levels for CCI are marked with horizontal dotted lines.
Benefits:
Improved Entry/Exit Signals: Combining CCI with dynamic RSI support/resistance may offer more precise trading signals compared to using CCI alone.
Dynamic Adaptation: The RSI-based bands adapt to changing market conditions, potentially providing more relevant support and resistance levels.
Divergence Confirmation: dynamic s&r RSI adds confluence to potential trend reversals identified by the CCI.
Potential Usage:
Traders might use this indicator to:
Identify potential overbought/oversold conditions using the CCI and its relationship to the dynamic RSI bands.
Look for breakouts beyond the dynamic support/resistance levels as potential entry points.
Confirm potential trend reversals using RSI divergence (cyan and red label above divergence) signals.
Further Development Considerations:
Customizable Parameters: Allowing users to adjust the CCI length, RSI periods, and smoothing factors would enhance flexibility.
Alert Conditions: Adding alerts for breakouts, overbought/oversold conditions, and divergence signals would improve usability.
Backtesting: Thoroughly backtesting the indicator's performance across different assets and timeframes is essential before using it for live trading.
DISCLAIMER: !!
indicator is a custom technical analysis tool designed for educational and informational purposes only. It should not be construed as financial advice or a recommendation to buy or sell any security. Trading involves substantial risk of loss and may not be suitable for all investors.
Key Points to Consider:
No Guarantee of Profitability: The indicator's past performance is not indicative of future results. No trading strategy can guarantee profits or eliminate the risk of losses. You could lose some or all of your investment.
Use at Your Own Risk: Use of this indicator is solely at your own discretion and risk. You are responsible for your trading decisions. The developers and distributors of this indicator are not liable for any losses incurred as a result of using it.
Not Financial Advice: This indicator does not provide financial advice. Consult with a qualified financial advisor before making any investment decisions.
Backtesting Limitations: Backtested results, if presented, should be viewed with caution. Past performance may not reflect future results due to various factors, including changing market conditions and the limitations of backtesting methodologies.
Indicator Limitations: Technical indicators, including this one, are not perfect. They can generate false signals, and their effectiveness can vary depending on market conditions and the specific parameters used.
Parameter Optimization: Optimizing indicator parameters for past performance can lead to overfitting, which may not translate to future profitability.
No Warranty: The indicator is provided "as is" without any warranty of any kind, either express or implied, including but not limited to warranties of merchantability, fitness for a particular purpose, or non-infringement.
Changes and Updates: The developers may make changes or updates to the indicator without notice.
By using the "HTC peppermint_07 CCI w signal + s&r RSI" indicator, you acknowledge and agree to the terms of this disclaimer. If you do not agree with these terms, do not use the indicator.
