BoS/CHoCH + FakeoutRMI • BoS / CHoCH + Fakeout Detector
This indicator identifies true market structure breaks based on Break of Structure (BoS) and Change of Character (CHoCH), combined with a precise Fakeout / Liquidity Sweep detector to filter false breakouts.
The logic is built on Smart Money Concepts (SMC) and ICT market structure, using close-confirmation only instead of wick-based signals.
Key Features
BoS & CHoCH Detection (Major Structure)
– Clear distinction between trend continuation (BoS) and trend reversal (CHoCH)
– Bullish and bearish structures are visually separated by color
Fakeout / Liquidity Sweep Detection
– Detects wick sweeps above highs and below lows
– Fakeouts are automatically removed once a valid structure break occurs
– No overlap between Fakeouts and BoS / CHoCH
Close-Only Confirmation (Institutional Logic)
– Structure is considered broken only after candle close
– Reduces noise and false signals caused by stop hunts
Split-Line Design (Clean Chart)
– Structure lines with centered text gap
– Extremely clean and readable, even on lower timeframes
Potential Next Break (Optional)
– Displays potential next major highs and lows
– Ideal for liquidity targeting and trade planning
Why This Indicator?
This tool is designed for traders who:
want non-repainting structure logic
focus on price action & market structure, not lagging indicators
need a clear distinction between fakeouts and real breaks
trade using SMC / ICT concepts
Perfect for scalping, day trading, and swing trading across Forex, Indices, Crypto, and Commodities.
Disclaimer
This indicator is an analysis tool, not an automated trading system.
For best results, combine it with Order Blocks, Fair Value Gaps (FVG), Liquidity Pools, and session bias.
ค้นหาในสคริปต์สำหรับ "fvg"

Displacement## Displacement Indicator (Institutional Momentum Filter)
This indicator highlights **true price displacement** — candles where price moves with **abnormal force relative to recent volatility**.
It is designed to help traders distinguish **real momentum** from normal market noise.
Displacement often precedes:
- Breaks of structure
- Fair Value Gaps (FVGs)
- Strong continuation or meaningful pullbacks
This tool focuses on **confirmation**, not prediction.
---
### 🔍 How Displacement Is Defined
A candle is marked as *displacement* only when **all conditions are met**:
• Candle body is larger than a multiple of ATR (volatility-adjusted)
• Candle body makes up a high percentage of the full candle (strong close)
• Directional conviction (bullish or bearish close)
This filters out:
- Small or average candles
- Wick-heavy indecision
- Low-quality breakouts
---
### 🎯 What This Indicator Is Best Used For
✔ Confirming impulsive moves
✔ Validating structure breaks
✔ Anchoring Fair Value Gaps
✔ Filtering low-probability setups
✔ Identifying institutional participation
Works best on **M5, M15, and H1**, especially during **London and NY sessions**.
---
### ⚠️ Important Notes
• This is **not** a buy/sell signal by itself
• Best used with trend, structure, or liquidity context
• Not designed for ranging or low-volatility markets
Think of this indicator as a **momentum truth filter** —
if displacement is missing, conviction is likely missing too.
---
### ⚙️ Inputs Explained
• ATR Length – defines normal volatility
• ATR Multiplier – how aggressive displacement must be
• Minimum Body % – ensures strong candle closes
All inputs are adjustable to fit different markets and styles.
---
### 🧠 Philosophy
Displacement reflects **commitment**, not anticipation.
This tool helps you wait for **proof**, not hope.
---
If you want, I can:
- Tighten this for **ICT-style language**
- Rewrite for **beginner clarity**
- Add a **“How I personally use it”** section
- Optimize it for **TradingView algorithm visibility**
**Tell me which you want changed.**

Previous Time Based Dealing Ranges [Pro +] | cephxsPrevious Time Based Dealing Ranges 🧪
Visualize previous and current higher timeframe dealing ranges with dual-box OHLC representation, extending reference lines, and HTF candle displays.
OVERVIEW
This indicator displays time-based dealing ranges from higher timeframes directly on your chart. It shows the complete price action structure of previous (or current/forming) periods using a dual-box system: one box for the full High-Low range and another for the Open-Close body. Reference lines extend from key levels to help identify potential support, resistance, and mean reversion zones.
Perfect for traders who use ICT concepts, market structure analysis, or any methodology that relies on understanding where price has been relative to previous dealing ranges.
KEY FEATURES
Dual-Box Range Visualization: Each range displays two boxes - the full H-L range (outer) and the O-C body (inner) - giving immediate visual context of candle structure
Multiple Timeframes: Support for 4H, 6H, 1D, 1W, 1M, and 3M ranges
Previous/Current Mode: View completed ranges (Previous) or the forming range (Current) with real-time updates
Auto Mode: Automatically selects the appropriate range based on your chart timeframe
Reference Lines: Extending lines from High, Mid, Low (or Quadrants: H/75/M/25/L) with trade-into detection
HTF Candle Display: Visual HTF candles positioned to the right of price for context
6H Session Support: Session-aware ranges for Asia, London, NY AM, and NY PM with labeled names
Open Line: Vertical line marking the range's opening price/time
Imbalance Detection: Fair Value Gaps and Volume Imbalances highlighted on HTF candles
MODE OPTIONS
Previous/Current: Previous shows the last completed range. Current shows the forming range with dynamic H/L/C updates
Auto/Manual: Auto selects range by chart TF. Manual lets you choose specific ranges
Extend Box (Current): In Current mode, extends the box's right edge as price develops
AUTO MODE TIMEFRAME LOGIC
Chart < 15m → 6H Range
Chart 15m-1H → 1D Range
Chart 1H-6H → 1W Range
Chart 6H-1D → 1M Range
Chart > 1D → 3M Range
INPUTS
Mode
Mode: Previous/Current - Choose completed or forming range
Auto/Manual: Auto selects range by chart TF, Manual lets you choose
Extend Box (Current): Extends box right edge with price (Current mode only)
Previous Ranges
Range 1: Enable/disable, select timeframe (4H/6H/1D/1W/1M/3M), max display count
Range 2: Second range layer for multi-timeframe analysis
Reference Lines
Line Mode: Levels (H/M/L) or Quadrants (H/75/M/25/L)
Line Style: Solid, dashed, or dotted
Line Thickness: 1-4 pixels
Show Labels: Toggle reference line labels
Label Offset: Distance of labels from current price (1-20 bars)
HTF Candle Levels: Show mini H/M/L lines on HTF candles
Open Line: Vertical line at range open with customizable style
Range Boxes & Colors
Show Range Boxes: Toggle box visibility (lines remain visible)
Per-Range Colors: Customize box and line colors for each timeframe (4H, 6H, 1D, 1W, 1M, 3M)
HTF Candle Styling
Show HTF Candles: Toggle HTF candle display
Body/Border/Wick Colors: Customize bull and bear candle appearance
Padding/Buffer/Width: Control candle spacing and size
Labels
HTF Label: Show timeframe label above/below candles
Remaining Time: Countdown timer to candle close
Label Position: Top, Bottom, or Both
Label Alignment: Align across timeframes or follow individual candles
Imbalance
Fair Value Gap: Highlight FVGs on HTF candles
Volume Imbalance: Highlight VIs on HTF candles
HOW TO USE
Add the indicator to your chart
Choose Previous or Current mode based on your analysis preference
Use Auto mode for intelligent range selection, or Manual to select specific timeframes
Reference lines extend from range levels - watch for price reactions at H/M/L
In Current mode, observe how the range develops with real-time updates
Use the HTF candles on the right for quick multi-timeframe context
REFERENCE LINE LABELS
Labels follow this format:
Previous mode: pD-H (previous Daily High), pW-M (previous Weekly Mid), p6H-London-L (previous 6H London Low)
Current mode: D-H (Daily High), W-M (Weekly Mid), 6H-Asia-L (6H Asia Low)
6H SESSION NAMES
Asia: 18:00-00:00 ET
London: 00:00-06:00 ET
NYAM: 06:00-12:00 ET
NYPM: 12:00-18:00 ET
RECOMMENDED TIMEFRAMES
1-5 minute charts: 6H or 1D ranges
15-60 minute charts: 1D or 1W ranges
4H charts: 1W or 1M ranges
Daily charts: 1M or 3M ranges
Or simply use Auto mode to let the indicator choose the optimal range.
TIPS
The Mid (M) level often acts as equilibrium - watch for mean reversion plays
High and Low levels are more often than not, key to reversals
In Current mode, watch how price interacts with the forming range boundaries
Combine with your existing analysis for confluence
DISCLAIMER
This indicator is for educational and informational purposes only.
Past performance does not guarantee future results.
Always use proper risk management and never risk more than you can afford to lose.
Trading involves substantial risk of loss and is not suitable for all investors.
CREDITS
Original Base HTF candle Plotting Logic by fadizeidan. Put on Steroids by cephxs & fstarcapital.
CHANGELOG
Pro + v1.0: Added Previous/Current mode, 4H range, dual-box visualization, reference lines with trade-into detection, session-aware 6H labels, open line, Auto mode with intelligent TF selection

Confluence Signal Intelligence (CSI)CSI - Confluence Signal Intelligence is a professional-grade analytical overlay that evaluates market conditions across multiple dimensions simultaneously. Rather than relying on a single indicator, CSI synthesizes multiple evidence factors and classification models into unified BUY/SELL signals with confidence classifications.
What It Does
CSI identifies potential reversal zones by detecting when multiple independent analytical components align in the same direction. Each signal displays a confidence classification:
HIGH - Strong multi-factor alignment (Gold labels)
MEDIUM - Moderate factor alignment
LOW - Limited factor alignment
Important : The confidence level measures analytical consensus—not a prediction of trade outcome. A HIGH reading means multiple components agree on directional bias at that moment, not that the trade will be profitable.
Multi-Factor Analysis
The classification system evaluates conditions across several categories:
Statistical Extremes - Normalized price transforms that identify stretched conditions
Momentum Indicators - Multiple oscillators confirming oversold/overbought states
Cycle Analysis - Gauges measuring exhaustion and potential turning points
Trend Alignment - Multi-timeframe directional agreement
Market Structure - Break of Structure events and swing point analysis
Pattern Classification - Models comparing current conditions to historical setups
Volume Analysis - Confirming directional moves with participation
Divergence Detection - Price/momentum disagreements across multiple oscillators
Classification Components
CSI incorporates multiple classification models (KNN, gradient boosting approximation, perceptron) that analyze current market conditions against historical patterns. These models contribute to the overall confidence assessment by identifying setups with characteristics similar to past formations.
Smart Money Concepts
The indicator includes institutional trading concepts:
Break of Structure (BOS) - Markers when price violates significant swing points
Order Blocks - Potential support/resistance zones based on price structure
Fair Value Gaps (FVG) - Price imbalances that may act as future reference points
Regime Detection - Background coloring distinguishing trending vs. ranging conditions
Key Features
Non-Repainting Mode - Optional bar-close confirmation prevents signal changes on the current bar
Adaptive Thresholds - Automatically adjusts sensitivity based on market volatility
Signal Filtering - Option to hide LOW confidence signals to reduce noise
Configurable Cooldown - Minimum bars between signals to prevent overtrading
Comprehensive Dashboard - Real-time display of key metrics and states
Trend EMAs - 20/50/200 period moving averages for context
Extensive Alerts - Conditions for signals, structure breaks, divergences, and more
Intended Use
CSI is designed as a decision-support tool for traders conducting their own analysis. It identifies moments of technical alignment that may warrant further investigation—it does not guarantee profitable outcomes. Market results depend on numerous variables beyond any single analytical tool.
The indicator works across all markets and timeframes.
Companion Indicator
CSI - Confluence Signal Intelligence is published separately and displays the underlying oscillators in their own pane:
CEI (Cycle Exhaustion Index) - Cycle position and momentum depletion measurement
PRG (PDF Reversal Gauge) - Statistical deviation scoring
When used together, the main CSI overlay provides signals on the chart while the oscillator pane offers visibility into the cycle and reversal dynamics contributing to those signals.
Risk Disclosure
This indicator is an analytical tool—not financial advice. Past performance does not guarantee future results. All trading involves substantial risk of loss. Confidence levels reflect internal model agreement only and should be considered alongside broader market context, your own analysis, and sound risk management practices. No indicator can predict future price movements with certainty.
---
## AUTHOR'S INSTRUCTIONS:
```
To request access to CSI - Confluence Signal Intelligence, please visit frontieralgo.com/tradingview or send a private message.

PDI / MMXM Execution OverlayCreates FVG's on lower time frames automatically. Helps with charting live.

ICT Candle Reading PROICT Candle Reading – Visual Clean
This indicator is designed to provide a clean and precise price reading, based on ICT and Smart Money Concepts, without cluttering the chart.
Its purpose is to help traders identify real institutional zones, understand market intention, and improve entry timing, using pure price action.
🔹 What does this indicator show?
🟢 Fair Value Gaps (FVG / Imbalances)
Detects market inefficiencies created by impulsive moves.
Displayed as clean and minimal boxes extended into the future.
Useful as mitigation, reaction, or continuation zones.
🟠 Liquidity Sweeps
Highlights liquidity grabs above recent highs or below recent lows.
Drawn using dashed horizontal lines.
Helps identify market manipulation before the true move.
🔵 Displacement Candles
Identifies candles with dominant bodies, showing institutional momentum.
Marked with small symbols to keep the chart clean.
Useful to confirm impulse starts or shifts in market intent.
🎯 Indicator Philosophy
❌ No lagging indicators
❌ No chart clutter
✅ Real ICT concepts
✅ Clean candle reading
✅ Suitable for scalping, intraday, and swing trading
⚙️ Customization
Each concept can be enabled or disabled individually.
Zone extension length is adjustable.
Optimized for 15M, 1H, and 4H timeframes.
📈 How to use
This indicator does not provide automatic buy/sell signals.
It is best used with:
Higher timeframe bias
Market structure
Session timing (London / New York)
Proper risk management
🧠 Final Notes
ICT Candle Reading – Visual Clean helps you see the market from an institutional perspective, focusing only on what truly matters: price, liquidity, and intent.

HTF Fractal Candle OverlayHTF Fractal Candle Overlay is a technical visualization tool designed to display higher-timeframe candle structures directly on lower-timeframe charts.
In this script, fractal refers to the repetition and projection of higher-timeframe price structures across lower timeframes. By overlaying HTF candles onto the active chart, traders can observe how lower-timeframe price action evolves within larger timeframe candles, without switching timeframes or using multiple charts.
Core Functionality
• Projects selected higher-timeframe candles onto lower timeframes as a visual overlay
• Displays HTF candle bodies, wicks, opens, highs, lows, and midpoints
• Maintains accurate candle alignment using time-based calculations
• Supports session-aware and time-based candle segmentation
• Includes optional imbalance (FVG) and midpoint visualization
• Provides time-remaining tracking for active HTF candles
Fractal Concept Explained
The fractal behavior in this script is expressed through multi-timeframe structure repetition. Each higher-timeframe candle contains a sequence of lower-timeframe price movements that collectively form the same structural behavior. This overlay allows traders to study that relationship in real time and understand how HTF structure develops internally.
Use Cases
• Multi-timeframe context without timeframe switching
• Refining entries using HTF candle structure on LTF execution charts
• Studying internal candle behavior and volatility distribution
• Session-based structure analysis
• Educational visualization of HTF/LTF price relationships
Design Notes
• Built with performance-focused array management
• Automatically manages drawing lifecycle to prevent chart clutter
• Designed for clarity, not signal generation
• No repainting of completed HTF candles
This indicator is intended as a visual analysis tool, not a trading signal. It provides structural context to support discretionary decision-making based on price behavior.

Simple ICT Sweep + FVG (LuxAlgo Swings FIXED)something i created if anyone can improve it or change for better visual


FLUXO COMPRA E VENDA MGThe “FLUXO COMPRA E VENDA MG” indicator is a scoring-based system designed to evaluate buying and selling pressure by combining trend, volume, order flow, momentum, and Smart Money concepts (liquidity, sweeps, and FVG).
It does not rely on a single condition. Instead, it aggregates multiple weighted factors and only generates buy or sell signa

[Sebo] HTF FVGHigher-timeframe Fair Value Gaps only. Fixed logic, no filters, no signals. Built strictly for objective HTF market structure
This script is invite-only. If you want access, please send me a private message!!!

The Reaper WhistleThe Reaper Whistle is a high-precision RSI momentum system engineered for scalpers and intraday traders.
It combines a customizable RSI with a dynamic moving average signal line to detect micro-shifts in momentum, early reversals, and continuation setups with extreme speed.
The indicator includes five key zones used by liquidity and SMC-style traders:
• Strong Sell (90) – Extreme momentum exhaustion
• Sell (80) – Overextension area
• TP Zone (50) – Momentum balance / decision point
• Buy (20) – Discount area
• Strong Buy (10) – Extreme sell-side exhaustion
By tracking how RSI interacts with its MA inside these zones, traders can identify high-probability sniper entries on the 1m, 3m, and 5m charts.
⸻
⭐ HOW IT WORKS (Quick Breakdown)
• RSI Period: defines momentum sensitivity
• MA Period: smooths RSI noise and clarifies direction shifts
• MA Type: SMA, EMA, or WMA for different reaction speeds
• Crossovers: show momentum flips or trend continuation
• Zones: filter out weak signals and highlight only premium setups
⸻
⚡ STRATEGY EXAMPLES
1️⃣ Liquidity Sweep Reversal (Most Powerful Setup)
Use case: Gold, NAS100, NQ, US30
1. Price sweeps a previous high/low
2. RSI spikes into Strong Sell (90) or Strong Buy (10)
3. RSI crosses its MA back inside the zone
4. Enter on candle confirmation
5. TP at the next imbalance, VWAP, or volume cluster
This setup catches V-shaped reversals and trap plays.
⸻
2️⃣ Trend Continuation Pullback
Use case: Trending markets
1. Identify trend direction (EMA 200, structure, etc.)
2. Wait for RSI to pull back to the TP (50) zone
3. Watch for RSI crossing its MA in trend direction
4. Enter with trend
5. TP at previous swing high/low
This setup filters out weak pullbacks and catches clean momentum continuation.
⸻
3️⃣ Breakout Confirmation
Use case: Range breakouts, opening range breaks
1. Price breaks a consolidation high/low
2. RSI holds above Sell (80) in uptrend or below Buy (20) in downtrend
3. RSI crosses its MA with momentum
4. Enter breakout
5. TP at HTF zone or liquidity target
Perfect for fast markets like NAS100 and Bitcoin.
⸻
4️⃣ Divergence + Whistle Flip
Use case: Slow markets or pre-session moves
1. Look for bullish or bearish RSI divergence
2. Wait for RSI to cross the MA in direction of divergence
3. Enter once momentum confirms
4. TP at imbalance, FVG, or mid-range
This increases divergence accuracy dramatically.
⸻
🔥 RECOMMENDED SETTINGS
• Scalping (1m–3m):
• RSI: 5
• MA: 3
• Type: EMA
• Intraday 5m–15m:
• RSI: 7–14
• MA: 5
• Type: SMA
⸻
⭐ WHO IT’S BUILT FOR
• Liquidity + SMC traders
• Scalpers who need fast confirmation
• Traders who want clean, simple entries
• Beginners who want visual guidance
• Professionals who want momentum precision
The Reaper Whistle is intentionally designed for speed, clarity, and reliability — no clutter, no lag, just pure momentum read.
— Created by TheTrendSniper (ChartReaper)
“When the market whispers… the Reaper whistles.”

11-MA Institutional System (ATR+HTF Filters)11-MA Institutional Trading System Analysis.
This is a comprehensive Trading View Pine Script indicator that implements a sophisticated multi-timeframe moving average system with institutional-grade filters. Let me break down its key components and functionality:
🎯 Core Features
1. 11 Moving Average System. The indicator plots 11 customizable moving averages with different roles:
MA1-MA4 (5, 8, 10, 12): Fast-moving averages for short-term trends
MA5 (21 EMA): Short-term anchor - critical pivot point
MA6 (34 EMA): Intermediate support/resistance
MA7 (50 EMA): Medium-term bridge between short and long trends
MA8-MA9 (89, 100): Transition zone indicators
MA10-MA11 (150, 200): Long-term anchors for major trend identification
Each MA is fully customizable:
Type: SMA, EMA, WMA, TMA, RMA
Color, width, and enable/disable toggle
📊 Signal Generation System
Three Signal Tiers: Short-Term Signals (ST)
Trigger: MA8 (EMA 8) crossing MA21 (EMA 21)
Filters Applied:
✅ ATR-based post-cross confirmation (optional)
✅ Momentum confirmation (RSI > 50, MACD positive)
✅ Volume spike requirement
✅ HTF (Higher Timeframe) alignment
✅ Strong candle body ratio (>50%)
✅ Multi-MA confirmation (3+ MAs supporting direction)
✅ Price beyond MA21 with conviction
✅ Minimum bar spacing (prevents signal clustering)
✅ Consolidation filter
✅ Whipsaw protection (ATR-based price threshold)
Medium-Term Signals (MT)
Trigger: MA21 crossing MA50
Less strict filtering for swing trades
Major Signals
Golden Cross: MA50 crossing above MA200 (major bullish)
Death Cross: MA50 crossing below MA200 (major bearish)
🔍 Advanced Filtering System1. ATR-Based ConfirmationPrice must move > (ATR × 0.25) beyond the MA after crossover
This prevents false signals during low-volatility consolidation.2. Momentum Filters
RSI (14)
MACD Histogram
Rate of Change (ROC)
Composite momentum score (-3 to +3)
3. Volume Analysis
Volume spike detection (2x MA)
Volume classification: LOW, MED, HIGH, EXPL
Directional volume confirmation
4. Higher Timeframe Alignment
HTF1: 60-minute (default)
HTF2: 4-hour (optional)
HTF3: Daily (optional)
Signals only trigger when current TF aligns with HTF trend
5. Market Structure Detection
Break of Structure (BOS): Price breaking recent swing highs/lows
Order Blocks (OB): Institutional demand/supply zones
Fair Value Gaps (FVG): Imbalance areas for potential fills
📈 Comprehensive DashboardReal-Time Metrics Display: {scrollbar-width:none;-ms-overflow-style:none;-webkit-overflow-scrolling:touch;} ::-webkit-scrollbar{display:none}MetricDescriptionPriceCurrent close priceTimeframeCurrent chart timeframeSHORT/MEDIUM/MAJORTrend classification (🟢BULL/🔴BEAR/⚪NEUT)HTF TrendsHigher timeframe alignment indicatorsMomentumSTR↑/MOD↑/WK↑/WK↓/MOD↓/STR↓VolatilityLOW/MOD/HIGH/EXTR (based on ATR%)RSI(14)Color-coded: >70 red, <30 greenATR%Volatility as % of priceAdvanced Dashboard Features (Optional):
Price Distance from Key MAs
vs MA21, MA50, MA200 (percentage)
Color-coded: green (above), red (below)
MA Alignment Score
Calculates % of MAs in proper order
🟢 for bullish alignment, 🔴 for bearish
Trend Strength
Based on separation between MA21 and MA200
NONE/WEAK/MODERATE/STRONG/EXTREME
Consolidation Detection
Identifies low-volatility ranges
Prevents signals during sideways markets
⚙️ Customization OptionsFilter Toggles:
☑️ Require Momentum
☑️ Require Volume
☑️ Require HTF Alignment
☑️ Use ATR post-cross confirmation
☑️ Whipsaw filter
Min bars between signals (default: 5)
Dashboard Styling:
9 position options
6 text sizes
Custom colors for header, rows, and text
Toggle individual metrics on/off
🎨 Visual Elements
Signal Labels:
ST▲/ST▼ (green/red) - Short-term
MT▲/MT▼ (blue/orange) - Medium-term
GOLDEN CROSS / DEATH CROSS - Major signals
Volume Spikes:
Small labels showing volume class + direction
Example: "HIGH🟢" or "EXPL🔴"
Market Structure:
Dashed lines for Break of Structure levels
Automatic detection of swing highs/lows
🔔 Alert Conditions
Pre-configured alerts for:
Short-term bullish/bearish crosses
Medium-term bullish/bearish crosses
Golden Cross / Death Cross
Volume spikes
💡 Key Strengths
Institutional-Grade Filtering: Multiple confirmation layers reduce false signals
Multi-Timeframe Analysis: Ensures alignment across timeframes
Adaptive to Market Conditions: ATR-based thresholds adjust to volatility
Comprehensive Dashboard: All critical metrics in one view
Highly Customizable: 100+ input parameters
Signal Quality Over Quantity: Strict filters prioritize high-probability setups
⚠️ Usage Recommendations
Best for: Swing trading and position trading
Timeframes: Works on all TFs, optimized for 15m-Daily
Markets: Stocks, Forex, Crypto, Indices
Signal Frequency: Conservative (quality over quantity)
Combine with: Support/resistance, price action, risk management
🔧 Technical Implementation Notes
Uses Pine Script v6 syntax
Efficient calculation with minimal repainting
Maximum 500 labels for performance
Security function for HTF data (no lookahead bias)
Array-based MA alignment calculation
State variables to track signal spacing
This is a professional-grade trading system that combines classical technical analysis (moving averages) with modern institutional concepts (market structure, order blocks, multi-timeframe alignment).
The extensive filtering system is designed to eliminate noise and focus on high-probability trade setups.

CODEX OB + BBMA V1CODEX OB + BBMA is a multi-purpose Smart Money Concepts (SMC) indicator that automatically detects and visualizes key institutional trading elements such as Order Blocks, Fair Value Gaps, Rejection Blocks, Break of Structure, Pivots, High Volume Bars, and several qualitative SMC signals.
In addition to SMC tools, this indicator also incorporates multi-timeframe BBMA logic, allowing traders to view higher-timeframe momentum, trend direction, and volatility envelopes directly from the current chart. This makes it easier to align SMC setups—like OB, FVG, and BOS—with BBMA structure such as MA touches, re-entry zones, extreme candles, and volatility expansions.
This combination helps traders identify institutional footprints, multi-timeframe confluence, and displacement-based setups with high clarity.

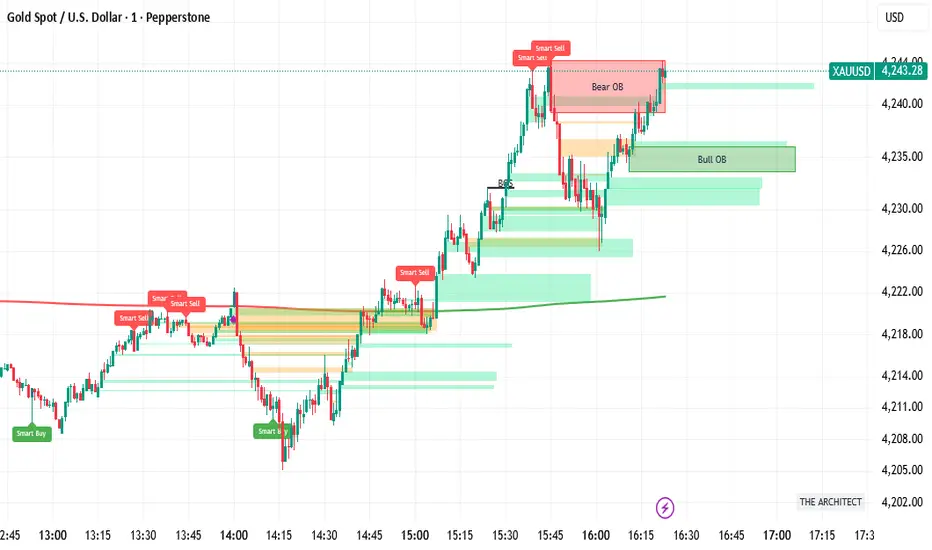
FVH THE ARCHITECT (The Consensus)HE ARCHITECT - Institutional Logic Engine
System Philosophy: THE ARCHITECT is a defensive consensus engine designed to filter market noise and align price structure with institutional momentum. It does not generate signals in isolation; it requires a "Consensus" between Price Action, Volume, and Divergence before confirming a setup.
Core Features:
Institutional Structure: Automatically identifies Order Blocks (Bull/Bear), Fair Value Gaps (FVG), and Break of Structure (BOS) based on fractal logic.
Smart Consensus Filter:
Smart VWAP: Color-coded trend filter (Green = Up, Red = Down).
Volume Spikes: Identifies institutional injection (Purple Candles) at >1.5x average volume.
Smart Reversals: RSI Divergence labels are only printed if the candle color confirms the rejection.
Focus Mode: A toggle to switch between "History Mode" (Context) and "Focus Mode" (Active Zones Only) to reduce chart clutter.
How to Use:
Buy: Wait for price to enter a Green Bull OB. Look for a "Smart Buy" label or Purple Volume Spike.
Sell: Wait for price to enter a Red Bear OB. Look for a "Smart Sell" label.
Alerts: Includes hard-coded alerts for "Smart Buy", "Smart Sell", and "Volume Spikes" for automated notifications.