Consolidation Tracker🧭 Consolidation Tracker — Visualize Market Reversals in Real Time
The Consolidation Tracker is a minimalist yet powerful tool designed to map the anatomy of market reversals and trend transitions. It highlights the structural evolution of price through four key phases, helping traders anticipate shifts with clarity and confidence.
🔄 The Four Stages of a Market Reversal:
Failure to Displace — Price fails to break beyond recent highs or lows, signaling potential exhaustion of the current trend.
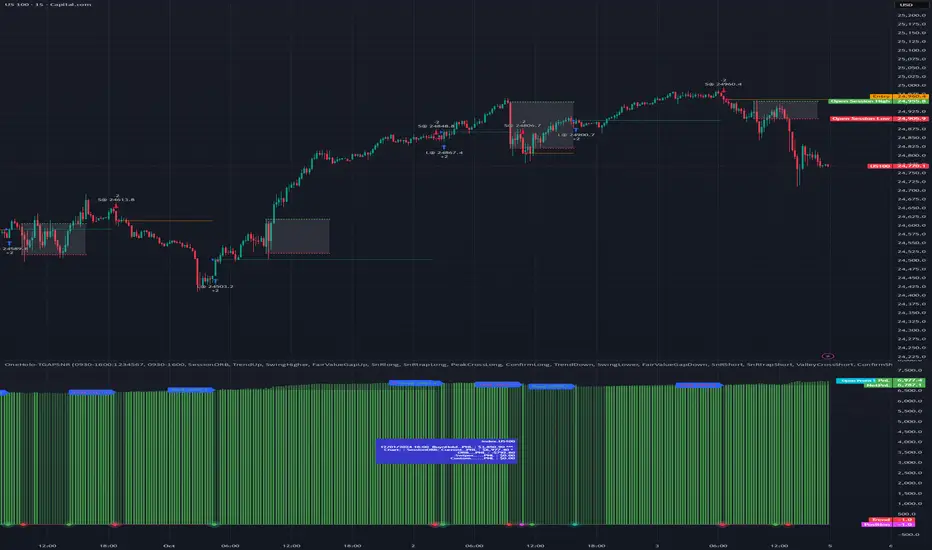
Consolidation (CAMP) — A range-bound phase where price compresses between a dynamic high and low. These zones are shaded gray, representing indecision and balance.
Engulfing (ENGULF) — A decisive candle closes beyond the CAMP high or low, suggesting a directional shift. These are highlighted in orange.
Fair Value Gap (FVG) — A three-candle pattern forms a price imbalance. If this FVG also engulfs the CAMP range, it confirms the reversal and resets the CAMP. Bullish FVGs are shaded green, bearish FVGs in red.
🔁 From Reversal to Trend:
Once a reversal is confirmed via an FVG, the market often transitions into a trend cycle characterized by:
Displacement — Strong directional movement away from the prior range.
Fair Value Gaps — Continuation imbalances that offer high-probability entries on retracements.
🧠 How It Works:
The indicator dynamically tracks CAMP highs and lows, updating only when a candle engulfs the range or a valid FVG forms.
FVGs are detected when a three-candle sequence creates a gap between candle 2 and 0, and the middle candle (candle 1) breaks the CAMP boundary.
CAMP levels are plotted as horizontal lines, while background colors narrate the evolving structure in real time.
This tool is ideal for traders who value market structure, price efficiency, and narrative clarity. Whether you're anticipating reversals or riding trends, the Consolidation Tracker offers a clean, actionable lens into price behavior.
ค้นหาในสคริปต์สำหรับ "fvg"

IFVG [#]ICT Concepts by shulktrades
Beginner Concept
IFVG — Inverse Fair Value Gap
Description:
The IFVG indicator identifies and displays Inverse Fair Value Gaps (IFVGs) — price imbalances that have been traded through and closed, representing a complete rebalancing of a prior Fair Value Gap (FVG).
It is designed for traders studying ICT-based market structure and algorithmic delivery concepts, offering a consistent, precise way to visualize these “flipped” gaps directly on their charts.
This indicator does not generate trading signals, alerts, or entries. It serves as a visual confluence and analytical tool, helping traders recognize when a fair value gap has been invalidated and transformed into an IFVG.
How It Works (Conceptually)
Gap Detection
The script tracks consecutive candle structures to identify FVGs — three-candle formations where a price void exists between the first and third candles.
Inverse Confirmation
When price fully closes through a detected FVG (meaning both gap boundaries have been traded and settled), the imbalance is flagged as neutralized, and the script converts it into an Inverse Fair Value Gap (IFVG).
Box Drawing Logic
Each IFVG is displayed as a visual box drawn from the displacement range of the candle that confirmed the closure.
Boxes extend either to the current bar or a user-defined candle limit, providing flexibility for how long historical IFVGs remain visible.
This ensures chart clarity while maintaining accurate visual context of algorithmic rebalancing.
Unique Implementation Features
The IFVG indicator differs from typical open-source FVG tools through its structural logic and visualization method:
Higher-Timeframe Candle Tracking
It can reference higher-timeframe (HTF) candle data to display IFVGs originating from larger structures (for example, showing H1 or H4 inverse gaps on a lower timeframe).
This alignment with HTF context gives traders a broader view of algorithmic delivery behavior.
Specific Timeframe Tracking (Future Integration)
The underlying framework supports selectable timeframe inputs for future updates, allowing users to define which candle data to track for IFVG formation — ensuring full adaptability across multiple timeframe models.
Dynamic End Conditions
Unlike static or persistent zone indicators, each IFVG box can end at the current time or after a custom candle limit.
This avoids overcrowding the chart while maintaining accurate historical context.
Accurate Visual Rendering
The drawing logic ensures that every IFVG box is aligned precisely to candle bodies and wicks, scaling correctly across all chart resolutions.
This eliminates overlap, offset, or visual drift common in generic FVG/IFVG implementations.
How to Use It
Apply the indicator to visualize confirmed Inverse Fair Value Gaps on your chart.
Use the highlighted zones as contextual confluence, not entry triggers.
Adjust settings for box duration and visibility according to your preferred analysis depth.
Integrate with other ICT-based concepts such as liquidity sweeps, order blocks, and displacement analysis for deeper structural insight.
Originality and Purpose
The IFVG indicator is original in its:
Strict focus on confirmed, traded-through FVGs only.
Use of HTF candle tracking for broader algorithmic context.
Dynamic end-of-zone control, determined by user preference or real-time progression.
Accurate visual construction of zones directly tied to candle confirmation logic.
These design choices make it distinct from generic FVG/IFVG indicators and justify its closed-source status, as its logic, rendering precision, and adaptive framework go beyond simple stylistic replication of public scripts.
Important Notes
For educational and analytical use only.
Does not issue alerts, entries, or trade recommendations.
Best suited for traders familiar with ICT delivery and structure concepts.
Always apply personal risk management and confirm bias independently.

Binary Options 1 Minute Signals [TradingFinder] 1 Min Strategy🔵 Introduction
At first sight, price movement in binary options appears random, but behind every move lies a clear logic of liquidity and market imbalance. The market is always driven by the hunt for liquidity and the continuous rebalancing that takes place around Fair Value Gaps (FVGs) and Order Blocks (OBs). These zones are where institutional activity is concentrated and where Smart Money creates the most significant reactions.
When price approaches a key liquidity zone, it often performs a Liquidity Sweep to capture orders resting around previous highs or lows. This move usually presents itself as a False Breakout. Price briefly breaks a level to trigger stop losses and collect liquidity, then quickly reverses direction. Understanding this false breakout behavior is essential for identifying high probability reversals in binary options trading.
After the liquidity sweep, price typically retraces into a Fair Value Gap or Order Block, where the market seeks balance and new orders are introduced. This interaction between liquidity, imbalance, and institutional order flow forms the core logic of every Smart Money trading model.
By focusing on Liquidity Sweeps, False Breakouts, and the structure of FVGs and OBs, traders can read the true intention behind price movements. What seems like random volatility becomes a structured cycle of liquidity collection and reaction, offering clear opportunities for precision-based binary entries.
Bullish Setup :
Bearish Setup :
🔵 How to Use
This indicator works within the Smart Money framework and focuses on the connection between Liquidity Sweep, False Breakout, Fair Value Gap (FVG) and Order Block (OB).
It is created to help traders identify the moment when the market finishes collecting liquidity and begins to show signs of reversal.
The indicator studies how price behaves around zones where liquidity is concentrated, such as previous highs and lows or areas with visible inefficiency. When a clear reaction forms and a valid candle pattern confirms the shift in direction, the indicator generates a signal that represents the activity of Smart Money.
This tool does not respond to random volatility or noise. It waits for structure, liquidity and confirmation to align together before providing an entry. As a result, every signal has a logical base related to institutional order flow rather than ordinary price fluctuations. This approach allows traders to focus only on the movements that reflect true liquidity behavior.
🟣 Long Setup
A bullish setup takes place when the market moves downward and reaches a sell-side liquidity zone located below previous swing lows. In this area, price performs a Liquidity Sweep by moving under key levels to trigger stop losses and capture liquidity from trapped sellers.
This movement usually appears as a False Breakout because the market breaks below a level for a short moment and then quickly moves back inside the range.
Around this zone, a bullish Order Block or Fair Value Gap (FVG) often exists, showing where institutional demand is active.
When the indicator detects the presence of liquidity collection together with a valid bullish confirmation candle near an OB or FVG, it creates a Call signal.
This marks the moment when Smart Money is shifting from selling pressure to accumulation, and a strong bullish move often follows. For binary entries, the best opportunity usually comes immediately after the confirmation candle closes.
The reaction tends to happen quickly because the liquidity grab has completed and new institutional buying pressure is entering the market. This type of setup often provides a clean and precise entry with a high probability of success.
🟣 Short Setup
A bearish setup happens when the market rises and enters a buy-side liquidity area above previous highs. Here, the market performs a Liquidity Sweep to trigger stop losses placed above those highs and to absorb liquidity from trapped buyers.
This pattern forms what traders recognize as a False Breakout because the price only breaks the level temporarily before reversing in the opposite direction. A bearish Order Block or Fair Value Gap (FVG) often appears around this zone, showing where institutional selling interest exists.
Once the liquidity sweep completes and a bearish confirmation candle closes, the indicator produces a Put signal that reflects the shift from buying to selling pressure by Smart Money.
This moment often leads to a fast downward reaction as the market rebalances and fills the nearby inefficiency.
The most effective entry for binary trading is right after the confirmation candle closes, when the false breakout and liquidity collection are both completed. The price usually reacts sharply as the market transitions from liquidity hunting to a new directional move. This setup represents a structured view of how liquidity drives market cycles and how Smart Money creates precise reversals through controlled imbalance and reaction.
🔵 Settings
Time Frame : Defines the timeframe used for analysis. If left blank, the indicator automatically uses the chart’s current timeframe.
Swing Period : Determines how many candles are used to identify structural turning points such as swing highs and swing lows. Higher values increase accuracy but reduce the number of signals.
Signal Type : Specifies the type of signal generated by the indicator. The option All shows every signal, Main Signal displays only the primary one, and Alternative Signal produces a secondary signal that appears one candle after the main signal for additional confirmation.
Candle Pattern : Enables candle pattern logic for reversal confirmation. When active, the indicator issues a signal only when a valid candle formation confirms the market reaction.
Candle LookBack Check : Verifies that the last few candles move in the opposite direction of the signal to be generated. This condition acts as a confirmation filter, ensuring that the signal appears only after a clear counter-move in price.
Last Candle Direction : Considers the direction of the most recent candle in the analysis. It helps determine whether the final candle moves with or against the current trend.
Last Candle Shadow Ratio : Sets the ratio between the last candle’s wick and body to refine confirmation accuracy. Higher values require longer wicks, indicating stronger rejection and a more reliable reversal pattern.
🔵 Conclusion
Trading with Smart Money logic means understanding how liquidity moves through the market.
Each Liquidity Sweep, False Breakout, Fair Value Gap (FVG) and Order Block (OB) reflects the process of collecting and redistributing orders.
This indicator captures that sequence and turns it into precise, structured signals for binary entries. When liquidity is absorbed and a candle confirmation appears, the market reveals its true direction.
At that moment, traders can act with confidence, following institutional flow instead of reacting to random price moves.
Success with this system comes from patience, confirmation, and a clear reading of liquidity behavior, the core principles behind every Smart Money reversal.

IRONBULL FX Venom [TradeFinder] SMC NY Session 2025Setup📌 IRONBULL FX VENOM TRADER
Overview:
The IRONBULL FX VENOM TRADER is a premium Smart Money Concepts (SMC)-based indicator built for institutional-style trading in the New York session. Powered by advanced order block refinement, fair value gap (FVG) detection, and session-based logic, this tool helps traders identify high-probability trading zones and mitigate market noise.
🔧 Key Features:
Order Block Refinement Engine
Integrates with advanced refining logic to filter institutional demand/supply zones, with both Defensive and Aggressive refinement modes.
Fair Value Gap (FVG) Filtering
Detects and highlights FVGs with dynamic filtering options, from Very Aggressive to Very Defensive levels.
Mitigation Levels Control
Allows users to select Proximal, 50%, or Distal levels for precise reaction zones within both OBs and FVGs.
CISD Detection
Captures key short-term displacement shifts, showing potential reversal or continuation signals with optional visual cues.
NY Session Logic
Includes built-in logic to align trades with the New York Opening Range (08:00–09:30 EST) and NY Trading Hours (09:30–17:00 EST). Key session highs/lows are tracked and labeled automatically.
Visual Clarity
Fully customizable color schemes for demand/supply OBs, FVGs, and CISD levels, with lightweight rendering for real-time performance.
🧠 Ideal For:
SMC/ICT-based traders
New York session scalpers and intraday traders
Traders seeking clean institutional zone mapping
Anyone needing visual confirmation of OB + FVG confluence
⚙️ How to Use:
Enable the indicator on a chart (preferably with NY session timezone).
Adjust refinement, FVG filters, and display settings based on your strategy.
Use the OB and FVG zones as key confluence areas for entries/exits.
Watch for CISD labels and session breakouts for high-confidence setups.
Disclaimer: This tool is for educational purposes and not financial advice. Always test in a demo environment before live trading.

Smart Risk - Three Institutional Models📘 Smart Risk – Three Institutional Entry Models
A precision-engineered institutional framework that blends liquidity, structure, and multi-time-frame confirmation.
🧠 Concept Overview
The Smart Risk indicator models how institutional traders and algorithms engineer entries around liquidity, imbalance, and structural shifts .
It unifies t hree distinct institutional entry models —each built around core Smart Money Concepts (SMC)—and enhances them with a Multi-Time-Frame Confluence (MTF) engine for directional alignment.
This tool doesn’t simply merge indicators.
It connects l iquidity sweeps, order-block reactions, breaker validation, and fair-value-gap mitigation into one cohesive trading logic—filtering every setup through trend, structure, and volume confirmation.
⚙️ How It Works
Setup #1 – Liquidity Sweep + Order Block Revisit + FVG Mitigation
Identifies engineered stop-hunts where price sweeps external liquidity and returns to a prior Order Block or Fair Value Gap (FVG).
Signals reversal-style entries with high probability of mean-reversion or mitigation.
Setup #2 – Supply/Demand + Mitigation / Breaker / FVG Continuation
Captures continuation trades inside trending structure.
When trend bias (via moving-average context) aligns with breaker or mitigation blocks, signals confirm institutional continuation sequences.
Setup #3 – Sweep + Classic FVG Reaction
Tracks clean displacement gaps following a liquidity sweep—ideal for scalpers and intraday reversals where imbalances act as magnets for price.
Each setup can be independently enabled or disabled from the panel.
A built-in signal-cooldown prevents repetitive triggers on the same leg.
🕒 Multi-Time-Frame Confluence
The new MTF module aligns lower-time-frame precision entries with higher-time-frame market structure.
When enabled, each setup only validates if the HTF trend confirms the same directional bias as the LTF pattern—e.g. a 5-minute bullish FVG signal requires a bullish 1-hour structure.
This ensures institutional logic respects global liquidity flow and avoids counter-trend traps.
MTF Controls:
• ✅ Enable MTF Confluence toggle
• ⏱️ Lower Time-Frame (LTF) selector (default 5 min)
• ⏱️ Higher Time-Frame (HTF) selector (default 1 hour)
• 🔄 Automatic SMA-based HTF trend detection
🎨 Visualization & Dashboard
• Order Block / Supply–Demand Zones — highlight institutional footprints
• Fair Value Gaps (FVGs) — reveal displacement inefficiencies
• Liquidity Sweeps (X / $) — mark engineered stops
• BOS & CHoCH — confirm structure continuation or reversal
• Compact Dashboard — live “Armed” state for each setup and MTF bias
Color-coded background cues emphasize active trade phases without clutter.
🧩 Core Algorithm Highlights
• Dynamic swing and pivot structure detection
• Breaker / Mitigation / Volume confirmation filters
• Fair-Value-Gap logic with directional alignment
• Cooldown control for signal throttling
• Multi-Time-Frame bias filter for contextual precision
⸻
📈 How to Use
1. Apply indicator to any asset or timeframe.
2. Select which institutional setups you want active.
3. Optionally enable MTF Confluence (5 min → 1 hr recommended).
4. Wait for BOS/CHoCH confirmation + zone alignment before entry.
5. Use OB and FVG zones for entry/exit planning with risk management.
⸻
💡 Originality Statement
This script introduces a multi-layered institutional logic engine that merges liquidity, mitigation, and imbalance behavior into a unified framework—augmented with time-frame synchronization and signal-cooldown management.
All logic, calculations, and visualization structure were built from scratch for this model.
It is not a mash-up of existing public indicators and offers measurable analytical value through MTF-aware trade validation.
⸻
⚠️ Disclaimer
This tool is intended for educational and analytical purposes only.
It does not provide financial advice or guaranteed trading outcomes.
Always back-test, validate setups, and apply proper risk management.

FVGC - SignalsFVGC — Signals (by Capital Complex)
Part of the FVGC Suite.
Purpose-built for Nasdaq-100 futures (NQ/MNQ), this companion to “FVGC — Visual Overlay” turns the overlay’s structure into tightly-gated entry signals—focusing on the first qualified engulf after a valid FVG tap inside your trading windows. The rules and defaults have been shaped by years of systematic backtesting (no performance claims).
## What it does
FVGC — Signals listens for a specific sequence and only then prints a trade signal:
* Retrace→ Tap→ Engulf: The ultimate continuation model, FVGC by Capital Complex.
* Opposing-FVG safety: As per the FVGC model by Capital Complex, optimal setups avoid opposing restrictions such as opposing FVGs, this is all coded into your entries.
* Distance-aware engulf: Engulfing candle restrictions based on data backed optimizations, timeframe and volatility aware.
* Fail-to-Close integrity: Require minimal interaction with rejection FVG.
* Structured drawings: TP/SL/BE are optimally sized on setup conditions, with point distances labelled for quick assessment.
Everything updates in real-time and only prints after the full sequence is satisfied, so you see one clean, first-engulf signal per opportunity (or one-and-done per gap if you choose).
## Why traders use it
* Clarity at the moment of commitment: Signals only fire after strict models are met.
* Designed for NQ: Defaults reflect NY RTH behavior and typical NQ volatility patterns.
* Noise control: Auto distance caps and fail-to-close filters help avoid low-quality chases.
* Pairs perfectly with Overlay: Use Visual Overlay for context (sessions, HTF FVG lines, news footprints) and Signals for the entry trigger.
## Key features & options
* Timezone-aware sessions: Three trading windows.
Models:
* FVGC with BOS.
* FVGC with IFVG.
Filters:
* Engulf distance cap (auto optimized for 30s/1m/2m) with volatility overide.
* Opp-FVG 50% override (allow inside if close passes the opposing gap’s midpoint).
* Fail-to-Close(inside and/or past midpoint).
* Trade management visuals: Optimal TP/SL/BE lines and right-side points labels.
* Entry limits: Allow multiple entries per same FVG or **one-and-done**.
* Day “intensity” shading: Grades the 09:30–09:35 points range to hint at expected intraday pace during 09:30–11:30.
## How to use
1. Load FVGC — Signals on 30 sec.
2. Set your Timezone and enable the Trading Window(s) you use (default 09:30–11:30 NY).
3. Choose Models (BOS / IFVG) and enable Filters (distance cap, open override, Opp-FVG 50%, Fail-to-Close) as desired.
4. (Optional) Toggle TP/SL/BE drawings and “wait for close” for conservative rendering.
5. Use alongside FVGC — Visual Overlay so the structural context and the entry triggers remain in sync.
## Notes
* Signals are calculated without lookahead; non-standard chart types are not supported for signal generation.
* This is an entry-signals and visualization tool, not an execution strategy. Risk sizing, commissions, slippage, and order handling remain the user’s responsibility.
* Years of backtesting informed defaults and guardrails; past results do not guarantee future performance.
## Credits & suite
**Capital Complex — FVGC Suite**
© TheHiddenMarkets (code components).

CPT - CRT Sessions🧭 CPT - CRT Sessions V3
Automated Killzones, CRT Ranges, FVGs, and Market Structure Anchors — built for precision intraday analysis.
🔹 Overview
CPT - CRT Sessions V3 is an advanced all-in-one price action indicator designed to simplify your intraday charting and speed up trade preparation.
It automatically plots key session killzones, Central Range Times (CRT), Fair Value Gaps (FVGs), and market structure anchors such as NDOG, NWOG, and PDH/PDL, allowing traders to identify premium and discount zones at a glance.
⚙️ Core Features
🕒 CRT Ranges (Central Range Time)
Automatically plots 1HR CRT (for futures) and 4HR CRT (for forex) sessions.
Includes color-coded high/low lines for instant visual reference.
Configurable hours (UTC-4 default) and adjustable forward projection.
📦 Killzones
Automatically draws Asian, London, and New York (AM, Lunch, PM) session boxes.
Each killzone features:
Adjustable start/end times
Independent color and transparency controls
Session labeling inside boxes
Uses the classic ICT-style session structure (Asia: 20:00–23:59 UTC-4 by default).
⚡ Fair Value Gaps (FVGs)
Detects both bullish and bearish FVGs automatically.
Displays each gap with:
Midpoint line
Label inside the box (e.g., “1HR FVG”, “4HR FVG”)
Auto-remove logic once price mitigates the gap.
Works on all timeframes.
🔰 Market Anchors
PDH / PDL — Previous Day High & Low
NDOG / NWOG — New Day & New Week Opening Gaps
Automatically drawn and color-coded for visual clarity.
🎨 Customization
Adjustable line styles, widths, and label sizes
Individual transparency sliders for each session box
Optional 24-hour display filtering
Fully timezone-aware (default: UTC-4, matching Exchange time)
💡 Ideal For
Traders following ICT, Smart Money Concepts, or Session Liquidity Models
Scalpers and intraday traders looking to automate manual markups
Multi-timeframe confluence mapping (FVGs + Killzones + CRTs)
🧠 Notes
This tool is for chart analysis only — not an entry or exit signal.
Always perform your own confluence checks before trading.

ICT Institutional Order Flow (Riz)This indicator implements Inner Circle Trader (ICT) institutional order flow concepts to identify high-probability entry points where smart money is actively participating in the market. It combines volume analysis, market structure, and price action patterns to detect institutional accumulation and distribution zones.
Core Concepts & Methodology
1. Institutional Order Blocks Detection
Order blocks represent the last opposing candle before a strong directional move, indicating institutional accumulation (bullish) or distribution (bearish) zones.
How it works:
⦁ Identifies the final bearish candle before bullish expansion (accumulation)
⦁ Identifies the final bullish candle before bearish expansion (distribution)
⦁ Validates with volume spike (2x average) to confirm institutional participation
⦁ Requires minimum 0.5% price displacement to filter weak moves
⦁ Tracks these zones as future support/resistance levels
2. Fair Value Gap (FVG) Analysis
FVGs are price inefficiencies created by aggressive institutional orders that leave gaps in price action.
Detection method:
⦁ Bullish FVG: When current low > high from 2 bars ago
⦁ Bearish FVG: When current high < low from 2 bars ago
⦁ Minimum gap size filter (0.1% default) eliminates noise
⦁ Monitors gap fills with volume for entry signals
⦁ Gaps act as magnets drawing price back for "rebalancing"
3. Liquidity Hunt Detection
Institutions often trigger retail stop losses before reversing direction, creating liquidity for their positions.
Algorithm:
⦁ Calculates rolling 20-period highs/lows as liquidity pools
⦁ Detects wicks beyond these levels (0.1% sensitivity)
⦁ Identifies rejection back inside range (liquidity grab)
⦁ Volume spike confirmation ensures institutional involvement
⦁ These reversals often mark significant turning points
4. Volume Profile Integration
Analyzes volume distribution across price levels to identify institutional interest zones.
Components:
⦁ Point of Control (POC): Price level with highest volume (institutional consensus)
⦁ Value Area: 70% of volume range (institutional comfort zone)
⦁ Uses 50-bar lookback to build volume histogram
⦁ 20 price levels for granular distribution analysis
5. Market Structure Analysis
Determines overall trend bias using pivot points and swing analysis.
Process:
⦁ Identifies swing highs/lows using 3-bar pivots
⦁ Bullish structure: Price above last swing high
⦁ Bearish structure: Price below last swing high
⦁ Filters signals to trade with institutional direction
Signal Generation Logic
BUY signals trigger when ANY condition is met:
1. Order Block Formation: Bearish-to-bullish transition + volume spike + strong move
2. Liquidity Grab Reversal: Sweep below lows + recovery + volume spike
3. FVG Fill: Price fills bullish gap with institutional volume (within 3 bars)
4. Order Block Respect: Price bounces from previous bullish OB + volume
SELL signals trigger when ANY condition is met:
1. Order Block Formation: Bullish-to-bearish transition + volume spike + strong move
2. Liquidity Grab Reversal: Sweep above highs + rejection + volume spike
3. FVG Fill: Price fills bearish gap with institutional volume (within 3 bars)
4. Order Block Respect: Price rejects from previous bearish OB + volume
Additional filters:
⦁ Signals align with market structure (no counter-trend trades)
⦁ No new signals while position is active
⦁ All signals require volume confirmation (institutional fingerprint)
Trading Style Auto-Configuration
The indicator features intelligent preset configurations for different trading styles:
Scalping Mode (1-5 min charts):
⦁ Volume multiplier: 1.5x (more signals)
⦁ Tighter parameters for quick trades
⦁ Risk:Reward 1.5:1, ATR multiplier 1.0
Day Trading Mode (15-30 min charts):
⦁ Volume multiplier: 1.7x (balanced)
⦁ Medium sensitivity settings
⦁ Risk:Reward 2:1, ATR multiplier 1.5
Swing Trading Mode (1H-4H charts):
⦁ Volume multiplier: 2.0x (quality focus)
⦁ Conservative parameters
⦁ Risk:Reward 3:1, ATR multiplier 2.0
Custom Mode:
⦁ Full manual control of all parameters
Visual Components
⦁ Order Blocks: Colored rectangles (green=bullish, red=bearish)
⦁ Fair Value Gaps: Orange boxes showing imbalances
⦁ Liquidity Levels: Dashed blue lines at key highs/lows
⦁ Volume Spikes: Yellow background highlighting
⦁ POC Line: Orange line showing highest volume price
⦁ Value Area: Blue shaded zone of 70% volume
⦁ Buy/Sell Signals: Triangle markers with text labels
⦁ Stop Loss/Take Profit: Dotted lines (red/green)
Information Panel
Real-time dashboard displaying:
⦁ Current trading mode
⦁ Volume ratio (current vs average)
⦁ Market structure (bullish/bearish)
⦁ Active order blocks count
⦁ Position status
⦁ Configuration details
How to Use
Step 1: Select Trading Style
Choose your style in settings - all parameters auto-adjust
Step 2: Timeframe Selection
⦁ Scalping: 1-5 minute charts
⦁ Day Trading: 15-30 minute charts
⦁ Swing: 1H-4H charts
Step 3: Signal Interpretation
⦁ Wait for BUY/SELL markers
⦁ Check volume ratio >2 for strong signals
⦁ Verify market structure alignment
⦁ Note automatic SL/TP levels
Step 4: Risk Management
⦁ Default 2:1 risk:reward (adjustable)
⦁ Stop loss: 1.5x ATR from entry
⦁ Position sizing based on stop distance
Best Practices
1. Higher probability setups occur when multiple conditions align
2. Volume confirmation is crucial - avoid signals without volume spikes
3. Trade with structure - longs in bullish, shorts in bearish structure
4. Monitor POC - acts as dynamic support/resistance
5. Confluence zones where OBs, FVGs, and liquidity levels overlap are strongest
Important Notes
⦁ Not a standalone system - combine with your analysis
⦁ Works best in trending markets with clear structure
⦁ Adjust settings based on instrument volatility
⦁ Backtest thoroughly on your specific markets
⦁ Past performance doesn't guarantee future results
Alerts Available
⦁ ICT Buy Signal
⦁ ICT Sell Signal
⦁ Volume Spike Detection
⦁ Liquidity Grab Detection
This indicator provides a systematic approach to ICT concepts, helping traders identify where institutions are entering positions through volume analysis and key price action patterns. The auto-configuration feature ensures optimal settings for your trading style without manual adjustment.
Disclaimer
This tool is for educational and research purposes only. It is not financial advice, nor does it guarantee profitability. All trading involves risk, and users should test thoroughly before applying live.

Blitz Model
The Blitz indicator is a comprehensive market structure analysis tool designed specifically for the 4-hour timeframe. It identifies and visualizes key market movements including sweeps, fair value gaps (FVGs), and session-based liquidity levels.
1) Key Features :
A) Market Structure Analysis :
i) Sweep Detection: Identifies bullish and bearish sweeps of previous highs/lows.
ii) Double Purge Recognition: Detects when both bullish and bearish sweeps occur on the same candle.
iii) Fair Value Gap (FVG) Visualization: Displays imbalance zones with customizable box colors.
iV) Session-Based Analysis: Tracks Asian and London session highs/lows.
B) Multi-Timeframe Confirmations :
i) Layer 2 Validation System: Incorporates H1 and M15 timeframe confirmations.
ii) H1 Sweep Confirmations: Validates 4H signals with hourly sweep patterns.
iii) M15 Analysis: Includes both sweep and FVG confirmations from 15-minute timeframe.
C) Key Level Integration :
i) Daily 0.5 Level: Plots the midpoint of previous day's range with customizable styling.
ii) Session Liquidity: Identifies sweeps of Asian and London session extremes.
ii) FVG Interaction: Detects when sweeps occur near fair value gaps.
D) Customization Options :
i) Label Styling: Full control over label size, style, and colors for all signal types.
ii) Double Purge Customization: Separate styling options for double purge signals.
iii) Line Customization: Adjustable daily 0.5 line appearance (style, color, width).
iv) Display Controls: Toggle visibility for FVGs, labels, and confirmation history.
2) Technical Specifications
A) Timeframe Requirements :
i) Primary Timeframe: 4H only (indicator will show error on other timeframes).
ii) Multi-Timeframe Data: Analyzes H1 and M15 for confirmations.
iii) Session Times: Configurable start/end times.
B) Signal Validation Criteria :
Sweeps are validated when they occur at one or more of the following conditions:
i) FVG Zones: Price interaction with identified fair value gaps.
ii) Daily Midpoint: Proximity to the 50% level of previous day's range.
iii) Session Levels: Sweeps of Asian (19:00-01:00 NY) or London (02:00-05:00 NY) extremes.
C) Layer 2 Confirmation System :
i) H1 Confirmations (H1S): Sweep patterns on 1-hour charts within the 4H candle formation.
ii) M15 Sweep (M15S): 15-minute sweep confirmations.
iii) M15 FVG (M15F): 15-minute fair value gap formations.
3) Usage Guidelines :
A) Setup Instructions :
i) Apply to 4-hour charts only.
ii) Configure session times based on your analysis preferences.
iii) Customize label appearance and colors to match your chart theme.
iv) Enable/disable features based on your trading style.
B) Signal Interpretation :
i) Green Labels: Bullish sweeps with validation criteria met.
ii) Red Labels: Bearish sweeps with validation criteria met.
iii) Purple Labels: Double purge scenarios (both directions swept).
iv) Checkmark (✓): Indicates Layer 2 multi-timeframe confirmation present.
v) For double purge interpretations :
- Low & High means recent purge (just previous candle)
- Low & High means medium term purge (8H prior)
- Low & High means longer term purge (12H + prior)
4) Compatibility :
Max Objects: Supports up to 500 boxes and labels simultaneously.
5) Support & Updates :
This indicator represents educational concepts in market structure analysis. Users should thoroughly test and understand all signals before considering any practical application.
Disclaimer :
Always practice proper risk management. This is for educational purposes only and is not a financial advice.

BanShen MACD Ultimate Multi Signal System[SpeculationLab]🧠 How This Script Works (Detailed Logic Breakdown)
This script is a closed-source, fully self-developed modular trading system centered around MACD divergence detection. It also includes auxiliary modules such as:
Vegas Tunnel trend filtering
Dynamic ATR-based stop placement
Engulfing candlestick pattern detection
RSI/OBV divergence modules
Fair Value Gap (FVG) recognition
A smart signal panel that consolidates all signals in real time
These components work together through a signal resonance framework, helping traders identify high-confluence, high-probability entry opportunities.
🔍 Why MACD Divergence Is the Core (Real-World Strategy Basis)
This system is based on a real-world trading strategy I’ve personally used and refined over time.
Through discretionary trading and backtesting, I discovered that divergence between price action and the MACD histogram — especially when certain structural conditions are met — produces a very high win rate.
Key observations include:
MACD peaks/troughs that are clean and well-shaped (defined pivot structure)
Large vertical differences between two MACD histogram extremes
Price making a higher high or lower low, while MACD does the opposite
Two or more divergences appearing consecutively, which creates a powerful reversal signal
These setups have proven extremely reliable in my experience. This script automates the detection of these conditions using strict logic filters.
🔷 1. MACD Divergence Engine (Core Module)
At its core, this script implements a multi-layered MACD divergence detection system, capable of identifying both **regular** and **consecutive** bullish/bearish divergences.
Key components of the logic:
- **Pivot-Based Peak Detection:**
Peaks and troughs in the MACD histogram are located using left/right lookback lengths.
These define valid turning points by requiring the center bar to be the highest (or lowest) compared to its neighbors.
- **Peak Size Thresholding:**
The height of the histogram peaks is compared to the standard deviation of MACD values.
Only peaks above a configurable multiplier (e.g., 0.1× stdev) are considered significant, filtering out noise.
- **Peak Ratio Filtering:**
For divergence to be valid, the size ratio between two histogram peaks must exceed a minimum threshold.
This prevents "flat" divergences with no meaningful MACD movement from triggering false signals.
- **Noise Suppression:**
A customizable threshold filters out weak histogram fluctuations between divergence points.
- **Price Action Confirmation:**
The divergence is only confirmed when the price forms a new high or low (depending on the type), and the MACD forms an opposing structure.
- **Consecutive Divergence Detection:**
For high-conviction setups, the script detects sequences of two or more divergences in the same direction.
These use stricter filters and flag rare but powerful market turning points.
Signals are plotted using plotshape() with visual differentiation between regular and consecutive setups. You can enable/disable each type individually.
⏰ Note: Histogram colors are styled similarly to TradingView’s built-in MACD for visual familiarity. However, this script is built entirely from scratch and does not reuse any internal TV code.
---
🔷 2. Trend Filtering via Vegas Tunnel
The **Vegas Tunnel** module plots 5 configurable EMAs (default: 12, 144, 169, 576, 676) to evaluate trend direction.
The trend is considered **bullish** when short EMAs (144/169) are positioned above long EMAs (576/676), and the price is interacting with the short EMA tunnel.
Conversely, a bearish condition is detected when the opposite is true.
A visual triangle marker highlights trend zones, and users can hide/show individual EMAs.
---
🔷 3. ATR-Based Dynamic Stop Loss
This module plots dynamic stop levels above and below the current price based on ATR.
Default setting uses 13-period ATR, and users can customize the multiplier or disable the plot.
It serves as a visual guide for risk management in live trades.
---
🔷 4. Engulfing Pattern Recognition
Candlestick-based signal detection:
- **Bullish Engulfing** occurs when a candle closes above the prior high, and the prior bar is bearish.
- **Bearish Engulfing** when a candle closes below the prior low, and the prior bar is bullish.
Users can modify the logic to use open/close levels for looser or stricter detection.
These patterns are highlighted using plotshape markers and optionally included in the signal table.
---
🔷 5. RSI and OBV Divergence Modules
These modules follow similar logic to the MACD engine:
- Use pivotlow() / pivothigh() to detect swing points.
- Confirm divergence only when price moves in one direction while RSI or OBV moves in the opposite direction.
- Require a minimum distance (in bars) between the two pivots.
- Require a certain ratio between two indicator values and their corresponding prices.
You can only enable **one of MACD/RSI/OBV divergences at a time** to avoid visual overlap, as they share the same subplot.
---
🔷 6. FVG (Fair Value Gap) Auto Detection
This module detects large single-direction price moves where price leaves a visible gap between candle 3 bars ago and 1 bar ago.
- **Bullish FVG**: high < low
- **Bearish FVG**: low > high
ATR-based filters are applied to eliminate minor gaps.
Each gap is drawn as a box and optionally extended, with a central line marking the midpoint (CE - Consequent Encroachment) level.
Traders often look for price to return to this level as an entry signal.
---
🔷 7. Smart Signal Table
All active signals (MACD, Vegas, RSI, OBV, Engulfing) are collected into a **real-time table** that displays current market bias.
- Each module reports whether it is currently giving a bullish (🟢) or bearish (🔴) condition.
- Helps users assess signal alignment (confluence).
- The table is updated every bar and appears in the bottom-right corner.
---
🔷 8. Watermark & Branding
The watermark displays the script name and author at the top-right, and can be toggled via settings.
📌 Not a Mashup — Structured System, Not a Stack of Indicators
⚠️ This is not a random mashup of unrelated indicators.
Every module in this system was intentionally designed to support the core MACD divergence logic by filtering, validating, or amplifying its signals.
Here's how the system achieves signal confluence and structure:
Vegas Tunnel acts as a macro trend filter, helping users determine whether to favor long or short trades.
For example, bullish MACD divergence is more reliable when confirmed by an uptrend in the Vegas EMAs. This prevents users from trading against momentum.
Engulfing Patterns serve as entry-level price action confirmation.
When a bullish engulfing candle appears near a MACD bullish divergence — and trend conditions from Vegas are aligned — the confluence increases dramatically.
This is especially powerful when multiple modules confirm in the same direction on the right side of the chart.
RSI and OBV Divergence modules offer redundant but independent momentum views.
Users may enable them selectively to validate MACD signals, or to use them as standalone alternatives when MACD is flat or noisy.
FVG Zones provide context for entries or targets.
For instance, a MACD bullish divergence forming near a bullish FVG gap increases the odds of reversal.
Price often "fills" these imbalances, which aligns well with reversal setups.
The Smart Signal Table aggregates signals from all modules and provides a visual, real-time overview of the current market bias.
This allows traders to act only when multiple signals are aligned — for example, when MACD is bullish, trend is up, and a bullish engulfing just printed.
Together, this framework creates a coherent decision-making system, where each tool has a defined role: trend filtering, signal confirmation, risk management, or entry detection.
🧩 It is modular in architecture, but not modular in purpose.
This system was not built by stacking indicators, but by integrating logic across modules to support a high-conviction MACD-based strategy.
🧬 Originality Statement
This script is entirely original, developed from scratch without using external libraries or public script code. The logic is fully custom, especially the consecutive divergence detection system and signal integration.
⚠️ Disclaimer
This script is for educational and informational purposes only and does not constitute financial advice. Trade at your own risk.
---
📘 中文简要说明:
这是一个完全原创、闭源的交易系统,核心逻辑为 MACD 柱状图背离信号的识别,配合多模块共振判断,构建出一个高胜率的多信号共振策略。
本指标模块化结构清晰,主要包括:
- MACD 背离识别(支持连续背离)
- Vegas EMA 隧道趋势过滤
- RSI / OBV 背离模块
- 吞没形态识别
- FVG 平衡区间自动标注
- ATR 动态止损提示
- 智能信号面板(整合所有信号并可视化)
所有模块均可单独开启/关闭,适配顺势、逆势或多周期的交易风格。
本脚本为个人实战策略的程序化实现,逻辑完全由零开发,未使用任何公用代码。适合希望提高交易胜率和信号精准度的用户使用。
免责声明:本指标仅用于技术分析学习与参考,不构成任何投资建议。请您独立判断,自行承担交易风险。

Fair Value Gap MTF [by Oberlunar]Fair Value Gap MTF is a multi-timeframe indicator designed to detect and display Fair Value Gaps (FVGs) across up to five customizable timeframes. Fair Value Gaps are price inefficiencies—zones where the market moved too quickly, leaving unfilled areas between candles. These gaps are often used by traders as reference points for future price retracements, as they tend to be revisited or “mitigated” over time.
This indicator extends the traditional FVG concept by introducing dynamic multi-timeframe tracking. Each timeframe has its own visual layer, with distinct user-defined colors for bullish and bearish gaps. The script not only highlights newly formed FVGs but also updates them visually when they are touched by price. Mitigated FVGs are recolored in real time, and an optional setting allows the size of these zones to shrink progressively, reflecting only the remaining untested portion.
Labels at the center of each box display the originating timeframe, offering clear visual context. All calculations are properly aligned with the display chart, ensuring that each FVG is correctly projected into the current view, regardless of its timeframe of origin.
Fair Value Gaps often act as support or resistance levels. Bullish FVGs can serve as areas where price may find support, while bearish FVGs can signal potential resistance. When these zones are mitigated repeatedly, it typically reflects areas of institutional interest, liquidity pools, or zones of accumulation and distribution. Such behavior makes them particularly significant in breakout and reversal strategies.
— Oberlunar 👁️★
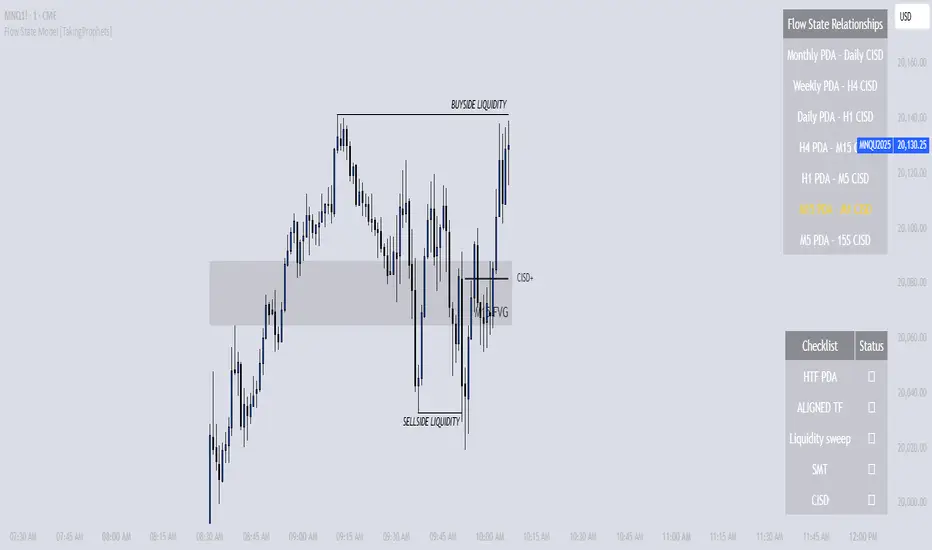
Flow State Model [TakingProphets]🧠 Indicator Purpose:
The "Flow State Model" by Taking Prophets is a precision-built trading framework based on the Inner Circle Trader (ICT) methodology. This script implements and automates the Flow State Model, a highly effective multi-timeframe trading system created and popularized by ITS Johnny.
It is designed to help traders systematically align higher timeframe liquidity draws with lower timeframe confirmation patterns, offering a clear roadmap for catching institutional moves with high confidence.
🌟 What Makes This Indicator Unique:
This is not a simple liquidity indicator or a basic FVG plotter. The Flow State Model executes a full multi-step process:
Higher Timeframe PD Array Detection: Automatically identifies and displays Fair Value Gaps (FVGs) from Daily, Weekly, and Monthly timeframes.
Liquidity Sweep Monitoring: Tracks swing highs and lows to detect Buyside or Sellside Liquidity sweeps into the HTF PD Arrays.
CISD Detection: Waits for a Change in State of Delivery (CISD) by monitoring bullish or bearish displacement after a sweep.
Full Trade Checklist: Visual checklist ensures all critical conditions are met before signaling a completed Flow State setup.
Sensitivity Control: Adapt detection strictness (High, Medium, Low) based on market volatility.
⚙️ How the Indicator Works (Detailed):
Fair Value Gap Mapping:
The indicator constantly scans higher timeframes (4H, Daily, Weekly) for valid bullish or bearish Fair Value Gaps that are large enough (based on ATR multiples) and not weekend gaps.
These FVGs are displayed on the current timeframe with full extension logic and mitigation handling (clearing when invalidated).
Liquidity Sweep Detection:
Swing highs and lows are identified using pivot logic (3-bar pivots). When price sweeps beyond a recent liquidity point into an active FVG, it flags the potential for a Flow State setup.
Change in State of Delivery (CISD) Confirmation:
After a sweep, the script monitors price action for a sequence of bullish or bearish candles followed by displacement (break in delivery).
Only after displacement closes beyond the initiating sequence does a CISD level plot, confirming the market's new delivery state.
Execution Checklist:
An optional table tracks whether critical components are present:
Higher Timeframe PD Array.
Aligned Timeframe Bias.
Liquidity Sweep into FVG.
SMT Divergence (optional manual confirmation).
CISD Confirmation.
Dynamic Management:
Active gaps are extended automatically.
Cleared gaps and mitigated CISDs are deleted to keep charts clean.
Distance-to-FVG prioritization keeps only the nearest active setups visible.
🎯 How to Use It:
Step 1: Identify the bias by locating active higher timeframe FVGs.
Step 2: Wait for a Liquidity Sweep into a PD Array (active FVG).
Step 3: Watch for a CISD event (the Flow State confirmation).
Step 4: Once all conditions are checked off, execute trades based on retracements to CISD levels or continuation after displacement.
Best Timing:
During ICT Killzones: London Open, New York AM.
After daily or weekly liquidity events.
🔎 Underlying Concepts:
Liquidity Theory: Markets seek to engineer liquidity for real institutional entries.
Fair Value Gaps: Imbalances where price is expected to react or rebalance.
Change in State of Delivery (CISD): Confirmation that the market's delivery mechanism has shifted, validating bias continuation.
Flow State Principle: Seamlessly aligning higher timeframe liquidity draws with lower timeframe confirmation to maximize trade probability.
🎨 Customization Options:
Adjust sensitivity (High / Medium / Low) for volatile or calm conditions.
Customize FVG visibility, CISD display, labels, line colors, and sizing.
Set checklist visibility and manual tracking of SMT or aligned bias.
✅ Recommended for:
Traders studying Inner Circle Trader (ICT) models.
Intraday scalpers and swing traders seeking confluence-driven setups.
Traders looking for a structured, checklist-based execution process.
Inner Circle Toolkit [TakingProphets]Inner Circle Toolkit — A Complete ICT Trading Companion
The Inner Circle Toolkit is a closed-source, all-in-one trading tool designed for traders following ICT (Inner Circle Trader) and Smart Money Concepts strategies. Every part of this script is built with purpose — not just a mashup of indicators, but a structured framework to help you follow price through the lens of institutional behavior and liquidity theory.
Let’s walk through what it does and how it can help you:
🕒 Session Liquidity Levels (Asia, London, New York, NY Lunch)
The indicator automatically marks the highs and lows of the major trading sessions:
-Asian Session
-London Session
-New York AM Session
-New York Lunch
These levels are important because price often returns to these points to grab liquidity before making a move. This gives traders clear areas to watch for potential sweeps, rejections, or reversals — without having to manually track session timings every day.
REQHs and REQLs — Equal Highs and Lows
This script detects Relatively Equal Highs and Lows (REQHs/REQLs), which are often used by institutions as stop-run targets.
It’s not just looking for copy-paste double tops or bottoms — it uses a tolerance-based algorithm that checks for clusters of similar highs or lows over a given time period. These are likely to hold stops and become magnets for price. When you see these on the chart, you’ll know where the “juice” is sitting.
Fair Value Gaps (FVG) — Multi-Timeframe
The script automatically plots Fair Value Gaps (FVGs) on both:
-Your current chart timeframe
-One or more higher timeframes (like H1 or H4)
These are three-candle gaps that form when price moves aggressively without filling in value. Price often comes back to these areas to rebalance. Seeing both local and higher-timeframe FVGs on your chart gives better context and helps with entries and exits.
The script is optimized so your chart doesn’t get messy — higher timeframe FVGs show up in a cleaner format with visual labels and lighter shading.
SMT Divergence — With Session Logic
This tool includes a real-time SMT divergence detector, based on the behavior of correlated markets like ES vs. NQ.
Here’s how it works:
If ES sweeps a liquidity level (like Asia Low), but NQ doesn’t, the script detects and marks that divergence.
This often signals institutional accumulation or distribution — a high-probability setup.
You won’t have to flip between charts or manually compare — the SMT logic runs automatically and only fires when it matters (at key session levels). It’s a smarter, more focused way to track intermarket divergences.
Daily Highs and Lows — Week-to-Week Structure
The indicator keeps track of the high and low for each day of the week — Monday through Friday — helping you understand how price is evolving across the week.
This helps build a weekly profile:
Did Monday set the high of the week?
Are we sweeping Tuesday’s low on Thursday?
These levels stay visible and labeled, helping you frame daily setups inside the bigger picture.
🕛 Midnight Open & 8:30 AM Open Levels
These two levels are core ICT concepts used to judge whether price is in premium or discount:
Midnight Open (00:00 EST): Used to determine daily bias
New York Open (08:30 EST): Often a launch point for key moves
Both are drawn automatically and extend throughout the day. This helps you align your trades with potential algorithmic bias, especially during NY session volatility.
⏰ 9:45 AM Vertical Marker — Macro Time Reminder
The script draws a subtle vertical line at 9:45 AM EST, which is the start of the NY AM macro session — one of the most likely times to see setups play out.
This is more than just a timer — it’s a visual cue that something important might be setting up soon, especially if you’re already watching SMT, FVGs, or liquidity zones from earlier.
How It All Connects — A Workflow, Not a Mashup
Every feature in this script is connected to the same goal: helping you trade with the Smart Money.
Here’s how the pieces work together:
Session levels → potential stop hunts
Equal highs/lows → targets
FVGs → entry points
SMT divergence → confirmation or warning
Daily highs/lows → Weekly structure frames bias
Open levels → premium vs. discount
Macro line → timing clue for execution
It’s built to help you flow with price action and trade the story, not just random signals.
Why It’s Closed Source — and Original
This script is closed-source because it contains:
A proprietary system for real-time SMT logic (with intermarket sweep detection)
Multi-timeframe FVG detection that auto-filters overlaps
Smart equal-high/low detection using range-based clustering
Optimized UI that shows a lot without overwhelming the chart
There are no moving averages, no public-domain indicators, and no mashup of standard tools. Everything here is purpose-built for traders who follow ICT strategies.
Let us know how we can improve!

Fair Value Gap Finder [Find Better Trades]Fair Value Gap Finder (FVG) – Spot Institutional Imbalances
📈 Identify Key Market Imbalances
The Fair Value Gap Finder automatically detects price inefficiencies where aggressive buying or selling has created an imbalance in liquidity. These gaps, often left by institutional traders, can serve as key areas for price to revisit before continuing its trend.
🔍 How It Works:
Highlights bullish Fair Value Gaps (FVGs) in green, signaling potential support zones.
Highlights bearish Fair Value Gaps (FVGs) in red, signaling potential resistance zones.
Uses ATR-based filtering to eliminate small, insignificant gaps, focusing only on high-probability setups.
Alerts included! Get notified when a valid Fair Value Gap is detected.
📊 How to Trade Using FVGs:
✅ For Buy Trades: Wait for price to return to a bullish FVG and confirm support before entering long.
✅ For Sell Trades: Wait for price to revisit a bearish FVG and confirm resistance before entering short.
✅ Use with candlestick patterns, trend analysis, or volume for additional confirmation.
⚙️ Customizable Settings:
Adjust the ATR Multiplier to control how large a gap must be before triggering a signal.
Enable alerts to stay informed in real time when new FVGs appear.
💡 Why Use This Indicator?
Fair Value Gaps are widely used by professional traders to spot areas of liquidity, making them valuable for scalping, swing trading, and institutional-style trading.
🚀 Add it to your TradingView chart and start trading with precision!

Directional Targets & POC TableThe "Directional Targets & POC Table" Pine Script™ is a comprehensive tool designed to help traders identify directional bias, potential price targets, and important levels like the Point of Control (POC). Additionally, it detects fair value gaps (FVGs) and order blocks, which are crucial concepts in Smart Money Concepts (SMC) trading. Here's an overview of its functionality:
1. Indicator Overview:
The script combines multiple technical tools into a single visual aid:
Directional Targets: Fibonacci-based upper and lower targets that provide a forecast of where the price might move.
Point of Control (POC): Midpoint of the daily range, displayed visually on the chart.
Fair Value Gaps (FVGs): Areas of imbalance in the market, potentially leading to price reversals.
Order Blocks: Areas where institutional traders might have entered large positions, potentially serving as support or resistance.
2. Key Features:
Directional Targets & POC Table:
A table is displayed in the top-right corner of the chart, showing:
Direction: Based on whether the price is above or below the POC.
Target ↑: The upper target, calculated using Fibonacci's 0.618 level, which acts as a potential resistance.
POC: The midpoint between the daily high and low, serving as the central level of interest.
Target ↓: The lower target, also calculated using the 0.618 Fibonacci level, which serves as potential support.
The table uses colors to make each level easily distinguishable, with green for bullish targets, red for bearish, and yellow for the POC.
POC Visualization:
The Point of Control (POC) is drawn on the chart as a box that stretches horizontally. It highlights the central price range where the highest volume or interest may have occurred, providing a key level for traders to watch.
The POC can act as a support or resistance area, with price frequently reacting at or near this level.
FVG Detection:
Fair Value Gaps are identified when there’s a price imbalance between two bars. These gaps occur when the high of one bar is lower than the low of a bar two periods earlier, or vice versa.
The script draws lines at the boundaries of these gaps, helping traders spot potential areas where the price may return to fill the gap.
If the price revisits and fills the gap, the FVG lines are automatically deleted, signaling the gap is no longer relevant.
Order Blocks Detection:
Bullish Order Blocks are detected when a strong bullish candle forms, where the close equals the high, and it’s higher than the previous bar’s low. This represents potential institutional buying interest.
Bearish Order Blocks are detected when a strong bearish candle forms, where the close equals the low, and it’s lower than the previous bar’s high, representing potential selling interest.
The order blocks are drawn as rectangles on the chart, marking significant price zones that may act as future support (bullish) or resistance (bearish).
3. Direction Determination:
The script calculates the daily high, low, and mid-point (POC). If the current price is above the POC, the market is deemed bullish; if it’s below, the market is bearish. If it’s near the POC, the market is considered neutral.
This directional bias is then displayed in the table, giving traders an easy way to assess whether they should be looking for long or short opportunities.
4. Use Case:
This script is particularly useful for traders who:
Want to identify key levels like the POC and potential price targets based on Fibonacci retracement.
Follow Smart Money Concepts (SMC) and need tools to detect FVGs and order blocks, which can signal areas of market imbalance or institutional involvement.
Need a simple visual aid to determine market direction and structure, helping them make informed trading decisions.
5. Additional Features:
The script is highly visual, providing both numeric information in a table and plotted elements (lines, boxes) directly on the chart.
The automatic detection and clearing of FVGs and order blocks make this tool dynamic and easy to follow.
The script helps identify areas where price might react, giving traders a roadmap to follow for potential entries, exits, or take-profit levels.
This indicator is designed for traders looking to incorporate both conventional and advanced concepts like Fibonacci targets, POC, and SMC principles (FVGs and Order Blocks) into their strategy.

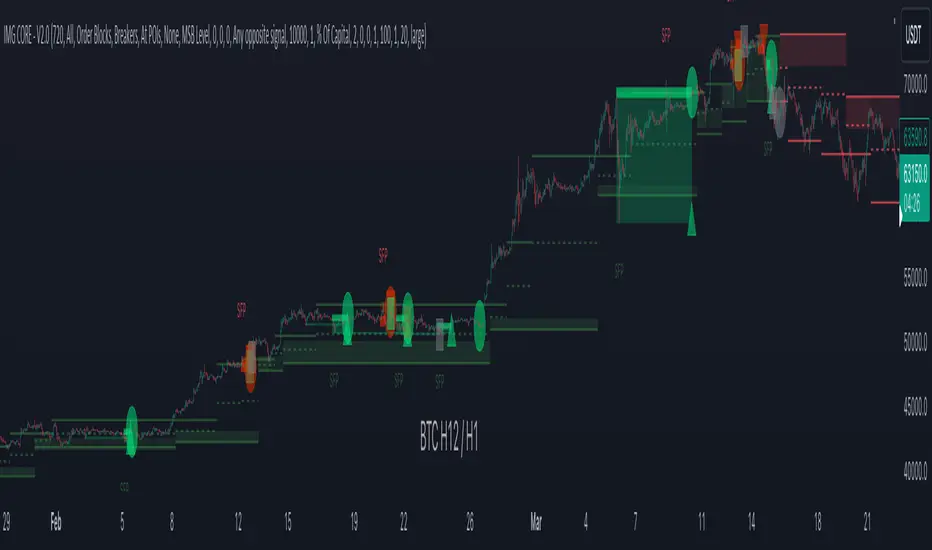
IMGCore - V1.0IMG Core uses five sequential stages to analyse price action and alert users to potential Trade Setups using various Price Action Concepts as detailed below:
1. Identify Higher Timeframe Market Structure and Points of Interest (HTF-POIs)
2. Calculate position size based on your risk appetite, fees and account leverage and customisable maximum trade risk
3. Alert you to risk managed trade setups at enabled HTF-POIs
4. Alert you to trade exits based on your set criteria
5. Provide Additional Alerts such as Higher Timeframe SFPs and Market Structure Breaks that act as potential early warnings that a trade setup may be forming
1. HTF POIs Available with IMG CORE:
a. HTF Market Structure Range Highs and Lows
b. HTF Order Blocks
c. HTF Breakers
d. HTF FVGs
a. Higher Timeframe Market Structure Range High and Low through Multiple Timeframe Analysis:
Market Structure can be defined using several techniques. The IMG indicators employ the Close through High/Low technique, which necessitates a candle to close through a structural level to validate a structural break and designate a new range.
Example: H12 Market Structure visualisation on a H12 Chart with annotations:
By selecting a particular Market Structure timeframe in the settings, the indicator immediately illustrates both current and historical market structures for the chosen timeframe across all subordinate timeframes, subject to the limitations of your Tradingview subscription.
Example: H12 Market Structure visualisation on a H1 Chart with annotations:
b. Higher Timeframe Order Blocks
An Order Block represents the last candle of the opposite direction preceding a Market Structure Break. For instance, a bullish Order Block is identified as the final bearish candle leading to a bullish market structure break, and vice versa for bearish Order Blocks.
Example: H12 OB visualisation on a H12 Chart with annotations:
When activated, the indicator will highlight the Higher Timeframe Order Blocks responsible for a Market Structure Break on all subordinate timeframes relative to the chosen Market Structure Timeframe.
Note: if multiple OBs exist, the indicator will display the OB closest to the new range extreme
Example: H12 OB visualisation on a H1 Chart with annotations:
c. Higher Timeframe Breakers
A Breaker Block is identified as the most recent Order Block that has been breached by price, leading to an opposite Market Structure Break. For example, a bullish Breaker Block is the last bearish Order Block that price has passed through, confirming a bullish structural break, and the inverse is true for bearish Breakers.
Example: H12 Breaker visualisation on a H12 Chart with annotations:
Once enabled, the system will display Higher Timeframe Breaker Blocks after an opposite Market Structure Break is confirmed on all subordinate timeframes.
Example: H12 Breaker visualisation on a H1 Chart with annotations:
d. Higher Timeframe Fair Value Gaps (FVGs)
A Fair Value Gap is a concept used by price action traders to identify market inefficiencies, where buying and selling are not balanced. It appears on a chart as a triple-candle pattern, with a large candle flanked by two others whose highs and lows do not overlap with the large candle, creating a gap. This gap often attracts the price towards it before the market resumes its previous direction.
Example of the indicator displaying a Higher Timeframe’s FVGs on a Lower Timeframe (LTF) chart:
-The upper chart labelled H12/H12 is the indicator displaying H12 Structure and FVGs on a H12 chart.
-The lower chart labelled H12/H1 is the indicator displaying H12 FVGs on a H1 chart
2. Risk Management and Position Sizing:
a. Automated Position Sizing:
The System will automatically calculate position size based on the account size, max leverage and risk appetite (capital risk per trade) details input in settings. Calculated trade details are included in the Tradingview Alerts as well as interactive labels on the charts.
Details include but are not limited to:
Trade Timeframe
Side: Long/Short
Type: Limit/Market
Position Size in $ and Units
Lot sizes if applicable
Trade Risk %
Take Profit Level
Entry Price
Stoploss Price
b. Maximum Trade Risk:
IMG Core has the ability to invalidate potential trade entries if it exceeds your maximum Trade Risk threshold. Trade Risk is the % price difference between entry and stoploss.
When an invalid signal is generated, the signal will not be shaded and the interactive label will display the reason for invalidation
In the example below, Max Trade Risk is set to 2% , but the trade signal had a trade risk of 5.11% , invalidating the signal with a grey triangle
3. Trade Setup Types Available with IMG CORE:
The system will alert you to potential trade setups at these HTF POIs: .
a. Higher Timeframe (HTF) Swing Failure followed by a Lower Timeframe (LTF) MSB at Range Extremes
b. Higher Timeframe (HTF) Swing Failure followed by a Higher Timeframe (HTF) MSB at enabled HTF POIs
c. Lower Timeframe (LTF) Swing Failure followed by a Lower Timeframe (LTF) MSB at enabled HTF POIs
d. Multiple LTF Entry Options once a signal is confirmed
a. HTF Swing Failure followed by a Lower Timeframe (LTF) MSB at Range Extremes
A Swing Failure Pattern (SFP) is a technical analysis concept used in trading to identify potential reversals in price trends. It occurs when the price attempts to surpass a previous high or low but fails to sustain that level, indicating a possible change in market direction. There are multiple methods to define a SFP but this indicator uses the failure to close through a Key Level. When confirmed, HTF SFPs will be displayed on-screen and an alert will fire if enabled.
Example: H12 SFPs at Range Extremes on a H1 Chart:
Alerts to Enter at Lower Timeframe MSBs
When enabled, a potential trade setup label and alert will generate when a HTF SFP is confirmed at a Range Extreme followed by a Chart Timeframe (Lower Timeframe) Market Structure Break (MSB). These signals are agnostic to current Market Structure bias and will generate at both extremes.
b. HTF Swing Failure followed by a Lower Timeframe (LTF) MSB at HTF POIs:
When enabled, a potential trade setup label and alert will generate when a HTF SFP is confirmed at an enabled Higher Timeframe POI (Order Blocks / Breakers / FVGs) followed by a Chart Timeframe (Lower Timeframe) Market Structure Break (MSB). These signals are always in line current Market Structure bias.
Example: H12 SFPs and Trade Setups at HTF POIs with Fluid Exits on a H1 Chart:
c. LTF Swing Failure followed by a LTF MSB at Range Extremes at enabled HTF POIs
The system will alert you to a lower timeframe setup if these conditions are met inside enabled HTF POIs (OBs / Breakers / FVGs):
- LTF SFP
- LTF MSB
Signals will alert you to enter a Limit Entry at the LTF MSB Level OR LTF Breaker
Example:
d. LTF Entry Options:
IMG CORE provides the following options for LTF Entries:
i. Limit Entry at Lower Timeframe MSB Levels
ii. Limit Entry at Lower Timeframe Breakers
Based on this selection, the trade setup alert will provide entry price details to set limit orders at the MSB level or LTF Breaker High.
4. Trade Exit Types Available with IMG CORE:
The system provides the following options for trade exit alerts:
i. User defined Risk to Reward (R:R)
ii. On a confirmed Opposite Signal (Fluid Exits)
Example: H12 Long Entry and Exit Signal using Fluid Exits H1 Chart:
5. IMG CORE Alerts Overview
The system provides notifications of:
1. Confirmed HTF Market Structure Breaks
2. Confirmed HTF SFPs at Range Extremes
3. Confirmed HTF SFPs at HTF POIs
4. Potential Trade Setups at Range Extremes
5. Potential Trade Setups at HTF Points of Interest (HTF-LTF and LTF-LTF)
6. Fixed R Trade Exits
7. Exit on Opposing Signals (Fluid Exits)
To enable alerts, right-click on the indicator and select “Add Alert on IMG ...”. You may customise the alert name as desired and then click 'Create' to finalise the alert setup.
General Note:
There is no system, indicator, algorithm, or strategy that can provide absolute certainty in predicting market movements. Use trading indicators as a tool to assist with trading decisions; manage your risk wisely.
Stay safe and Happy Trading!
SMC Pro+ ICT v4 Enhanced - FINAL🎯 SMC Pro+ ICT v4 Enhanced - Complete Smart Money Trading System📊 Professional All-in-One Indicator for Smart Money Concepts & ICT MethodologyThe SMC Pro+ ICT v4 Enhanced is a comprehensive trading system that combines Smart Money Concepts (SMC) with Inner Circle Trader (ICT) methodology. This indicator provides institutional-grade market structure analysis, liquidity mapping, and volume profiling in one powerful package.✨ CORE FEATURES🏗️ Advanced Market Structure Detection
MSS (Market Structure Shift) - Identifies major trend reversals with precision
BOS (Break of Structure) - Confirms trend continuation moves
CHoCH (Change of Character) - Detects internal structure shifts
Modern LuxAlgo-Style Lines - Clean, professional visualization
Dual Sensitivity System - External structure (major swings) + Internal structure (minor swings)
Customizable Labels - Tiny, Small, or Normal sizes
Structure Break Visualization - Clear break point markers
💎 Supply & Demand Zones (POI - Point of Interest)
Institutional Order Blocks - Where smart money enters/exits
ATR-Based Zone Sizing - Dynamically adjusted to market volatility
Smart Overlap Detection - Prevents cluttered charts
Historical Zone Tracking - Maintains up to 50 zones
POI Central Lines - Pinpoint entry/exit levels
Auto-Extension - Zones extend to current price
Auto-Cleanup - Removes broken zones automatically
📦 Fair Value Gap (FVG) Detection
Bullish & Bearish FVGs - Institutional inefficiencies
Consequent Encroachment (CE) - 50% fill levels
Auto-Delete Filled Gaps - Keeps charts clean
Customizable Lookback - 1-30 days of history
Color-Coded Zones - Easy visual identification
CE Line Styles - Dotted, Dashed, or Solid
🚀 Enhanced PVSRA Volume Analysis
This is one of the most powerful features:
200% Volume Candles - Extreme institutional activity (Lime/Red)
150% Volume Candles - High institutional interest (Blue/Fuchsia)
Volume Climax Detection - Major reversal signals with 2.5x+ volume
Exhaustion Signals - Identifies buying/selling exhaustion with high accuracy
Enhanced Volume Divergence - NEW! High-quality reversal detection
Price makes lower low, Volume makes higher low = Bullish Divergence
Price makes higher high, Volume makes lower high = Bearish Divergence
Strict trend context filtering for accuracy
Rising/Falling Volume Patterns - Momentum confirmation (allows 1 exception in 3 bars)
Volume Spread Analysis - Price range × Volume for true strength
Body/Wick Ratio Analysis - Candle structure quality
ATR Normalization - Adjusts for different market volatility
Volume Profile Indicators - 🔥 EXTREME, ⚡ VERY HIGH, 📈 HIGH, ✅ ABOVE AVG
💧 Advanced Liquidity System
Smart money targets these levels:
Weekly High/Low Liquidity - Major institutional targets
Daily High/Low Liquidity - Intraday key levels
4H Session Liquidity - Short-term targets
Distance Indicators - Shows % distance from current price
Strength Indicators - Identifies high-probability sweeps
Swept Level Detection - Tracks executed liquidity grabs
Customizable Line Styles - Width, length, offset controls
Color-Coded Levels - Easy visual hierarchy
🎯 Master Bias System
Data-driven directional bias with 9-factor scoring:
Bull/Bear Bias Calculation - 0-100% scoring system
Multi-Timeframe Analysis - Daily, 4H, 1H trend alignment
Kill Zone Integration - London (2-5 AM) & NY (8-11 AM) sessions
EMA Alignment Factor - Trend confirmation
Volume Confirmation - Adds 5% when volume supports direction
Range Filter Integration - Adds 10% for trending markets
Session Context - Above/below session midpoint scoring
Bias Strength Rating - STRONG (>75%), MODERATE (60-75%), WEAK (<60%)
Real-Time Updates - Dynamic recalculation
📈 Premium & Discount Zones
Fibonacci-based institutional pricing:
Extreme Premium - Above 78.6% (Overvalued)
Premium Zone - 61.8% - 78.6% (Expensive)
Equilibrium - 38.2% - 61.8% (Fair Value)
Discount Zone - 21.4% - 38.2% (Cheap)
Extreme Discount - Below 21.4% (Undervalued)
Visual Zone Boxes - Color-coded for instant recognition
200-500 Bar Lookback - Customizable range calculation
🔄 Range Filter
Advanced trend detection:
Smoothed Range Calculation - Eliminates noise
Dynamic Support/Resistance - Auto-adjusting levels
Upward/Downward Counters - Measures trend strength
Color-Coded Line - Green (uptrend), Red (downtrend), Orange (ranging)
Adjustable Period - 1-200 bars
Multiplier Control - Fine-tune sensitivity (0.1-10.0)
🌊 Liquidity Zones (Vector Zones)
PVSRA-based horizontal liquidity:
Above Price Zones - Resistance clusters
Below Price Zones - Support clusters
Maximum 500 Zones - Professional-grade capacity
Body/Wick Definition - Choose zone boundaries
Auto-Cleanup - Removes cleared zones
Color Override - Custom styling options
Transparency Control - 0-100% opacity
📊 EMA System
Triple EMA trend confirmation:
Fast EMA (9) - Green line - Immediate trend
Medium EMA (21) - Blue line - Short-term trend
Slow EMA (50) - Red line - Major trend
EMA Alignment Detection - Bull/Bear stack confirmation
Dashboard Integration - Status: 📈 BULL ALIGN, 📉 BEAR ALIGN, 🔀 MIXED
Adjustable Lengths - Customize all three EMAs (5-200)
🎯 IDM (Institutional Decision Maker) Levels
Key institutional price levels:
Latest IDM Detection - 20-bar pivot lookback
Extended Lines - Projects 50 bars into future
Customizable Styles - Solid, Dashed, or Dotted
Line Width Control - 1-5 pixels
Color Selection - Match your chart theme
Price Label - Shows exact level with tick precision
📱 Professional Dashboard
Real-time market intelligence panel:
🎯 SIGNAL - 🟢 LONG, 🔴 SHORT, ⏳ WAIT, 🛑 NO TRADE
🎲 BIAS - Bull/Bear with STRONG/MODERATE/WEAK rating
📊 BULL/BEAR Scores - 0-100% percentage display
💎 ZONE - Current premium/discount location
🕐 KZ - Kill Zone status (🇬🇧 LONDON/🇺🇸 NY/⏸️ OFF)
🏗️ STRUCT - Market structure status (BULLISH/BEARISH/NEUTRAL)
⚡ EVENT - Last structure event (MSS/BOS)
⚡ INT - Internal structure trend
🎯 IDM - Latest institutional level
📊 EMA - EMA alignment status
🔄 RF - Range Filter direction
📊 PVSRA - Volume status (🚀 CLIMAX/📈 RISING/📉 FALLING)
📅 MTF - Multi-timeframe alignment (✅ FULL/⚠️ PARTIAL/❌ CONFLICT)
💪 CONF - Confidence score (0-100%)
📊 VOL - Volume ratio (e.g., 1.8x average)
Advanced Metrics (Toggle On/Off):
📏 RSI - Value + Status (OVERBOUGHT/STRONG/NEUTRAL/WEAK/OVERSOLD)
📈 MACD - Value + Direction (BULL/BEAR)
🌪️ VOL - Volatility state (⚠️ EXTREME/🔥 HIGH/📊 NORMAL/😴 LOW)
🔊 VOL PROF - Volume profile ratio
⏱️ TF - Current timeframe
Dashboard Customization:
4 Positions - Top Left, Top Right, Bottom Left, Bottom Right
3 Sizes - Small, Normal, Large
2 Modes - Compact (MTF combined) or Full (separate rows)
Professional Design - Dark theme with color-coded cells
🎮 TRADING SIGNALS & SETUP SCORING🟢 LONG Setup Requirements (9-Factor Confidence Score)
MTF Alignment - Daily/4H/1H/Structure all bullish (+2 points for full, +1 for partial)
Volume Confirmation - Above 1.2x average (+1 point)
Structure Event - MSS or BOS bullish (+2 points)
EMA Alignment - 9 > 21 > 50 (+1 point)
Kill Zone Active - London/NY + Bull bias >75% (+2 points)
Bias Match - Master bias matches structure trend (+1 point)
Confidence Threshold - >60% minimum for signal
🔴 SHORT Setup Requirements
Same 9-factor system but inverted for bearish conditions.💪 Confidence Levels
75-100% - ⭐ HIGH CONFIDENCE (Strong setup, all factors aligned)
50-74% - ⚠️ MODERATE (Good setup, partial alignment)
0-49% - ❌ LOW CONFIDENCE (Wait for better setup)
🎯 Signal Output
🟢 LONG - Bull bias + Bullish structure + >60% confidence
🔴 SHORT - Bear bias + Bearish structure + >60% confidence
⏳ WAIT LONG - Bull bias but low confidence
⏳ WAIT SHORT - Bear bias but low confidence
🛑 NO TRADE - Neutral bias or conflicting signals
🔔 COMPREHENSIVE ALERT SYSTEM (12 Alerts)Structure Alerts
⚡ MSS Bullish - Major bullish reversal
⚡ MSS Bearish - Major bearish reversal
📈 BOS Bullish - Bullish continuation
📉 BOS Bearish - Bearish continuation
⚠️ CHoCH Bullish - Internal bullish shift
⚠️ CHoCH Bearish - Internal bearish shift
Bias & Confidence Alerts
🟢 Bias Shift Bull - Master bias turns bullish
🔴 Bias Shift Bear - Master bias turns bearish
⭐ High Confidence - Setup reaches 75%+ confidence
Volume Alerts (High Probability)
🚀 Volume Climax Buy - Extreme bullish volume spike
💥 Volume Climax Sell - Extreme bearish volume spike
⚠️ Selling Exhaustion - Potential bullish reversal
⚠️ Buying Exhaustion - Potential bearish reversal
📊 Bullish Volume Divergence - High-quality bullish reversal signal
📊 Bearish Volume Divergence - High-quality bearish reversal signal
🎨 EXTENSIVE CUSTOMIZATIONColors & Styling
✅ All colors customizable for every component
✅ Supply/Demand zone colors + outlines
✅ FVG colors (bullish/bearish)
✅ PVSRA candle colors (6 types)
✅ Liquidity level colors (Weekly/Daily/4H/Swept)
✅ Structure line colors
✅ Premium/Equilibrium/Discount zone colorsDisplay Controls
✅ Toggle each feature on/off independently
✅ Adjustable sensitivities (Structure: 5-30, Internal: 3-15)
✅ Label size controls (Tiny/Small/Normal)
✅ Line width adjustments (1-5 pixels)
✅ Transparency controls (0-100%)
✅ Extension lengths (20-100 bars)
✅ Lookback periods (50-500 bars)Volume Settings
✅ PVSRA symbol override (trade one asset, analyze another)
✅ Climax threshold (2.0-5.0x)
✅ Rising volume bar count (2-5 bars)
✅ Divergence filters (Strict/Lenient)
✅ Divergence minimum bars (10-30)
✅ Volume threshold multiplier (1.0-2.0x)Dashboard Settings
✅ Position (4 corners)
✅ Size (Small/Normal/Large)
✅ Compact/Full mode
✅ Show/Hide advanced metrics
✅ Show/Hide EMA status💡 BEST PRACTICES & USAGE TIPS⏰ Optimal Timeframes
Scalping - 1m, 5m (Use Kill Zones, Volume Climax, FVG)
Day Trading - 5m, 15m, 1H (Use Structure, Liquidity, Bias)
Swing Trading - 4H, Daily (Use MTF, Premium/Discount, Structure)
Position Trading - Daily, Weekly (Use major structure, liquidity)
🎯 Asset Classes
✅ Forex - All pairs (especially majors during Kill Zones)
✅ Crypto - BTC, ETH, altcoins (24/7 liquidity)
✅ Stocks - All stocks and indices (use session times)
✅ Commodities - Gold, Silver, Oil (high volume periods)
✅ Indices - S&P 500, NASDAQ, DAX, etc.🔥 High-Probability Setups
The Perfect Storm
MSS in direction of daily trend
Kill Zone active
Volume climax
Confidence >75%
Price in discount (long) or premium (short)
Volume Divergence Play
Enhanced volume divergence signal
CHoCH confirms direction change
Price near liquidity level
FVG forms for entry
Liquidity Sweep
Price sweeps weekly/daily high/low
Immediate rejection (selling/buying exhaustion)
Structure shift (MSS)
Volume confirmation
Structure Retest
BOS breaks structure
Price returns to POI/FVG
Volume confirms (>1.2x)
Kill Zone active
📊 Multi-Timeframe Analysis
Higher Timeframe - Identify trend & structure (Daily/4H)
Trading Timeframe - Find entries (15m/1H)
Lower Timeframe - Precise entries (1m/5m)
Look for MTF alignment - Dashboard shows ✅ FULL or ⚠️ PARTIAL
⚠️ Risk Management
Always use stop-loss (below/above recent structure)
Position size: 1-2% risk per trade
Target liquidity levels for take profit
Use supply/demand zones for SL placement
Watch for exhaustion signals near targets

Trend Gazer: Unified ICT Trading System with Signals# Trend Gazer User Guide (English)
## 📖 Table of Contents
1. (#about-this-indicator)
2. (#quick-start-guide-3-steps)
3. (#detailed-usage)
4. (#settings-customization)
5. (#why-combine-multiple-features)
6. (#faq)
---
## About This Indicator
**Trend Gazer** is an integrated trading system designed to read institutional order flow like professional traders.
### 🎯 3 Problems This Indicator Solves
#### ❌ Problem 1: Too Many Indicators = Information Overload
```
Normal: RSI + MACD + Moving Average + Bollinger Bands... → Cluttered chart
Solution: All integrated into ONE indicator → Clean & Clear
```
#### ❌ Problem 2: Single Indicators Give False Signals
```
Normal: Enter based on RSI alone → Frequent stop-outs
Solution: Structure × Zone × Momentum multi-angle confirmation → Higher win rate
```
#### ❌ Problem 3: Unclear Entry Timing
```
Normal: Know the trend but don't know WHERE to enter
Solution: LS Bounce Signal shows EXACT entry points
```
---
## Quick Start Guide (3 Steps)
### 🚀 STEP 1: Confirm Trend Direction
**Look for CHoCH (Change of Character)**
```
📍 (1.CHoCH) label = Uptrend starting
📍 (a.CHoCH) label = Downtrend starting
```
**Important**: Wait for CHoCH! No direction without it.
---
### 🎯 STEP 2: Find Entry Points
**Wait for LS Bounce Signal (green/red labels)**
```
🟢 "Long@ HL only" label → LONG (buy) candidate
🔴 "Short@ LH only" label → SHORT (sell) candidate
```
**Label text color meaning**:
- **White text**: Clean trend (high confidence)
- **Yellow text**: Trend transition (moderate caution)
---
### 🛡️ STEP 3: Final Confirmation with Bar Color
**Bar color shows market state**
```
🔴 Red bar: BUY zone (buying is favored)
🟢 Green bar: SELL zone (selling is favored)
⚪ White bar: Neutral (wait and see)
```
---
## Detailed Usage
### 📊 Understanding the Chart
#### 1. Labels (Market Structure Changes)
```
(1.CHoCH) / (a.CHoCH) : Trend reversal
(2.SiMS) / (b.SiMS) : Momentum confirmation
(3.BoMS) / (c.BoMS) : Trend continuation
```
#### 2. Boxes (Institutional Order Zones)
```
📦 Blue boxes: Bullish OB (buy orders accumulated)
📦 Red boxes: Bearish OB (sell orders accumulated)
📦 Black transparent boxes: Liquidity Sweep
```
**How to use Order Blocks**:
- Function as support/resistance
- Signals within OB have higher reliability
- Use for stop-loss placement
#### 3. Lines (Trends and Support/Resistance)
```
━━━ Red lines: EMA20, EMA50, EMA100 (short to mid-term trends)
━━━ Blue lines: 60min NPR/BB bands (support/resistance)
```
#### 4. Bar Colors (Filter 6)
```
Bar color = Real-time market state
🔴 Red: Buying is favored
🟢 Green: Selling is favored
⚪ White: Neutral
```
---
### 🎯 Practical Trading Flow
#### 📍 Preparation Phase
```
1. Open chart (recommended: 5min or 15min)
2. Add Trend Gazer to chart
3. Start in observation mode (don't enter yet)
```
#### 📍 Entry Decision
```
✅ CHoCH confirms direction → Uptrend starting
✅ LS Bounce Signal "Long@ HL only" appears
→ Entry point candidate
✅ Bar turns red → Market supports buying
→ Entry decision 🎯
✅ Place stop below nearest Order Block (blue box)
```
#### 📍 Exit Decision
```
🔴 Opposite LS Bounce Signal "Short@ LH only" appears
→ Consider taking profit
🔴 Bar turns green
→ Potential trend reversal, review position
🔴 Stop loss hit
→ Exit with loss
```
---
### 💡 Tips for Higher Win Rate
#### ✅ DO's
```
1. Enter AFTER CHoCH appears
2. Prioritize white-text LS Bounce Signals
3. Check higher timeframe (1H or Daily) trend
4. Emphasize signals within Order Blocks
5. Use bar color as final confirmation
```
#### ❌ DON'Ts
```
1. Enter before CHoCH → No clear direction
2. Enter only on yellow text → Unstable transition period
3. Ignore bar color → Trading against market state
4. Don't check Order Blocks → Unclear support/resistance
5. Enter same direction consecutively → Overtrading
```
---
## Settings Customization
### 🔧 How to Open Settings
```
1. Right-click on indicator name on chart
2. Select "Settings..."
3. Settings panel opens
```
---
### 📋 Recommended Setting Profiles
#### 🔰 Beginner Settings (Simple)
**Goal**: Reduce noise, show only important signals
```
【FILTERS】
✅ Bonus Filter: ON
✅ Filter 6 (OB/BB/NPR Zone Filter): ON
❌ Direction Filter: OFF
❌ Liquidation Reversal Filter: OFF
❌ ICT Market Structure Filter: OFF
❌ EMA Trend Filter: OFF
❌ OB/FVG Filter 1: OFF
❌ OB/FVG Filter 2: OFF
【SIGNALS】
✅ Signal 0 (Bonus): ON
✅ Signal 1 (VWC Change): ON
✅ Signal 2 (Liq Rev): ON
❌ Signal 3 (LS): OFF (complex alone)
❌ Signal 4 (LS Break): OFF
❌ Signal 5 (OB+LS NPR): OFF
❌ Signal 6 (OB+LS EMA): OFF
【LS BOUNCE SIGNAL】
✅ Exclude EMA50 from touch detection: OFF
❌ Only show when EMA fills are mixed: OFF
```
**What happens with this setup**:
- Only Bonus (black background) signals display
- LS Bounce Signals clearly visible
- Noisy signals filtered out
---
#### 💪 Intermediate Settings (Balanced)
**Goal**: Enable key filters for better accuracy
```
【FILTERS】
✅ Bonus Filter: ON
✅ Filter 6 (OB/BB/NPR Zone Filter): ON
✅ ICT Market Structure Filter: ON
❌ Direction Filter: OFF
❌ Liquidation Reversal Filter: OFF
❌ EMA Trend Filter: OFF
❌ OB/FVG Filter 1: OFF
❌ OB/FVG Filter 2: OFF
【SIGNALS】
✅ Signal 0 (Bonus): ON
✅ Signal 1 (VWC Change): ON
✅ Signal 2 (Liq Rev): ON
✅ Signal 3 (LS): ON
❌ Signal 4 (LS Break): OFF
❌ Signal 5 (OB+LS NPR): OFF
❌ Signal 6 (OB+LS EMA): OFF
【LS BOUNCE SIGNAL】
✅ Exclude EMA50 from touch detection: OFF
❌ Only show when EMA fills are mixed: OFF
```
**What happens with this setup**:
- Signals only after CHoCH (trend confirmed)
- Filter 6 changes bar colors
- Liquidity Sweeps also displayed
---
#### 🚀 Advanced Settings (Full Utilization)
**Goal**: Master all features
```
【FILTERS】
✅ Bonus Filter: ON
✅ Filter 6 (OB/BB/NPR Zone Filter): ON
✅ ICT Market Structure Filter: ON
✅ Direction Filter: ON
✅ EMA Trend Filter: ON
❌ Liquidation Reversal Filter: OFF (optional)
✅ OB/FVG Filter 1: ON
✅ OB/FVG Filter 2: ON
【SIGNALS】
✅ All ON
【LS BOUNCE SIGNAL】
✅ Exclude EMA50 from touch detection: ON (reduce EMA50 noise)
✅ Only show when EMA fills are mixed: ON (show only transition zones)
```
**What happens with this setup**:
- Fewer signals (precision-focused)
- Multiple confirmations greatly reduce false signals
- Only signals confirmed by trend, momentum, and zones
---
### 🎨 Display Customization
#### Change Label Size
```
【BUY/SELL SIGNAL APPEARANCE】
→ "BUY/SELL Label Size"
→ Choose from: tiny / small / normal / large / huge
Recommended: small (default)
```
#### Order Block Display Settings
```
【ORDER BLOCK (OB) SETTINGS】
✅ Show Current TF OB: Current timeframe OB
✅ Show 1min OB: 1-minute OB
✅ Show 5min OB: 5-minute OB
✅ Show 15min OB: 15-minute OB
Recommended: Only 15min OB ON (simple)
```
#### Liquidity Sweep Display
```
【LIQUIDITY SWEEPS SETTINGS】
→ "Sweep Length": Sensitivity (small=frequent, large=selective)
→ "Sweep Option": Standard / Maximum
Recommended: Length=40, Option=Standard
```
#### NPR/BB Bands Display
```
【NPR (NON-REPAINT STDEV) SETTINGS】
✅ Display 60min NPR Bands: 60-minute support/resistance
❌ Display Current TF NPR Bands: Current timeframe (optional)
Recommended: Only 60min ON
```
---
### ⚙️ Advanced Settings
#### Fine-tune Filter 6
```
【FINAL FILTERS】
→ "Enable Filter 6 (OB/BB/NPR Zone Filter)"
When ON:
- Bars color-coded red/green/white
- Behavior at OB, NPR/BB touches controlled
```
#### LS Bounce Signal Adjustments
```
【LS BOUNCE SIGNAL】
→ "Exclude EMA50 from touch detection"
OFF: Detect NPR/BB/EMA50 (all 3)
ON: Detect NPR/BB only (exclude EMA50)
→ "Only show when EMA fills are mixed"
OFF: Show all LS Bounce Signals
ON: Show only transition zone signals (yellow text)
```
#### MTF (Multi-Timeframe) Control
```
【ORDER BLOCK (OB) SETTINGS】
→ "Disable MTF on 1hr+ Charts"
ON: Disable MTF on 1H+ (save memory)
OFF: MTF enabled on all timeframes
Recommended: ON (unnecessary on larger timeframes)
```
---
### 🎯 Purpose-Based Configuration Guide
#### 🔍 Goal 1: Reduce Signal Count
```
✅ Bonus Filter: ON
✅ ICT Market Structure Filter: ON
✅ Filter 6: ON
✅ All Signals OFF, only Signal 0 ON
```
#### 🔍 Goal 2: Get More Signals
```
❌ All Filters OFF
✅ All Signals ON
```
#### 🔍 Goal 3: Trend Following Only
```
✅ ICT Market Structure Filter: ON
✅ Direction Filter: ON
✅ EMA Trend Filter: ON
```
#### 🔍 Goal 4: Counter-Trend Trading
```
✅ LS Bounce Signal: ON
✅ Filter 6: ON
❌ ICT Market Structure Filter: OFF
```
#### 🔍 Goal 5: Day Trading (5-15min charts)
```
✅ Show 15min OB: ON
✅ Display 60min NPR Bands: ON
✅ LS Bounce Signal: ON
❌ Show 1min/5min OB: OFF
```
#### 🔍 Goal 6: Scalping (1-5min charts)
```
✅ Show 5min OB: ON
✅ Show 15min OB: ON
✅ Display 60min NPR Bands: ON
✅ All Signals: ON
```
---
### 💾 Saving and Loading Settings
#### Save Settings
```
1. Click "..." in top-right of Settings screen
2. Select "Save as default"
→ Same settings auto-applied next time
```
#### Reset Settings
```
1. Click "..." in top-right of Settings screen
2. Select "Reset settings"
→ Return to default settings
```
---
## Why Combine Multiple Features?
### 🎯 Problem: Single Indicator Limitations
Common trader problems:
```
❌ RSI alone → Trade against trend, lose
❌ Moving Average alone → Late entry timing
❌ Support/Resistance alone → Caught by false breakouts
```
**Markets are complex**. One angle isn't enough.
---
### 💡 Solution: Multi-Angle Integrated Approach
#### 1️⃣ Structure × Zone × Momentum
```
📐 Structure (ICT CHoCH)
→ "Which direction is likely?"
📦 Zone (OB/NPR/BB)
→ "Where will price react?"
💨 Momentum (EMA/VWC)
→ "Is there momentum now?"
```
**When all 3 align = Highest win-rate timing**
---
#### 2️⃣ Multi-Timeframe Analysis
```
Big picture: Confirm Daily direction
Medium-term: Check 1H Order Blocks
Short-term: Time entry on 5min
```
**Short-term entries aligned with higher timeframes = Better win rate**
---
#### 3️⃣ Understanding Liquidity
```
🎣 Institutional strategy:
1. Intentionally move price opposite to stop out retail
2. Then, move in real direction
💡 Liquidity Sweep = Visualize this "trap"
→ Read institutional order flow
```
---
### 🧠 Integration Examples
#### Case 1: RSI Alone vs Integrated System
**Scenario**: RSI at 30 (oversold)
```
❌ RSI-only decision:
→ "Buy!"
→ But downtrend continues, loss 😢
✅ Trend Gazer:
CHoCH check → Still downtrend ❌
Order Block → In Bearish OB ❌
LS Bounce → SHORT signal only ❌
→ Skip or SHORT
→ Avoid loss ✅
```
**Result**: Multiple filters block wrong entry
---
#### Case 2: LS Bounce Signal 2-Stage Logic
**Scenario**: Price touches 60min NPR lower band
```
🔍 Traditional method:
Touched → Buy!
→ But price continues down 😢
✅ Trend Gazer:
Stage 1: NPR touch + red bar → Flag ON
Stage 2: EMA20 crosses above EMA50 → Confirm bounce
→ Now "Long@ HL only" displays
→ Entry → Success ✅
```
**Result**: Not just "touch" but "touch + bounce confirmation" improves accuracy
---
### 🎓 Progressive Learning Design
This indicator is designed for **beginners to advanced**:
```
📖 Beginner (Month 1):
Use only CHoCH + LS Bounce Signal
→ Learn trend and entry points
📖 Intermediate (Months 2-3):
Add Order Block + Bar Color
→ Learn support/resistance and filtering
📖 Advanced (Month 6+):
Master all features
→ Read institutional order flow
```
**Ultimate goal**: Indicator becomes confirmation tool. Your market sense becomes primary.
---
### 🔬 Technical Advantages
#### 1. Non-Repaint STDEV (NPR)
```
Normal Bollinger Bands:
→ Past data changes (repaints)
→ Inaccurate backtesting
NPR:
→ Past data doesn't change (non-repaint)
→ Reliable verification possible
```
#### 2. 2-Stage Signal Logic
```
Traditional: Condition met → Immediate signal
→ Many false signals
Trend Gazer: Condition1 → Flag ON → Condition2 → Signal
→ Confirmation step improves accuracy
```
#### 3. Alternating Filter
```
Problem: Same-direction signals spam
→ Overtrading
Solution: LONG → SHORT → LONG alternating only
→ Prevent unnecessary entries
```
---
### 💎 Conclusion: Why Integration?
```
Single indicator = "Partial truth"
Integrated system = "3D market perspective"
```
**Markets are multifaceted**. One angle isn't enough.
Trend Gazer **integrates multiple screens pros watch simultaneously into ONE**,
allowing beginners to read charts with institutional perspective.
---
## FAQ
### ❓ Q1: Which timeframe is best?
**A**: Depends on trading style
```
Scalping: 1min ~ 5min
Day Trading: 5min ~ 15min
Swing: 1H ~ 4H
```
**Important**: LS Bounce Signal only works on 30min and below.
---
### ❓ Q2: Too many signals, confused
**A**: Enable filters
```
【Recommended Settings】
✅ Bonus Filter: ON
✅ Filter 6: ON
✅ ICT Market Structure Filter: ON
→ Show only Signal 0
```
This significantly reduces signal count.
---
### ❓ Q3: No CHoCH appearing, what to do?
**A**: Wait or check higher timeframe
```
Method 1: Wait for CHoCH (recommended)
Method 2: Check higher timeframe (e.g., Daily) for trend
Method 3: Disable ICT Filter (not recommended)
```
**When trend is unclear, sitting out is also strategy**.
---
### ❓ Q4: LS Bounce Signal not appearing
**A**: Checkpoints
```
1. Are you on 30min or below chart?
→ Doesn't show on 1H+
2. Are NPR/BB bands displayed?
→ Check Settings "Display 60min NPR Bands"
3. Is EMA50 excluded?
→ If "Exclude EMA50" is ON, EMA50 signals won't show
```
---
### ❓ Q5: Bar color not changing?
**A**: Check Filter 6
```
Settings → FINAL FILTERS
→ Confirm "Enable Filter 6 (OB/BB/NPR Zone Filter)" is ON
If ON but still not changing:
→ Current price may be outside OB/NPR/BB zones
```
---
### ❓ Q6: Too many Order Blocks, hard to see
**A**: Narrow down displayed OBs
```
Settings → ORDER BLOCK (OB) SETTINGS
Recommended:
❌ Show Current TF OB: OFF
❌ Show 1min OB: OFF
❌ Show 5min OB: OFF
✅ Show 15min OB: ON (only this)
```
---
### ❓ Q7: How to improve win rate?
**A**: Thorough multiple confirmations
```
Checklist:
✅ CHoCH appeared
✅ LS Bounce Signal (white text)
✅ Bar color matches (red bar=LONG, green bar=SHORT)
✅ Signal within Order Block
✅ Aligns with higher timeframe trend
Enter ONLY when all align
```
---
### ❓ Q8: Want to practice on demo
**A**: Recommended practice method
```
Week 1: Observation only
→ Watch signals and chart movement
→ Resist entering
Weeks 2-3: Keep records
→ Screenshot when signal appears
→ Record subsequent movement
Week 4+: Start demo trading
→ Start with small amounts
→ Continue keeping records
```
---
### ❓ Q9: Are there alert features?
**A**: Yes, multiple alerts available
```
Setup method:
1. Right-click indicator on chart
2. Select "Add Alert..."
3. Choose from:
- ANY ALERT: BUY/SELL Signals
- BUY ONLY ALERT
- SELL ONLY ALERT
- MS UP / MS DOWN
- BAR COLOR: RED / LIME
- LS BOUNCE: LONG / SHORT Signal
```
---
### ❓ Q10: Works on other markets?
**A**: Yes, works on all markets
```
✅ Cryptocurrency (BTC, ETH, etc.)
✅ Forex (EUR/USD, USD/JPY, etc.)
✅ Stocks (individual stocks, indices)
✅ Futures (oil, gold, etc.)
```
Works on any market with price and volume data.
---
## 📋 Disclaimer
### ⚠️ Important Notice
This indicator is for **educational and informational purposes only**.
```
❌ NOT investment advice
❌ Does NOT guarantee profits
❌ Past results do NOT guarantee future performance
```
### Risk Warning
```
⚠️ Trading involves substantial risk
⚠️ Only trade with funds you can afford to lose
⚠️ Practice extensively on demo account before live trading
⚠️ Make your own informed decisions and act at your own risk
```
---
## 📞 Support
### Feedback & Questions
Feel free to ask questions in TradingView comments section.
### Bug Reports
Please report with specific details (timeframe, symbol, screenshots).
---
**Author**: rasukaru666
**License**: Mozilla Public License 2.0
**Last Updated**: December 2025
**Version**: Latest
---
**Thank you for using Trend Gazer!**
**Happy Trading! 📈**
---------------

TCT OBIF Detector█ OVERVIEW
The OBIF (Order Block Imbalance Fill) indicator automatically detects and visualizes high-probability trading zones by combining two powerful Smart Money Concepts: Order Blocks and Fair Value Gaps (FVGs).
An OBIF occurs when an Order Block forms immediately before a Fair Value Gap, creating a zone of institutional interest that price often revisits before continuing its move.
█ CONCEPTS
Order Block (OB)
An Order Block is the last opposing candle before a strong directional move. It represents an area where institutional traders likely placed orders.
- Bullish OB: Last bearish candle before an up-move
- Bearish OB: Last bullish candle before a down-move
Fair Value Gap (FVG)
An FVG is a price imbalance created when a candle's body completely gaps past the previous candle's range, leaving an unfilled area.
- Bullish FVG: Gap up where candle .low > candle .high
- Bearish FVG: Gap down where candle .high < candle .low
OBIF Zone
When an Order Block directly precedes an FVG, it creates an OBIF - a confluence zone with higher probability of acting as support/resistance.
█ HOW TO USE
1. Identify the Trend
Use OBIFs in the direction of the higher timeframe trend for best results.
2. Wait for Price to Return
OBIFs act as magnets - price often returns to fill the imbalance and test the order block.
3. Look for Confirmation
When price enters an OBIF zone, look for:
- Rejection wicks
- Engulfing patterns
- Break of structure on lower timeframes
4. Mitigation
Once price fully trades through the OBIF (touches the opposite edge), the zone is considered mitigated and loses its significance.
█ FEATURES
- Automatic Detection — Identifies OBIFs in real-time as they form
- Visual Zones — Clean, non-intrusive boxes that don't obscure price action
- Mitigation Tracking — Zones automatically update when price mitigates them
- Multi-Timeframe Friendly — Works on any timeframe from 1m to Monthly
- Customizable — Adjust colors, opacity, and display preferences
█ SETTINGS
- Lookback Window — How many candles back to search for the Order Block (default: 3)
- Show Bullish/Bearish — Toggle visibility of each type
- Show Mitigated — Display zones that have been mitigated (shown in gray)
- Fill Opacity — Adjust zone transparency (higher = more see-through)
- Border Width — Thickness of zone borders
█ BEST PRACTICES
✓ Use on higher timeframes (1H+) for more reliable zones
✓ Combine with market structure analysis
✓ Look for OBIFs at key support/resistance levels
✓ Use lower timeframe confirmation for entries
✗ Don't trade every OBIF blindly
✗ Avoid OBIFs against the dominant trend
█ CREDITS
The Composite Trader (TCT) methodologies.

ICC + Trident ORB UltimateICC + Trident ORB Ultimate – Indication / Correction / Continuation using multi-session ORB + confluence scoring
This tool is an intraday framework built around ICT-style Indication → Correction → Continuation (ICC) logic, using three coordinated Opening Range Boxes (“Trident ORB”) plus a confluence engine to grade breakouts and reversals.
It is not just a mashup of indicators. Each module has a specific role:
________________________________________
1. Core concept
The script combines:
• Three ORBs (“Trident”):
o European session ORB (bias & magnets)
o US Futures ORB (8:30 “engine” for the day)
o Cash session ORB (9:30 volatility filter)
• ICC structure:
o Indication – Directional bias from how price behaves around the Euro ORB (above = BULL, below = BEAR, inside = NEUTRAL).
o Correction – A dynamic Correction Zone built from the US Futures ORB (discount/premium area between ORB midline and range).
o Continuation – Qualified breakouts of the 8:30 ORB high/low, graded by a confluence score (A+/A/B/C).
• Confluence engine:
Optional filters (VWAP, RSI, FVG, SMT, swing structure, PDH/PDL, EMA stack, RTH) are combined into a single score and grade to highlight higher-probability continuation moves.
The goal is to give you one integrated view of:
session structure → day type → volatility → confluence → actionable breakouts/sweeps.
________________________________________
2. Trident ORB structure & day types
The script draws three configurable ORB boxes in your chosen timezone:
• Euro ORB (default 03:00–04:00)
o Defines early “indication” bias:
Above Euro high = BULL
Below Euro low = BEAR
Inside = NEUT
o On confirmed trend days, Euro high/low can be plotted as magnet levels (targets).
• US Futures ORB (8:30 ORB) (default 08:30–09:00)
o Main intraday “engine” box.
o The script tracks:
Breaks above/below the ORB
Rejections around the ORB midline
Sweeps – wicks that push past ORB high/low by a configurable % of the range, then close back inside.
• Cash ORB (default 09:30–10:00)
o Used as a volatility check: if the Cash ORB range is much wider than the 8:30 ORB, the day is flagged as “HIGH” volatility, and the confluence score is penalized.
Using the 8:30 ORB behavior, the script classifies the day type:
• TREND – multiple clean breaks and holding above/below the 8:30 ORB.
• RANGE – repeated rejections at the 8:30 midline with no clean break.
• TRAP – ORB sweeps (fake outs) that reverse back inside the range.
• TREND? / WAIT – early or uncertain structure.
Day type is shown both as a label on the chart and in the info table, and can optionally adjust the confluence score (e.g., penalty on TRAP/RANGE days, bonus on TREND days).
________________________________________
3. Confluence scoring (what feeds the A+/A/B/C grades)
For both long (BULL) and short (BEAR) directions, the indicator builds a score from several components:
• VWAP filter – price above/below VWAP.
• RSI filter – RSI within user-defined bullish/bearish bands.
• FVG detection – recent 3-bar Fair Value Gaps (weighted +2).
• SMT divergence – comparison vs. a second symbol (default ES1!):
o Bearish SMT = your chart makes a higher high while SMT ticker doesn’t confirm.
o Bullish SMT = your chart makes a lower low while SMT ticker doesn’t confirm.
• Swing / PDH-PDL proximity – recent swing highs/lows and prior-day high/low.
• EMA stack – 9/21/50 EMA alignment in trend direction.
• RTH session – optional extra point when inside regular trading hours.
On top of this base score, two modifiers can be applied:
• Day type modifier – e.g., +1 on TREND days, −1 on RANGE, −2 on TRAP (optional).
• Cash ORB volatility modifier – penalty when Cash ORB is abnormally wide.
The final result is:
• 0+ score per side (bull/bear)
• Letter grade:
o 5+ = A+
o 4 = A
o 3 = B
o <3 = C
Each label includes both the grade and the factors that contributed (e.g. A BULL (4pts) VWAP✓ RSI✓ FVG+2 ), so you can see why a signal printed.
________________________________________
4. Signals, sweeps & targets
Continuation signals (main entries)
• Bull continuation:
o Price crosses above the US Futures ORB high.
o Bull confluence score ≥ your Minimum Score to Show Signal.
o Not blocked by TRAP logic if ORB priority is enabled.
• Bear continuation:
o Price crosses below the US Futures ORB low.
o Bear confluence score meets the same threshold.
On these bars, the script plots BULL/BEAR labels with grade and factor list, colored by score. Optional alerts fire with the same information and day type included.
Sweep reversal signals (trap fades)
Separately from continuation, the script can highlight sweep reversals:
• Bull sweep signal:
o The 8:30 ORB low is swept (wick extends beyond low by X% of the ORB range and closes back inside).
o Euro indication is neutral or bullish.
• Bear sweep signal:
o The 8:30 ORB high is swept and price closes back inside, with a neutral or bearish indication.
These plot SWEEP↑ / SWEEP↓ labels and can trigger alerts, giving you a structured way to see trap-style reversals rather than random wicks.
Targets & correction zone
• Correction Zone:
o A shaded box extending right from the 8:30 ORB that marks the “correction” area between ORB midline and range boundary (different placement for long vs short bias).
o This is your primary pullback zone within the ICC framework.
• Expansion targets:
o Optional T1/T2/T3 lines at ±1.0, ±1.5 and ±2.0 times the 8:30 ORB range from the ORB high/low.
o These serve as simple volatility-based reference targets for partials or exhaustion zones.
________________________________________
5. Info table & optional overlays
A compact table in the top-right corner summarizes the environment at the latest bar:
• VWAP (above/below)
• RSI value (color-coded)
• FVG / SMT state (Bull/Bear/none)
• EMA stack (Bull/Bear/flat)
• Day type (TREND/TRAP/RANGE/etc.)
• Cash volatility (HIGH/OK)
• RTH (Yes/No)
• Last sweep (High/Low/none)
• Current bull/bear grades
Optional visual layers can be toggled on/off:
• FVG boxes
• SMT labels
• EMA lines
• VWAP line
• Prior Day High/Low lines
• Euro magnet levels
• ORB history, midlines, correction zone and targets
This allows you to keep the chart clean or fully instrumented depending on your preference.
________________________________________
6. How to use (practical workflow)
1. Load on an intraday timeframe (e.g., 1–5 minutes) and set the ORB times to match your broker/session if needed.
2. Watch the Trident ORBs form:
o Note the Euro “Indication” (BULL/BEAR/NEUT).
o Once the 8:30 ORB completes, monitor day type classification and Cash ORB volatility.
3. During the session:
o On trend days, focus on A+/A BULL/BEAR continuation labels that break the 8:30 ORB in the direction of Euro indication, ideally from inside the Correction Zone.
o On trap/range days, pay more attention to SWEEP↑ / SWEEP↓ signals and be conservative with continuation.
4. Use expansion targets as objective reference areas for partials and risk-to-reward planning.
5. Adapt filters & thresholds:
o Tighten Minimum Score to Show Signal for fewer, higher-quality signals.
o Turn specific filters on/off (FVG, SMT, EMA, VWAP, etc.) to match your own testing and market.
This script does not place trades or manage risk. It is a discretionary decision-support tool and should be combined with your own risk management and testing. Nothing here is financial advice.

Reversal SMC Suite Pro by TradeswithBThe Reversal SMC Suite is an intraday Smart Money Concepts toolkit designed to help traders visually analyze structure, imbalances, and displacement during trending or volatile sessions. This script combines multiple SMC elements—reversals, order blocks, FVGs, HTF bias, and pivot-based support/resistance—into one organized framework to support decision-making.
This indicator does not generate buy or sell signals and does not guarantee results. It is strictly a charting and visualization tool intended to help traders study market behavior.
🔍 Key Features
1. Reversal Detection
Swing Failure Pattern (SFP)
Bullish/Bearish Engulfing
Momentum candle detection (ATR-based)
Optional unified “reversal” signal
Visual arrows and reversal blocks
These are designed to highlight potential turning points based on price behavior—not to predict or guarantee outcomes.
2. HTF Trend Filter
Optional higher timeframe EMA/SMA filter
Customizable HTF resolution
Bias modes: Long only / Short only / Both
This helps you align lower-timeframe reversals with broader market context.
3. Dynamic Order Blocks
Automated OB detection (Body, Wick, or Hybrid)
Smart mitigation logic (body-based or wick-based)
Configurable lookback and OB count
Optional ATR body-size filter for OB quality
Real-time mitigation removal
These tools help visualize areas of interest where price previously showed displacement.
4. Fair Value Gaps (FVG)
Automatic gap detection
Optional FVG extension until filled
Per-side max FVG limit
Useful for identifying imbalance zones and measuring how price revisits inefficiencies.
5. Support / Resistance
Pivot-based S/R with left/right bar settings
Auto-drawing with customizable line counts
Optional S/R visibility toggle
🎛 Presets Included
Several visual configurations are included for convenience:
Custom / Manual (default)
Intraday ORB 5–15m (optimized for fast futures charts)
Clean SMC (Trend + OB)
FVG + OB Combo
Presets adjust inputs automatically to give new users cleaner starting points.
🧠 How To Use
This script is meant to be paired with any strategy or workflow that benefits from:
visual structure analysis,
HTF/LTF alignment,
OB + FVG context, or
intraday trend identification.
It does not replace risk management, strategy rules, or trade planning.
⚠️ Important Notes / Disclaimer
This indicator does not generate trading signals.
No part of this script guarantees profitable outcomes.
It is for educational and informational purposes only.
Always perform your own analysis and use proper risk management.
Past market behavior does not guarantee future results.

ICT Turtle SoupICT Turtle Soup identifies classic “failed breakout” reversals after liquidity sweeps of recent highs/lows, then augments the setup with volume validation, market structure context, Kill Zone (session) filters, Order Blocks (OB), Fair Value Gaps (FVG), OTE (61.8–78.6%) zones, and optional risk targets (SL/TP 1:1, 1:2, 1:3). A compact dashboard summarizes current context (recent high/low, lookbacks, active session, structure state, mitigation counts).
What the Script Does
⦁ Detects Turtle Soup events: Price breaks a prior swing extreme and then quickly reverses back inside the range.
⦁ Grades signal quality: Factors include reversal speed, volume confirmation, breakout magnitude, and consecutive patterns.
⦁ Overlays market context: Trend/range classification (ADX / MA / ATR Bands / Combined), Kill Zones (Asian/London/NY), and time-of-day filters.
⦁ Marks IMB / mitigation zones: Draws Order Blocks and Fair Value Gaps, with optional live mitigation tracking and fading/removal on mitigation.
⦁ Shows OTE zones (61.8–78.6%) after confirmed reversals to highlight potential pullback entries.
⦁ Plots risk management guides: Optional SL buffer below/above reversal wick and TP bands at 1:1, 1:2, 1:3 R multiples.
⦁ Emits alerts on bullish/bearish Turtle Soup confirmations.
How It Works (Conceptual)
1. Liquidity Sweep & Breakout Check
⦁ Looks back over user-defined windows (single or multiple lookbacks: short/medium/long) to find the most recent swing high/low.
⦁ Flags a breakout when price pierces that swing (above for bearish, below for bullish).
⦁ Optional breakout bar volume check requires volume > avg(volume, N) × multiplier.
⦁ Optional swing age check requires the broken swing to be at least X bars old.
2. Reversal Confirmation
⦁ Within N bars after the sweep, validates a mean-reversion close back inside the prior range with a minimum wick/body ratio to confirm rejection.
⦁ Quality Score adds points for:
⦁ Speed: reversal within fast_reversal_bars;
⦁ Volume: breakout and/or reversal volume spike;
⦁ Series: previous consecutive signals;
⦁ Magnitude: sufficient sweep distance.
⦁ Optional high-quality filter only shows signals meeting a minimum score.
3. Context Filters (Optional)
⦁ Sessions/Kill Zones: Only allow signals in selected sessions (Asian/London/NY) with fully custom HHMM inputs.
⦁ Time Window: Restrict to specific hours (e.g., 08–12).
⦁ Market Structure: Classify Trending vs. Ranging (via ADX, MA separation/slope, ATR bands, or Combined). You can allow signals in trends, ranges, or both.
4. Smart Confluence Layers
⦁ Order Blocks: Finds likely OBs with structural validation (e.g., bearish up-candle prior to down move), imbalance score (body/range × volume factor), and extend-until-touched with mitigation % tracking.
⦁ Fair Value Gaps: Detects valid 3-bar gaps (bull/bear) with size threshold, supports touch / 50% / full mitigation logic, and can fade or remove after mitigation.
⦁ OTE Zones: After a reversal, projects the 61.8–78.6% retracement box from the actual swing range; offset scales to timeframe to avoid clutter.
5. Risk & Display
⦁ SL/TP guides: Optional wick-buffered SL and 1:1/1:2/1:3 TPs.
⦁ Dashboard: Recent high/low, active lookbacks, current session, structure label, and live counts of mitigated OBs/FVGs.
Signals & Visuals
⦁ Bullish Turtle Soup: Triangle up + label (🐢S/M/L/D + star rating).
⦁ Bearish Turtle Soup: Triangle down + label (🐢S/M/L/D + star rating).
⦁ Labels can show: quality stars, FAST/SLOW reversal, reversal & breakout volume tags, previous consecutive count, and last move %.
⦁ Lines/Boxes: OBs, FVGs, OTE zones, SL/TP bands, and optional breakout magnitude line.
Inputs (Key Groups)
⦁ Turtle Soup: Lookbacks (single or S/M/L), reversal bars, wick ratio, magnitude line, reversal speed, volume confirmation (multiplier/length), consecutive tracking.
⦁ Order Blocks: Show/validate structure, lookback, extend-until-touched, mitigation % threshold, colors.
⦁ Fair Value Gaps: Show, min size %, colors, mitigation mode (Touch/50%/Full), optional remove-on-mitigation.
⦁ Kill Zones/Sessions: Enable Asian/London/NY with custom HHMM, colors.
⦁ OTE: Show OTE (61.8–78.6%), color, timeframe-adaptive offsets.
⦁ Signal Filters: Filter by session, time window, market structure method (ADX/MA/ATR/Combined), thresholds (ADX, MA periods, ATR multiplier), trending/ranging allowances, structure label & offset.
⦁ SL/TP: SL buffer %, TP 1:1/1:2/1:3 toggles & colors.
⦁ Breakout Validation: Require breakout-bar volume, min swing age, volume label toggles.
⦁ Alerts: Enable/disable.
⦁ Dashboard: Position, text size, colors, border.
How to Use
1. Markets & Timeframes: Works on FX, crypto, indices, and futures. Start with M5–H1 for intraday and H1–H4 for swing; refine lookbacks per instrument volatility.
2. Core Flow:
⦁ Enable multiple lookbacks for robustness on mixed volatility.
⦁ Turn on validate_swing_significance to avoid micro sweeps.
⦁ Use validate_breakout_volume + use_volume_confirmation to filter weak pokes.
3. Context Choice:
⦁ In ranging environments, allow both sides; in trends, consider counter-trend only at HTF OB/FVG/OTE confluence.
⦁ Narrow to London/NY for higher activity if desired.
4. Entries/Stops/Targets:
⦁ Entry on confirmed label close or at OTE pullback post-signal.
⦁ SL: below/above reversal wick + sl_buffer%.
⦁ TP: scale at 1:1/1:2/1:3 or manage via OB/FVG/structure breaks.
5. Confluence: Prefer Turtle Soup that aligns with OB/FVG zones and Combined structure method for added reliability.
Alerts
⦁ “Bullish Turtle Soup detected” and “Bearish Turtle Soup detected” fire on confirmation.
⦁ Set to Once Per Bar (as coded) or adjust in the alert dialog per your workflow.
Notes & Tips
⦁ Multiple lookbacks (S/M/L) help capture both shallow and deep liquidity sweeps.
⦁ Use market structure label with offset to keep it readable on the right of price.
⦁ Mitigation tracking visually communicates when OB/FVG confluence is no longer valid.
⦁ Dashboard = fast situational awareness; keep it on during live trading.
Limitations & Disclaimer
⦁ This tool is educational and not financial advice. No profitability or win-rate is implied. Markets carry risk; manage position size and test thoroughly.
⦁ Signal quality depends on market regime, spreads, news, and data quality. Backtests/forward-tests may differ.
⦁ Visual objects are capped for performance; old items may auto-clean to keep charts responsive.

OneHolo-TGAPSNRTGAPSNR: Multi time frame - Trend Gap Stop And Reverse strategy/Study PnL. This script outlines a systematic approach to generating buy and sell signals by combining Fair Value Gaps (FVGs), specific market structures, and three different trend direction methods (Swing, Gravity, and FVG Inverse direction). The strategy incorporates multiple entry modes, such as Hyper Mode, Swiper Mode, and a Custom mode, allowing users to tailor signal conditions, alongside extensive logic for trade management, higher time frame analysis, and various visual indicators for plotting trend, pivots, and profit and loss information.
I. Core Trend Direction Consensus (The Three-Pillar System)
The primary method for determining market bias is a three-pillar consensus model, requiring all directional methods to align before the overall Trend Direction is established (up or down). This ensures high conviction for trend signals.
• Pillar 1: Swing Direction: Determines market direction based on classic price action, specifically checking for continuous higher highs and higher lows for an upward bias, or lower lows and lower highs for a downward bias.
• Pillar 2: Gravity Direction (Peak and Valley): This uses specific market structure pivots. Direction is set based on whether the close price successfully crosses the established recent Peak High (indicating upward momentum) or crosses under the recent Valley Low (indicating downward pressure).
• Pillar 3: FVG Inverse Direction: This relies on Fair Value Gaps (FVGs), defined as a gap between the current bar's price and the price two bars prior. Direction shifts occur when the Close price crosses the midpoint of the last relevant FVG. For instance, crossing above the midpoint of the last FVG Down signals a potential inverse long trade.
II. Flexible Signal Generation Modes
The strategy offers several pre-configured and highly detailed entry modes, plus a powerful Custom Mode:
• Session Open Range Break (ORB) Mode: Uses the high/low of the session's first bar to generate initial signals, then defaults to the Three-Pillar Trend Direction after the ORB session concludes.
• Swiper Mode: Designed to identify continuations, combining a confirmed Trend Direction with a Stop and Reverse signal (SnR) while actively avoiding confirmed pivot breaks.
• Hyper/Aggressive Modes: These modes use broad combinations of signals, allowing for earlier entry based on momentum and structural breaks (like PeakCrossLong, SnRtrapLong, or FVG signals).
• Custom Query Mode (The Seven-Slot Logic): This non-redundant system allows the user to define complex, tailored entry conditions by selecting any combination of 14 core patterns across seven distinct slots.
◦ AND/OR Combination: For each of the seven slots, the user determines if the chosen pattern must be met (AND component) or if it can serve as an alternative trigger (OR component).
◦ The final signal requires that all configured AND conditions are true and then integrates the result of the OR conditions, allowing for highly specific "hook queries" (e.g., "Condition A AND Condition B, OR Condition C").
III. Advanced PnL and Mobile App Diagnostics
A key proprietary element is the implementation of a dual PnL system and customized visualization features:
• Dual PnL Display (Strategy PnL vs. Study PnL): Users can choose to view either the native platform's strategy performance data or the script's internal, proprietary Study PnL. The Study PnL calculates profits/losses based strictly on the close price and tracks performance using Pine Script® arrays, providing a transparent, diagnostic view of performance independent of broker/platform simulation biases.
• Lower Panel Visualization: Both PnL types are displayed on the lower panel using detailed bar plots (style=plot.style_columns), which color according to profitability, and include labels that show current open profit and total net profit.
• Detailed Trade Labels: The script generates detailed, customizable labels on both the chart (above/below bars) and the lower PnL panel, providing historical PnL, number of trades, and real-time profit information for each entry or exit.
IV. Higher Time Frame (HTF) Context and Lookahead Prevention
The strategy integrates multi-time frame analysis using strict methodology to prevent lookahead bias:
• HTF Bias Filtering: When enabled, the strategy uses the position calculated on a user-defined higher time frame (HTF) as a mandatory filter. A long signal on the current chart is only executed if the HTF is also in a long position, and vice-versa.
• Lookahead Prevention: To maintain integrity, all HTF data requests use a mandatory lookback index (often ) to ensure the script only accesses confirmed data from the prior completed bar on the higher timeframe.
• HTF Visual Mode: The user can opt to display key structural elements—such as the Gravity Pivots and the Trend Direction blocks—as calculated on the HTF, overlaying this higher-level context onto the current chart for visual analysis.
The TGAPSNR: Multi time frame - Trend Gap Stop And Reverse strategy/Study PnL script, despite its complexity, intentionally excludes realistic considerations such as fees, slippage, and explicit risk management settings (like fixed stop-loss or take-profit rules) from its primary logic.
Here is an explanation of why these elements are omitted in the strategy's current implementation and why they must be applied by the user for real-world application, drawing on the context of the sources:
1. Absence of Realistic Fees, Commissions, and Slippage
The primary function of the TGAPSNR script is to execute intricate signal generation and diagnostic PnL calculation based on its three-pillar trend system and Custom Mode logic.
However, the strategy's backtesting results, particularly those displayed by the internal Study PnL feature, are based purely on price difference (e.g., (close - lse) * syminfo.pointvalue * IUnits).
• Strategy Result Requirements: TradingView explicitly states that strategies published publicly should strive to use realistic commission AND slippage when calculating backtesting results to avoid misleading traders.
• User Responsibility: Since the script currently focuses on signal integrity and uses a fixed contract size (IUnits = 1) without configurable commission/slippage inputs shown in the source, the user must manually configure these fees within the Pine Script® Strategy Tester settings (Properties tab) to ensure the strategy results are reflective of actual trading costs.
2. Omission of Built-in Risk Management (Stop-Loss and Take-Profit)
The TGAPSNR strategy's core focuses on entry signals and trend confirmation. Exits are primarily governed by:
• Reversal signals (BuyStop or SellStop).
• End-of-Day (EOD) session closures (EODStop).
• HTF bias opposition.
What is Missing: The script does not include explicit, hard-coded risk management parameters for traditional stop-loss (SL) or take-profit (TP) levels (e.g., risk percentage or ATR-based exits).
• Viable Risk: TradingView guidelines stipulate that strategies should generally risk sustainable amounts of equity, usually not exceeding 5-10% on a single trade, and trade size must be appropriate.
• User Application: To ensure the strategy operates within realistic risk boundaries, users must apply their own risk management rules. This includes:
◦ Implementing realistic stops and profit targets, which can be added via Pine Script® code or manually managed during live trading.
◦ Sizing trades to only risk sustainable amounts of equity. The current default unit size (IUnits = 1) is unrealistic for risk assessment unless the symbol is micro-sized.
3. Execution Quality (Fills)
The strategy is set to fill_orders_on_standard_ohlc = true and operates on confirmed bar closes (barstate.isconfirmed).
• Fill Assumption: This suggests the strategy primarily uses close price or the HTF close price (EntryPrice = HTFClose) for execution.
• Real-World Limitation: In volatile markets, obtaining a fill price equal to the close of the bar is rare. The user must be aware that the simulated fill price shown in backtesting may differ significantly from actual execution prices due to market action and chosen order type, reinforcing the importance of applying slippage settings.
In summary, while the script provides highly detailed and unique signal generation and internal PnL diagnostics, users must exercise caution and apply their own realistic parameters for fees, slippage, and explicit risk controls to prevent misleading performance results and ensure viable trading