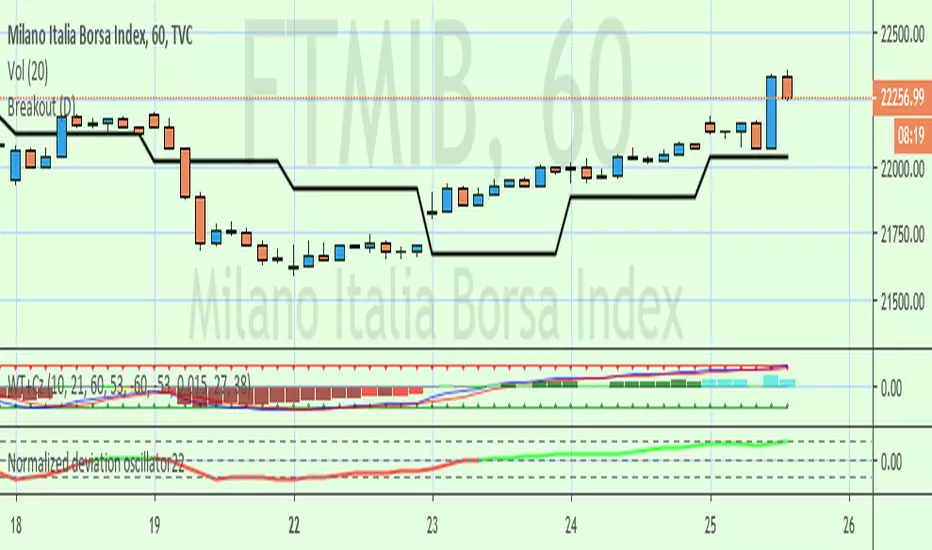
Breakout Pivotal Bars • Minimalist TradingThe Breakout Pivotal Bars is an easy to use trading indicator which identifies major breakouts of key hidden levels which are usually hard to spot even to the most experienced trader.
By reading the price action the Breakout Pivotal Bars is able to identify high probability trade opportunities by colouring bars in real-time.
Whether the market moves up or down, with the Breakout Pivotal Bars you will always be in the trend .
The indicator is available via subscription and you can enjoy a free trial . To know more about the indicator and start the trial simply visit the link below.
➡ Try the indicator
ค้นหาในสคริปต์สำหรับ "breakout"

[TTI] Minervini's Stock Under Pressure––––History & Credit––––
📚 Credit: This script is inspired by Mark Minervini's book, "Trade Like a Stock Market Wizard". The book is a must-read for any stock trader or investor, and it's where the idea for this indicator came from.
–––––What it does––––
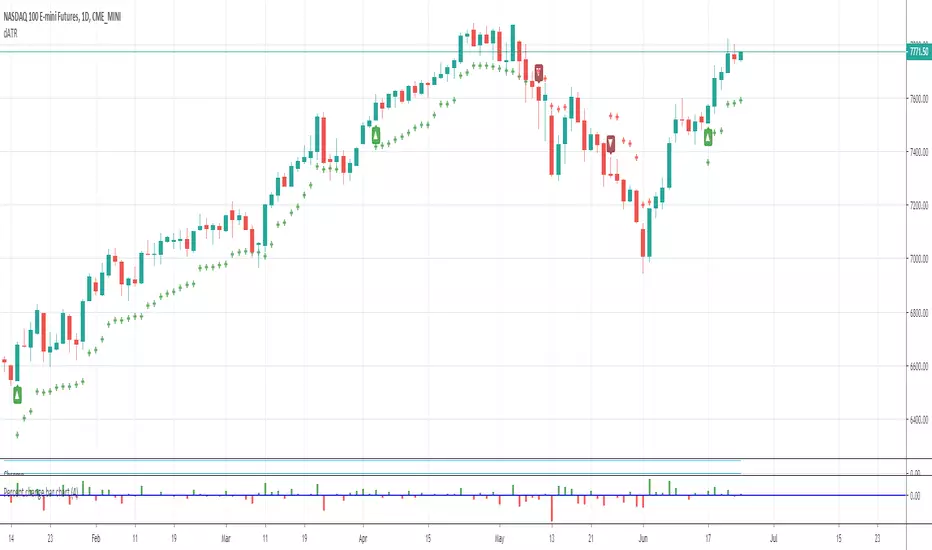
💡 What it does: The Minervini's Stock Under Pressure Indicator is a powerful tool for stock traders and investors. It helps to identify when a stock is under pressure and less likely to breakout and continue its upward movement.
📈 How it works: The indicator uses price action and various moving averages to calculate when a stock is under pressure. It provides a clear signal in the when a stock is struggling to move higher by printing puple color on the pane, so you can adjust your trading strategy accordingly.
–––––How to use it––––
👨💼 How to use it: You can use the Minervini's Stock Under Pressure Indicator as an additional criteria while deciding whether a stock is likely to breakout. If the indicator is showing that the stock is under pressure, then you may want to wait for a better entry point or avoid the stock altogether. Remember trading is probabilities game.
📊 Calculations: The indicator is based on a complex calculation, but you don't need to worry about the details. All you need to do is to look for the signal and act accordingly.
💻 Installation: To use the indicator, simply install it on your TradingView chart and adjust the settings as necessary. You can customize the indicator to fit your trading style and preferences.
🚀 Get ready to trade like a stock market wizard with the Minervini's Stock Under Pressure Indicator!

Breakout Accumulation/DistributionBasic modification of my SFP Momentum Indicator showing accumulation/distribution patterns based on breakouts above previous anchor points.
Candles are colored based on whether accumulation or distribution was last.
Best if used at HTF then confirmed at LTF.
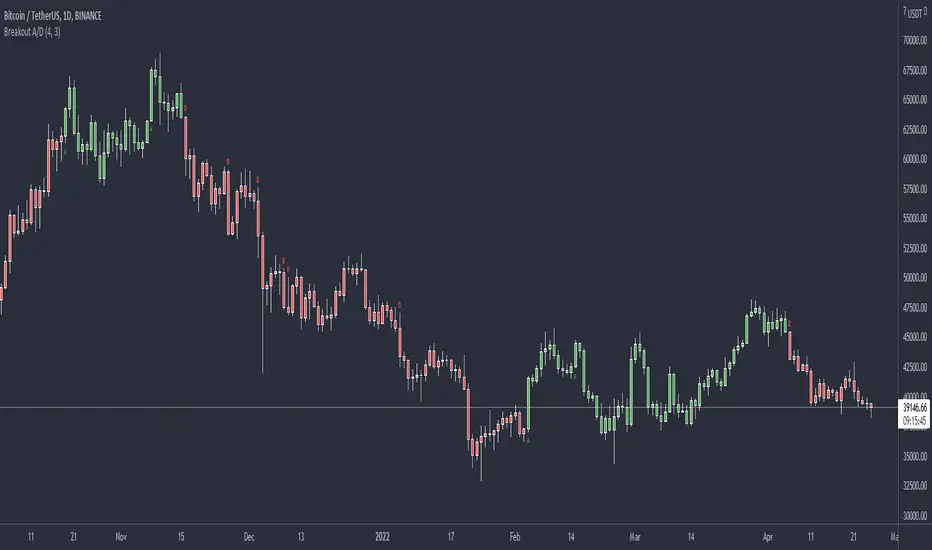
BREAKOUT DETECTORThis is the first version of the Breakout Detector script I am working on. Purple ticks indicate a potential breakout. As you can see on this section of the Bitcoin chart, it pinpointed the exact breakout on many instances, even the notorious Bart Simpson pattern was caught, literally one candle before the break-up of the pattern. This indicator does NOT repaint, its just very solid mathematics. Ongoing project. Not open publishing yet, but will allow testers on an ad hoc basis.

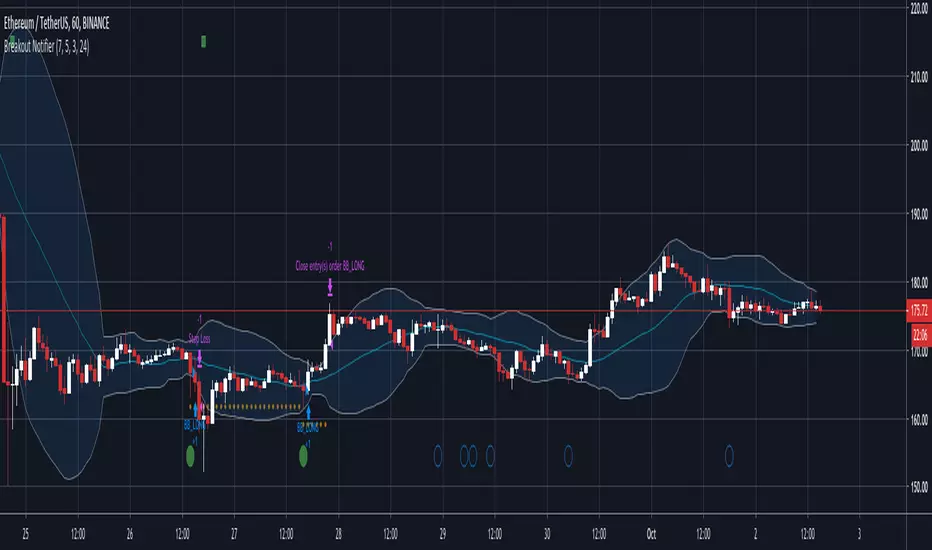
Breakout Range Signal with Quality Analysis [Dova Lazarus]📌 Breakout Range Signal with Quality Analysis
🎓 Training-focused indicator for breakout logic, SL & TP behavior and signal quality assessment
🔷 PURPOSE
This tool identifies breakout candles from a calculated channel range and visually simulates entries, stop losses, and take profits, providing live and historical performance metrics.
⚙️ MAIN SETTINGS
1️⃣ Channel Setup
channel_length = 10 → how many candles are averaged to form channel boundaries
channel_multiplier = 0.0 → adds expansion above/below the base channel
channel_smoothing_type = SMA → smoothing method for high/low averaging
📊 The channel consists of two moving averages: one from highs, the other from lows. When expanded (via multiplier), it creates a buffer range for breakout validation.
2️⃣ Signal Detection
Body > Channel % = 50 → a breakout candle's body must exceed 150% of the channel width
Signal Mode:
• Weak → every valid breakout candle is highlighted
• Strong → only the first signal in a sequence is shown (helps reduce noise)
🟦 Bullish signals (blue):
• Candle opens inside the channel
• Closes above the channel
• Body is large enough
• Optional: confirms with trend (if enabled)
🟨 Bearish signals (yellow):
• Candle opens inside the channel
• Closes below the channel
• Body is large enough
• Optional: confirms with trend
3️⃣ Trend Filter (optional)
Enabled via checkbox
Uses a higher timeframe MA to filter signals
Bullish signals are allowed only if price is below the trend MA
Bearish signals only if price is above it
⏱️ trend_timeframe = 1D (typically set higher than the chart's timeframe)
🟢 Trend line is plotted if enabled
🎯 ENTRY, STOP LOSS & TAKE PROFIT LOGIC
SL and TP are based on channel width, not fixed pip/tick size:
📍 Entry Price = close of the breakout candle
🛑 Stop Loss:
• Bullish → below the lower channel border (minus offset)
• Bearish → above the upper channel border (plus offset)
🎯 Take Profit:
• Bullish → entry + channel width × profit multiplier
• Bearish → entry − channel width × profit multiplier
You can control:
Profit Target Multiplier (e.g., 1.0 → TP = 1×channel width)
Stop Loss Target Multiplier (e.g., 0.5 → SL = 0.5×channel width)
Signals to Show = how many historical SL/TP setups to display
📈 Lines and labels ("TP", "SL") are drawn on the chart for clarity.
🧪 QUALITY ANALYSIS MODULE
If enabled, the indicator will:
Track each new signal (entry, SL, TP)
Analyze outcomes:
• Win = TP hit before SL
• Loss = SL hit before TP
• Expired = signal unresolved after N bars
Display statistics in a table (top-right corner):
📋 Table fields:
✅ Overall win rate
📈 Bullish win rate
📉 Bearish win rate
🔢 Total signals
🕓 Pending (still active trades)
Maximum bars to wait for outcome is customizable (max_bars_to_analyze).
📐 VISUALIZATION TOOLS
TP / SL lines per signal
Labels “TP” and “SL”
Optional channel lines and trendline for better context
Colored bars for valid signals (blue/yellow)
📌 BEST USE CASES
Understand how breakout signals are formed
Learn SL/TP logic based on dynamic range
Test how volatility affects trade outcomes
Use as a visual simulation of trade behavior over time

Breakout Strategy with Dynamic SL LabelDescription:
This script identifies breakout trading opportunities using adaptive support and resistance levels, adjusted dynamically based on market volatility. A trade signal is generated only when a breakout candle is followed by a confirming close in the same direction. The signal is displayed on the chart as a labeled marker that includes a suggested stop-loss level based on the highest high or lowest low of the past 10 bars, ensuring structure-aware risk management.
🧩 How it Works:
Adaptive S/R Zones: Based on volatility-normalized swing highs/lows using ATR. These zones automatically adjust to changing market conditions.
Confirmation Logic: Trade signals only appear after the second candle confirms the breakout, helping reduce false signals.
Single Signal Rule: Only one buy or sell label is printed per breakout level, avoiding repeated triggers.
Embedded Stop Loss in Label: SL value is calculated from the 10-bar high (for shorts) or low (for longs) and included in the signal label.
⚙️ User Inputs Explained:
Base Swing Strength: Controls the pivot sensitivity; higher values detect stronger reversal points.
Line Duration: Number of bars that horizontal S/R levels remain visible.
ATR Period: Length used to calculate volatility for adaptive S/R logic.
Volatility Sensitivity: Adjusts how responsive the S/R zone strength is to volatility. Higher = more responsive.
Stop-Loss Lookback (Bars): Defines the number of candles to reference when calculating SL from high/low structure.
Max Lines Stored: Controls chart clutter by limiting how many S/R zones are kept active.
🟩 Ideal for:
Breakout traders who value clean structure, confirmation, and built-in risk logic.
Scalpers and swing traders looking for adaptive, low-latency signals without repainting.
Chartists who want minimal indicators but maximum signal clarity.

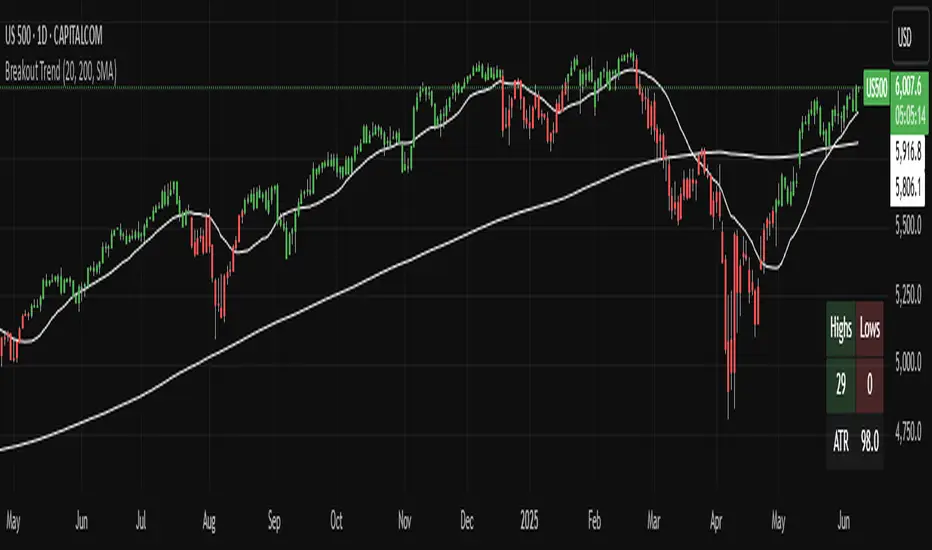
Breakout TrendTiltFolio Breakout Trend indicator
The Breakout Trend indicator is designed to help traders clearly visualize trend direction by combining two complementary techniques: moving averages and Donchian-style breakout logic.
Rather than relying on just one type of signal, this indicator merges short-term and long-term moving averages with breakout levels based on recent highs and lows. The moving averages define the broader trend regime, while the breakout logic pinpoints moments when price confirms directional momentum. This layered approach filters out many false signals while still capturing high-conviction moves.
Yes, these are lagging indicators by design — and that’s the point. Instead of predicting every wiggle, the Breakout Trend waits for confirmation, offering higher signal quality and fewer whipsaws. When the price breaks above a recent high and sits above the long-term moving average, the trend is more likely to persist. That’s when this indicator shines.
While it performs best on higher timeframes (daily/weekly), it's also adaptable to shorter timeframes for intraday traders who value clean, systematic trend signals.
For early signal detection, we recommend pairing this with TiltFolio’s Buying/Selling Proxy, which anticipates pressure buildups—albeit with more noise.
It's easy to read and built for real-world trading discipline.
Breakout indicatorThis indicator helps traders identify potential breakout levels based on the highest high and lowest low of the last N candles, inspired by the classic Turtle Trading strategy. The period (N) is fully customizable, allowing you to adapt it to your trading style. For daily charts, a period between 50 and 100 is recommended.
The indicator dynamically plots horizontal lines representing the highest high and lowest low over the selected period. These lines are updated in real-time as price action evolves. A breakout is confirmed when the price closes above the high line (for a bullish breakout) or below the low line (for a bearish breakout).
Customize the appearance of the lines with options for thickness, color, and style (solid, dotted, or dashed) to suit your chart preferences. Perfect for traders looking to implement a simple yet effective breakout strategy!
Key Features:
Editable period (N) for high/low calculation.
Real-time updates of high/low levels.
Customizable line thickness, color, and style.
Usage:
Use on daily charts for swing trading or position trading.
Combine with other indicators or price action analysis for better confirmation.

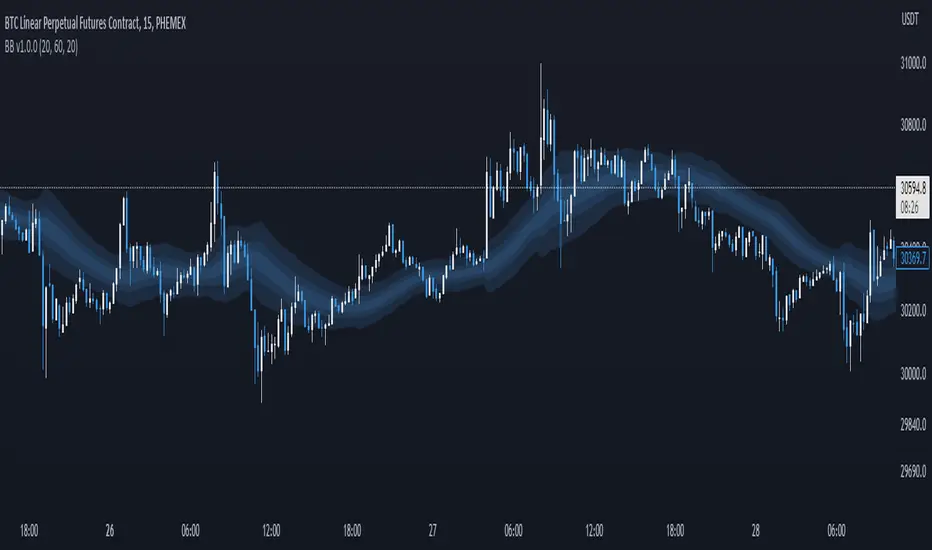
Breakout Band v1.0This indicator uses a custom source to define a point of relativity to which regions are based off to aid in technical analysis.
Breakout Band's use is:
- Monitoring trends
- Defining trends
- Defining areas of consolidation
- Trend support / resistance levels
- Aid in technical analysis
However, the band provides information different to that of an EMA, as they are not created from the same source, ref Fig 1.
---
Fig 1
Breakout Band compared to an EMA, both with a length setting of 20.
---
The primary band uses your charts timeframe to plot the band. This can be useful for more immediate information, ref Fig 2.
Fig 2
BTC on a 15m chart with Breakout Band's Chart Timeframe option.
---
There is also a functionality for a higher timeframe band to be plotted ( currently limited to 4 higher timeframes ) which can help to view higher timeframe moves with lower timeframe information, ref Fig 3. The higher timeframe band has an added smoothing effect.
Fig 3.
The same chart as referenced in Fig 2., while using Breakout Bands HTF option ( 60m band ).
---
USING BREAKOUT BAND
The band provides potential areas of consolidation, as seen in Fig 4., and when price action falls outside of the band, it can be considered trending.
Fig 4.
Defining areas of consolidation, trends, and monitor trends with Breakout Band.
---
Different zones are given different colors. The closer to the middle of the band, the higher chance of reactivity. Meaning, there is a greater chance that price will have a reaction within this zone. Whether that be trend continuation or a break of structure, showing signs of weakness of a trend, ref Fig 5.
Fig 5.
Breakout Bands reactivity region showing an area of potential resistance, which price action enters, then the trend continues.
---
NOTE : The same principles apply if you're using the HTF band for monitoring HTF trends.
I hope you enjoy the Breakout Band. Should you encounter any issues or have any suggestions for improving this indicator, let me know.
Any and all feedback is appreciated.
Breakout Trend Trading Strategy - V2This is an alternate version of Breakout Trend Trading Strategy - V1
Only difference is, this strategy places stop orders based on calculated targets whereas V1 waits for price to close target levels and then places market orders. Hence, you will receive the target prices before trade executes in strategy.
Parameters are same as that of Breakout Trend Trading Strategy - V1
There is one additional parameter on Trade Type - which permits user to allow only breakout, pullback or reverse trading or combination of all.
Backtesting parameters remain same :
Capital and position sizing : Capital and position sizing parameters are set to test investing 2000 wholly on certain stock without compounding.
Initial Capital : 2000
Order Size : 100% of equity
Pyramiding : 1
Test cases remain same :
Positive : AAPL , AMZN , TSLA , RUN, VRT , ASX:APT
Negative Test Cases: WPL , WHC , NHC , WOW, COL, NAB (All ASX stocks)
Special test case: WDI
Negative test cases still show losses in back-testing. I have attempted including many conditions to eliminate or reduce the loss. But, further efforts has resulted in reduction in profits in positive cases as well. Still experimenting. Will update whenever I find improvements. Comments and suggestions welcome :)

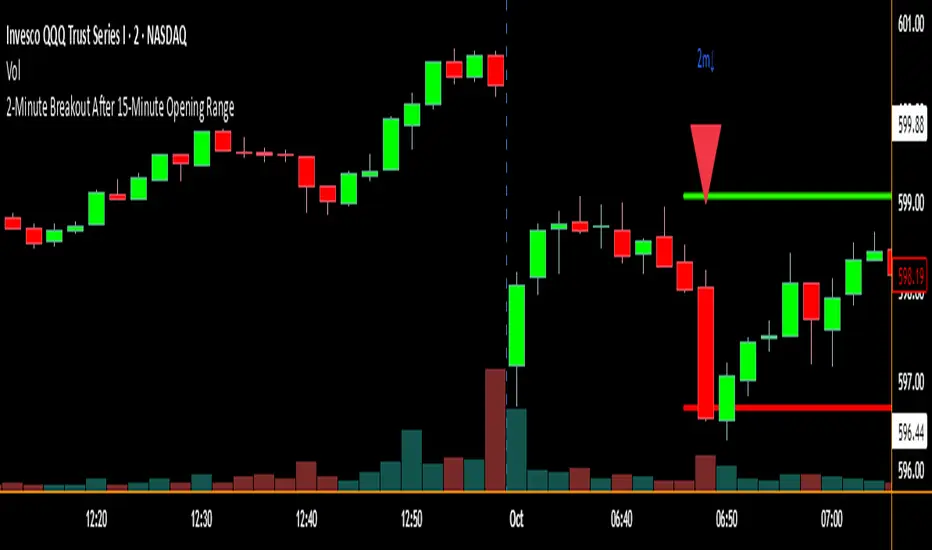
2-Minute Breakout After 15-Minute Opening RangeBreakout must happen before 8 am PST. I used Chat GPT to create this for me so I could do some backtesting on 15 min ORBs.
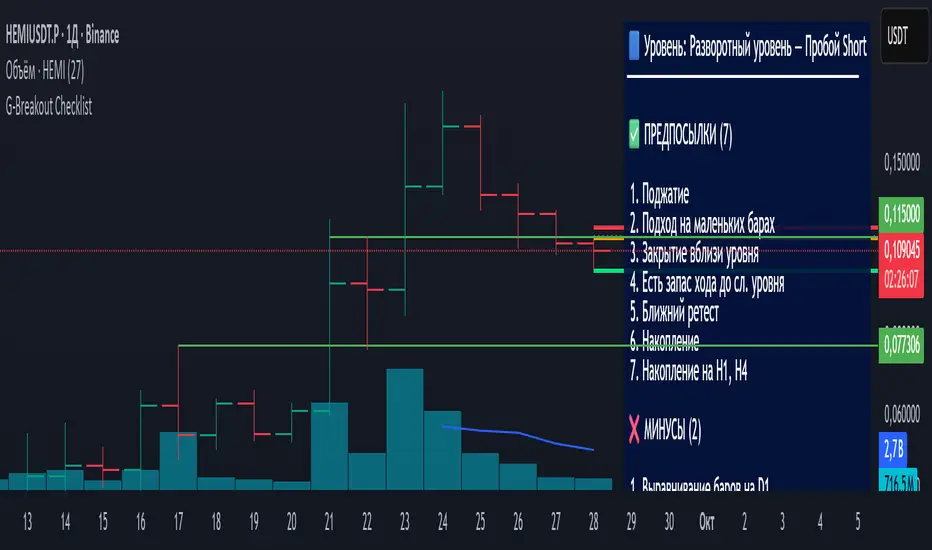
Breakout Levels Checklist# Description (EN)
## Breakout Levels Checklist — ATR (Classic shown, Active = 5-Day Median or Manual), D1-Fixed, Risk Position Sizing
This script is an on-chart checklist for breakout trades with a daily-fixed ATR core and a simple risk calculator. ATR values are latched on **D1**, so SL/TP remain stable when you switch timeframes. The UI (inputs and panel) is in Russian.
### What it does
- **Checklist**: three groups (Prerequisites, Negatives, Waiting). You tick items; the panel shows a clean list with counters.
- **Breakout calculations**: Entry, Stop-Loss, Take-Profit from your level price, **k × ATR** stop, and an RR preset. A built-in entry offset ≈ **12.5%** of the stop distance is applied.
- **ATR engine (D1)**:
- **Classic ATR** (period selectable; HL or True Range) — **always computed and displayed** for reference and daily progress.
- **Active ATR** = either **5-day median ATR** with optional *paranormal bar* filter (filters both too-big and too-small D1 ranges by percentage thresholds vs a blended reference), **or Manual ATR** if enabled.
- **Risk calculator**: given **Deposit** and **Risk %**, the script outputs the **entry notional (USD)** so an SL hit is approximately equal to your dollar risk; the panel also shows potential PnL to take-profit.
- **Stable visuals**: level / entry / SL / TP lines with automatic cleanup on a new day; panel can be placed in any corner (RU labels).
### How to use
1. Set **Direction** (Long/Short) and the **Level Price**.
2. Tick checklist items as the setup forms.
3. In **ATR**, leave Classic as reference (period + HL/TR), and choose the **Active ATR mode**: *5-day median* (with optional paranormal filter) **or** *Manual* (manual value overrides).
4. Pick **k** for **Stop = k × ATR**; TP is placed by the **RR** preset relative to stop size.
5. In **Calculator**, set **Deposit** and **Risk %** — the panel returns the **entry notional** aligned with your risk.
6. Show/hide panel sections (calculations / ATR / calculator) as needed.
### Quick notes
- Classic ATR is not selectable; it is always calculated and shown for context and D1 progress.
- Active ATR drives stop sizing: *5-day median (with filter)* or *Manual*.
- All ATR computations use **closed D1 bars**; values are cached per day.
---
# Описание (RU)
## Чек-лист уровней (Пробой) — ATR (классический показывается, Активный = медианный 5-дневный или Ручной), фиксация D1, расчёт позиции от риска
Скрипт для работы с пробойными сетапами: чек-лист на графике, фиксированный дневной ATR, расчёт ТВХ/SL/TP и простой калькулятор позиции от риска. Значения ATR фиксируются на **D1**, поэтому SL/TP не «плавают» при смене таймфреймов. Интерфейс (входы и панель) — на русском.
### Что делает
- **Чек-лист**: три группы (Предпосылки, Минусы, Ожидаю). Отмечаете галочки — панель выводит список и счётчики.
- **Расчёты пробоя**: ТВХ, Стоп-лосс, Тейк-профит от цены уровня; стоп как **k × ATR**; тейк задаётся пресетом **RR**; встроен люфт входа ≈ **12.5%** от дистанции стопа.
- **ATR (D1)**:
- **Классический ATR** (период, HL или True Range) — **всегда считается и показывается** как справочное значение и для прогресса дня.
- **Активный ATR** = **медианный за 5 дней** с опциональным фильтром *паранормальных* баров (одной галочкой отсекаются одновременно слишком большие и слишком маленькие дневные диапазоны по процентным порогам к смешанному референсу) **или** **Ручной ATR** (ручное значение имеет приоритет).
- **Калькулятор риска**: по **Депозиту** и **Риску %** отдаёт **сумму входа (USD)** так, чтобы убыток по стопу был близок к заданному риску; дополнительно показывает потенциальный PnL по тейку.
- **Стабильная отрисовка**: линии Уровень / ТВХ / SL / TP, авто-очистка на новый день; позиция панели выбирается (русские подписи углов).
### Как работать
1. Задайте **Направление** (Long/Short) и **Цену уровня**.
2. Отметьте пункты чек-листа под текущий контекст.
3. В **ATR** используйте **Классический** как справочный (период + HL/TR), а **Активный ATR** выберите как *медианный 5-дневный* (с фильтром при необходимости) **или** *Ручной* (ручное значение замещает активный).
4. Укажите **k** для **Стоп = k × ATR**; тейк выставляется пресетом **RR** относительно размера стопа.
5. В **Калькуляторе** задайте **Депозит** и **Риск %** — получите **сумму входа**, согласованную с риском.
6. В панели можно скрывать/показывать секции (расчёты / ATR / калькулятор).
### Важные примечания
- Классический ATR не выбирается пользователем — он всегда считается и отображается для контекста и прогресса по дню.
- Активный ATR используется для расчёта стопа: медианный 5D (с фильтром) или ручной.
- Все расчёты ATR делаются по **закрытым барам D1**; значения кэшируются на день.
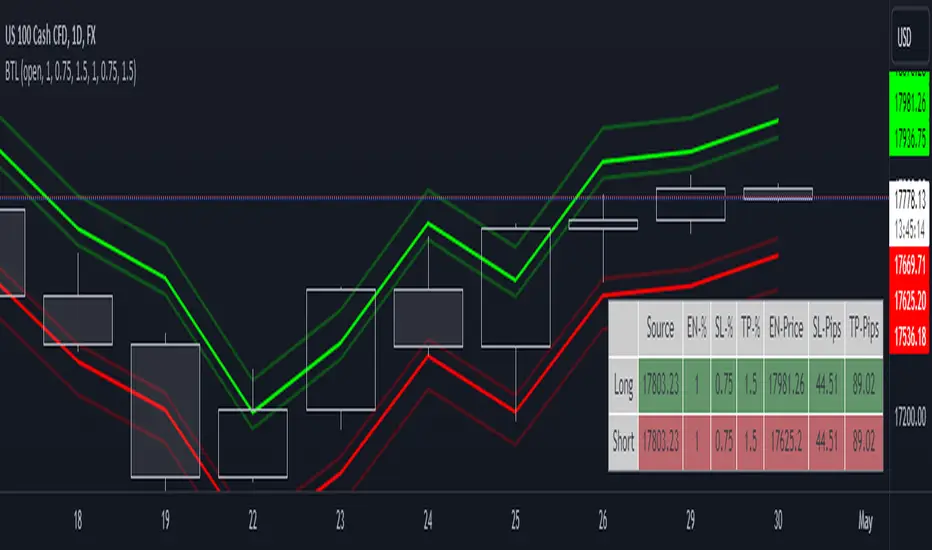
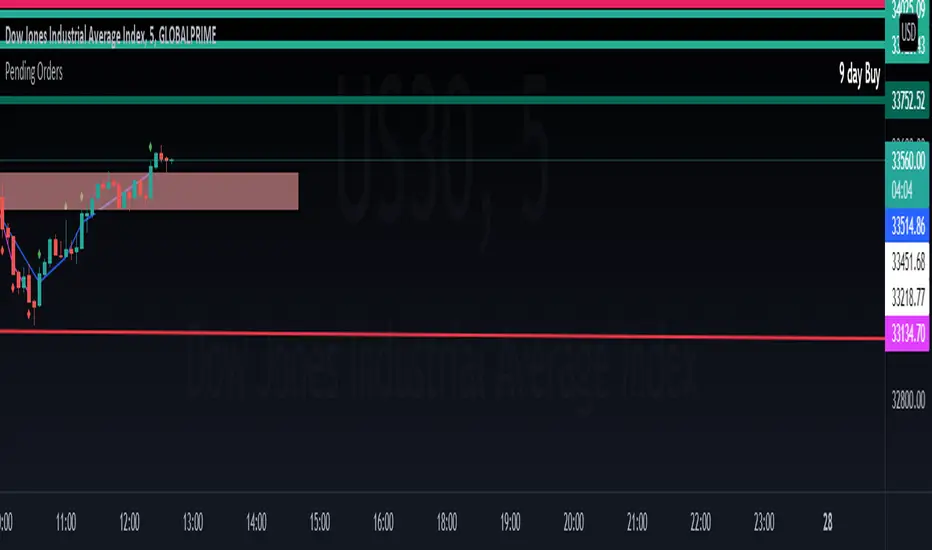
Breakout Trade LevelsThis indicator is designed for trading CFD indices, focusing specifically on breakout strategies.
For instance, utilize this indicator to set up a bracket order at the beginning of the trading day, anticipating a breakout in NAS100 with a movement of 1% in either direction. Utilizing the Open Price, it calculates the Entry Price, Stop Loss (SL), and Take Profit (TP) based on percentage movements.
Breakout Finder Strategy by The Accumulation ZoneThe Breakout Strategy:
Indicators used:
Least Squared Moving Average by Tradingview
Smoothed Moving Average by Tradingview
MACD Support Resistance by venkatachari_n
About this Strategy:
This strategy is based on spotting a particular activity pattern involving the above listed indicators:
A fast moving average that will track closely with price while still smoothing out some price chop
A slower least squared moving average to help gauge short-term momentum
MACD Support and Resistance to help identify longer-term trends and potentially serve to also guide directional bias
If all entry conditions are met, the strategy enters a position. As well as sending an alert message for the Entry, TP/SL Signals
Long Condition:
Price close above MACD S/R Line
SMMA crossed MACD S/R Line to the upside
LSMA crossed MACD S/R Line to the upside
Short Condition:
Price close below MACD S/R Line
SMMA crossed MACD S/R Line to the downside
LSMA crossed MACD S/R Line to the downside
Strategy Settings
SL based on ATR Bands (0.9 ATR Multiplier recommended*)
TP based on RR (1.5 RR recommended*)
Optional EMA Filter (If set to 0 -> disabled)
Session Filter
Custom Strategy Backtesting Dashboard (Risk = 5%*)
*Recommended for a Daily BTC/USDT Chart

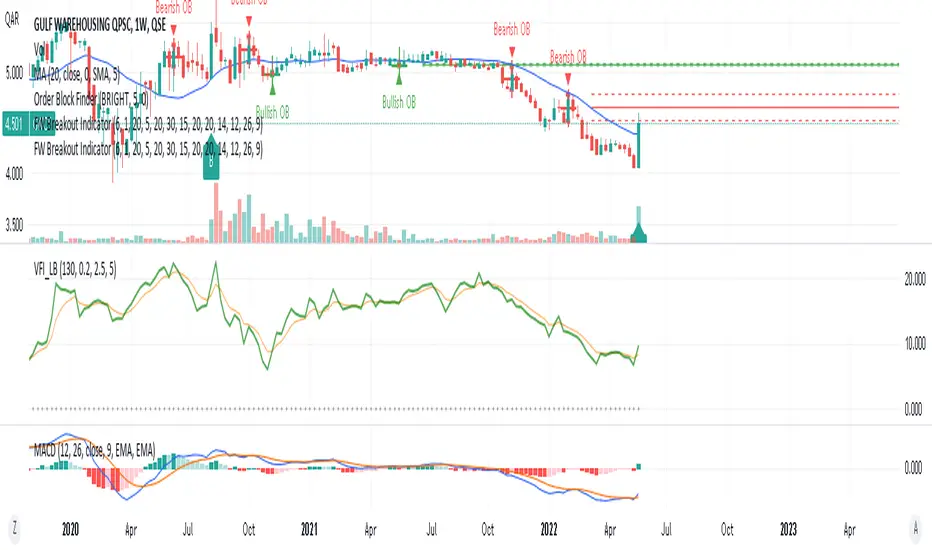
FinancialWisdom Breakout IndicatorBreakout is detected when:
1- Price is higher than previous 6 bars
2- price is above 1% of previous high and below 20%
3- price is above 20 week moving average
4- Volume is higher by 30% of 1 candle before.
5-MACD is positive
Remember indicators/strategies are there to help you in your trading and not to trade based on them solely.
Not a financial advise.
Breakout Trend Follower V2This is a variation on my other Breakout Trend Follower script. In the other script, you can use a moving average to act as a filter for your trades (i.e. if the price is below the moving average, it won't go long). After making the tool that detects trends on higher timeframes, I wanted to see if that might be a better filter than a moving average.
So this script lets you look at higher time frame trends (i.e. are there higher highs and higher lows? If so, this is an uptrend). You only take trades when you are with the trend. You have the ability to select up to two trends to act as a filter. Each trend direction is shown on a table on the chart for easy reference. The current pivot highs and lows are plotted on the chart so you can see when you might be breaking both the current timeframe's trend and higher level trends.
What I found was that in general this does not perform as well as the other strategy, but it does seem to be a lot more picky with trades. Showing higher win rates and a better profit factor. It just takes a lot less trades and the net profit isn't as good.

Breakout Machine V2 - Alerts - Bitcoin BeatsHello, Hello, Hello and welcome back to Bitcoin Beats.
As the title suggests, this is Version 2 of The Breakout Machine Alerts version.
Unlike the previous version, this one has been fine-tuned to work best on Binance Futures ( BTCUSDT ).
PLEASE BE CAREFUL WITH YOUR LEVERAGE AND DON'T GET REKT.
Trade at your own risk! Good luck!
This strategy takes MACD and Volume spikes to calculate pumps and dumps in the bitcoin market.
I've also added custom backtesting inputs and leverage for you all to experiment with and see the profitability of the Strategy.
Alerts version coming soon...
Thank you, And goodbye, from Bitcoin Beats.

BreakOut Candle with Alerts [MV]hello everyone this indicator using for automation trading with alerts
here previous Day high low
first candle high low and time frame
Green background it's mean 200 SMA above open candle
red background it's mean 200 SMA below open candle
!!! you can also change any period SMA. buy default add 200 SMA

Breakout Notifier LONGLong trades based on our breakout logic, params you can configure are Stop Loss and breakout % to track
Breakout Reversal Entry on WMA - NG1! Overnight ver 1This script is for learning purposes only
This strategy will plot arrows when price breaks so far above/below WMA. The strategy will enter when the price breaks away from WMA. All entries are reversals. Users can set WMA length and source; also the distance of the price away from WMA to enter. Adjustable bracket orders are placed for exit, with trailing stop or market stop choice. Last, users can set the time of day they want to enter a trade.
My Preference: I am testing this strategy on NG1! over night on 1 minute candle. with .003 on price drop/climb, I get entries almost every night. Also 10 tick stop and 5 tick profit seems backward to most, but with a high win/loss ratio, it performs quite well. Trailing stops generally help out as well.
INPUTS:
Length - The is the WMA length
Source - WMA source (High, Low, Open, Close...)
When Price Drops - This is the distance in ticks when the price drops away from WMA, an arrow is plotted, and reversal entry order is placed
When Price Climbs - Same as price drop, just in the opposite direction
Trailing Stop check box - Check if you want to place a trailing stop so many tick away from entry. Unchecked is Market (hard) stop so many ticks from entry.
Stop - Number of ticks away from entry a the stop or trailing stop is set (for NG 1 tick = $0.001)
Limit Out - Number of ticks away from entry a limit order is placed to take profits
Limit Time of day check box - check to use the time of day to limit what time of day order entry will occur.
Start/Stop Trades (Est Time) - First box is when the strategy will be allowed to start buying and stop is when the strategy will stop being allowed to buy. Sell orders continue until a stop or limit triggers an exit. These times are Eastern time zone
PROPERTIES:
Pyramiding - This feature will allow multiple entries to occur. If set to 1, the strategy should only trade 1 contract at a time. If set to 2, the strategy will enter a second order if entry requirements are met. This allows you to be holding 2 contracts. Basically on a good day, it will multiply your earnings, on a bad day, you'll just lose more. For testing, I keep this on 1.
TIPS:
- If you want to go long only, set "When Price Climbs" to an impossible number, like 10,000. It's not possible for NG to move $10 is a matter of minutes so it will not enter the market with a short order. Also keep in mind you can set different requirements for going long vs going short. If you think there is more pull on the market in a particular direction.

Breakout lineSimple script to find breakout levels. Set your choise of timeframe. (must to be higher then chart)