Breakout Confirmation🔍 Indicator Name: Breakout Confirmation (Body + Volume)
📌 Purpose:
This indicator is designed to detect high-probability breakout setups based on price structure and volume strength. It identifies moments when the market breaks through a key support or resistance level, confirmed by two consecutive strong candles with large real bodies and high volume.
⚙️ How It Works
1. Support and Resistance Detection
The indicator uses pivot points to identify potential horizontal support and resistance levels.
A pivot high or pivot low is considered valid if it stands out over a configurable number of candles (default: 50).
Only the most recent valid support and resistance levels are tracked and displayed as horizontal lines on the chart.
2. Breakout Setup
The breakout condition is defined as:
First Candle (Breakout Candle):
Large body (compared to the recent body average)
High volume (compared to the recent volume average)
Must close beyond a resistance or support level:
Close above resistance (bullish breakout)
Close below support (bearish breakout)
Second Candle (Confirmation Candle):
Also must have a large body and high volume
Must continue in the direction of the breakout (i.e., higher close in bullish breakouts, lower close in bearish ones)
3. Signal Plotting
If both candles meet the criteria, the indicator plots:
A green triangle below the candle for bullish breakouts
A red triangle above the candle for bearish breakouts
📈 How to Interpret the Signals
✅ Green triangle below a candle:
Indicates a confirmed bullish breakout.
The price has closed above a recent resistance level with strength.
The trend may continue higher — possible entry for long positions.
🔻 Red triangle above a candle:
Indicates a confirmed bearish breakout.
The price has closed below a recent support level with strength.
Potential signal to enter short or exit long positions.
⚠️ The plotted horizontal lines show the last key support and resistance levels. These are the zones being monitored for breakouts.
📊 How to Use It
Timeframe: Works best on higher timeframes (1H, 4H, Daily), but can be tested on any chart.
Entry: Consider entries after the second candle confirms the breakout.
Stop Loss:
For longs: Below the breakout candle or the broken resistance
For shorts: Above the breakout candle or broken support
Take Profit:
Based on previous structure, risk:reward ratios, or using trailing stops.
Filter with Trend or Other Indicators (optional):
You can combine this with moving averages, RSI, or market structure for confluence.
🛠️ Customization Parameters
lengthSR: How many candles to look back for identifying support/resistance pivots.
volLength: Length of the moving average for volume and body size comparison.
bodyMultiplier: Multiplier threshold to define a “large” body.
volMultiplier: Multiplier threshold to define “high” volume.
✅ Ideal For:
Price action traders
Breakout traders
Traders who use volume analysis
Anyone looking to automate the detection of breakout + confirmation setups
ค้นหาในสคริปต์สำหรับ "breakout"

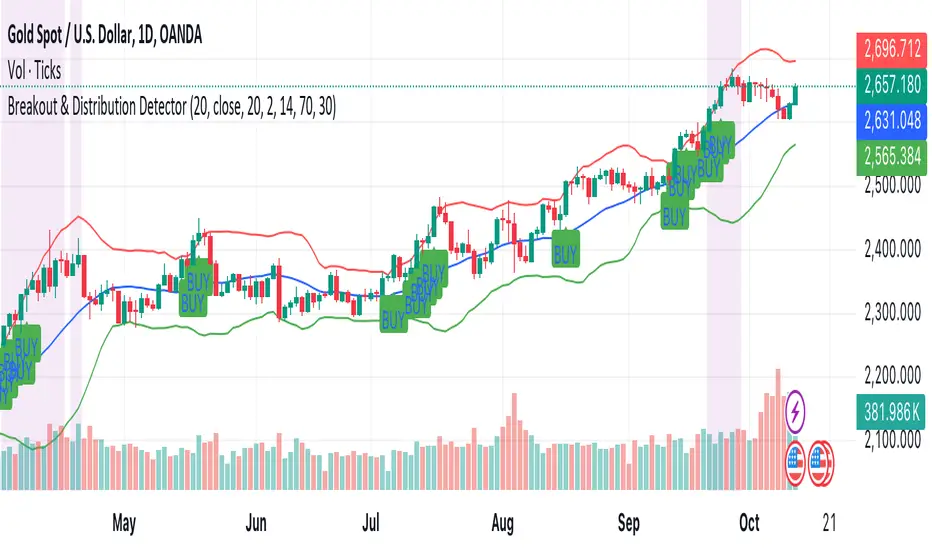
Breakout & Distribution DetectorHow the Script Works:
1. Bollinger Bands:
• The upper and lower Bollinger Bands are used to detect volatility and potential breakouts. When the price closes above the upper band, it’s considered a bullish breakout. When the price closes below the lower band, it’s a bearish breakout.
2. RSI (Relative Strength Index):
• The RSI is used for momentum confirmation. A bullish breakout is confirmed if the RSI is above 50, and a bearish breakout is confirmed if the RSI is below 50.
• If the RSI enters overbought (above 70) or oversold (below 30) levels, it signals a distribution phase, indicating the market may be ready to reverse or consolidate.
3. Moving Average:
• A simple moving average (SMA) of 20 periods is used to ensure we’re trading in the direction of the trend. Breakouts above the upper Bollinger Band are valid if the price is above the SMA, while breakouts below the lower Bollinger Band are valid if the price is below the SMA.
4. Signals and Alerts:
• BUY Signal: A green “BUY” label appears below the candle if a bullish breakout is detected.
• SELL Signal: A red “SELL” label appears above the candle if a bearish breakout is detected.
• Distribution Phase: The background turns purple if the market enters a distribution phase (RSI in overbought or oversold territory).
• Alerts: You can set alerts based on these conditions to get notifications for breakouts or when the market enters a distribution phase.
Breakouts & Pullbacks [Trendoscope®]🎲 Breakouts & Pullbacks - All-Time High Breakout Analyzer
Probability-Based Post-Breakout Behavior Statistics | Real-Time Pullback & Runup Tracker
A professional-grade Pine Script v6 indicator designed specifically for analyzing the historical and real-time behavior of price after strong All-Time High (ATH) breakouts. It automatically detects significant ATH breakouts (with configurable minimum gap), measures the depth and duration of pullbacks, the speed of recovery, and the subsequent run-up strength — then turns all this data into easy-to-read statistical probabilities and percentile ranks.
Perfect for swing traders, breakout traders, and anyone who wants objective, data-driven insight into questions like:
“How deep do pullbacks usually get after a strong ATH breakout?”
“How many bars does it typically take to recover the breakout level?”
“What is the median run-up after recovery?”
“Where is the current pullback or run-up relative to historical ones?”
🎲 Core Concept & Methodology
Indicator is more suitable for indices or index ETFs that generally trade in all-time highs however subjected to regular pullbacks, recovery and runups.
For every qualified ATH breakout, the script identifies 4 distinct phases:
Breakout Point – The exact bar where price closes above the previous ATH after at least Minimum Gap bars.
Pullback Phase – From breakout candle high → lowest low before price recovers back above the breakout level.
Recovery Phase – From the pullback low → the bar where price first trades back above the original breakout price.
Post-Recovery Run-up Phase – From the recovery point → current price (or highest high achieved so far).
Each completed cycle is stored permanently and used to build a growing statistical database unique to the loaded chart and timeframe.
🎲 Visual Elements
Yellow polyline triangle connecting Previous ATH / Pullback point(start), New ATH Breakout point (end), Recovery point (lowest pullback price), and extends to recent ATH price.
Small green label at the pullback low showing detailed tooltip on hover with all measured values
Clean, color-coded statistics table in the top-right corner (visible only on the last bar)
Powerful Statistics Table – The Heart of the Indicator
The table constantly compares the current situation against all past qualified breakouts and shows details about pullbacks, and runups that help us calculate the probability of next pullback, recovery or runup.
🎲 Settings & Inputs
Minimum Gap
The minimum number of bars that must pass between breaking a new ATH and the previous one.
Higher values = stricter filter → only the strongest, cleanest breakouts are counted.
Lower values = more data points (useful on lower timeframes or very trending instruments).
Recommendation:
Daily charts: 30–50
4H charts: 40–80
1H charts: 100–200
🎲 How to Use It in Practice
This indicator helps investors to understand when to be bullish, bearish or cautious and anticipate regular pullbacks, recovery of markets using quantitative methods.
The indicator does not generate buy/sell signals. However, helps traders set expectations and anticipate market movements based on past behavior.

Breakout Signals This indicator is a Pine Script tool for identifying potential trading opportunities using breakout signals. It provides two distinct types of breakout alerts and calculates a potential price target for one of them.
### Breakout Signal Types
* **Lowest Low Breakout:** This signal is triggered when the current bar closes above the high of the previous bar, and that previous bar had the lowest low within a user-defined lookback period. This indicates a potential bullish reversal after a short-term downtrend.
* **Highest High Breakout:** This signal occurs when the current bar's close price exceeds the highest high recorded within a specified lookback period. This pattern suggests strong bullish momentum and a potential continuation of an uptrend.
### Visuals and Alerts
The indicator helps visualize these signals on the chart by highlighting the background of entry candles. It uses a light green background for the Lowest Low Breakout and a light yellow for the Highest High Breakout. A table is displayed on the chart to show the details of the most recent Lowest Low Breakout and its calculated target. Additionally, it provides an alert feature to notify users in real time when either of the breakout conditions is met.

Breakout Detection using EMAs and Mansfield Relative StrengthThis script identifies breakout opportunities based on a combination of price action, volume, and relative strength. It is designed for daily timeframe charts and helps traders pinpoint strong bullish setups with the following criteria:
Price Action: Stock price is above both the 10-day EMA and 5-week EMA.
EMA Trends: The 10-day EMA is above the 20-day EMA, and the 5-week EMA is above the 10-week EMA, confirming bullish momentum.
Customizable Parameters: Customize the index for the Mansfield Relative Strength, the volume multiplier, and the price breakout look-back period.
Price Breakout: The price is at a 3-month high, indicating strength.
Volume Breakout: A volume spike occurs, surpassing the 20-day average volume by a user-defined multiplier.
Features:
Generates clear breakout signals with a green triangle below the bar.
Integrated Mansfield Relative Strength for relative performance analysis.
Alerts for when all conditions are met, ensuring you never miss an opportunity.
How to Use:
Add this script to a daily chart of your chosen stock.
Look for green triangle signals indicating a potential breakout.
Adjust the parameters to suit your trading strategy and preferred index for the Mansfield Relative Strength.
This tool is ideal for swing traders looking to combine technical analysis with relative strength metrics for high-conviction bullish setups.

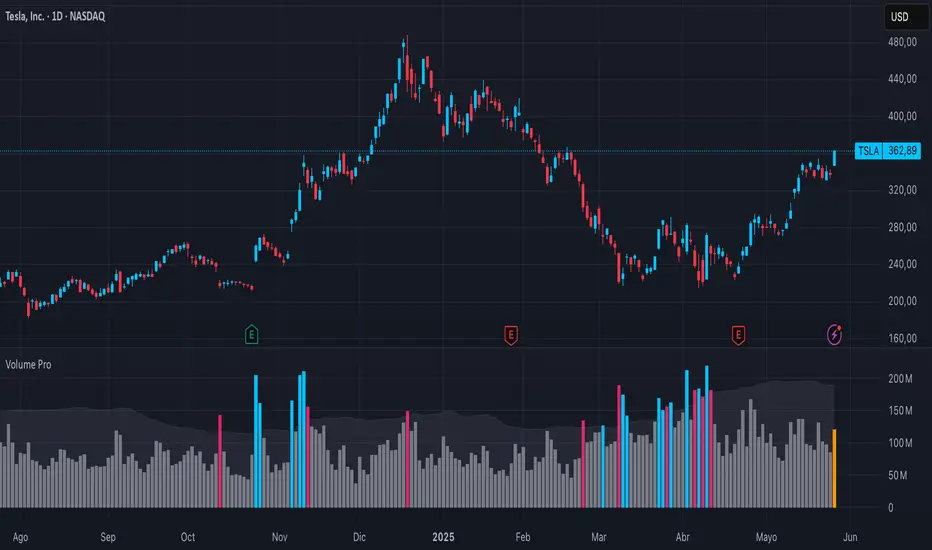
Breakout Volume PROBreakout Volume PRO
Real + Projected Volume Detection
This advanced volume indicator detects breakouts based on both actual and projected volume, allowing you to anticipate strong market moves before the current candle closes.
🔹 Key Features:
Volume breakout detection based on configurable moving average and multiplier.
Early signal when projected volume exceeds threshold before candle close.
Distinct coloring for bullish, bearish, and early breakout volume.
Customizable volume threshold area and base average.
Compatible with any timeframe, including daily and intraday.
Colors:
🔵 Blue: Bullish breakout
🔴 Red: Bearish breakout
🟠 Orange: Projected breakout in progress
⚪️ Gray: Normal volume
Perfect for identifying accumulation, distribution, or high-volume events that may precede price breakouts.
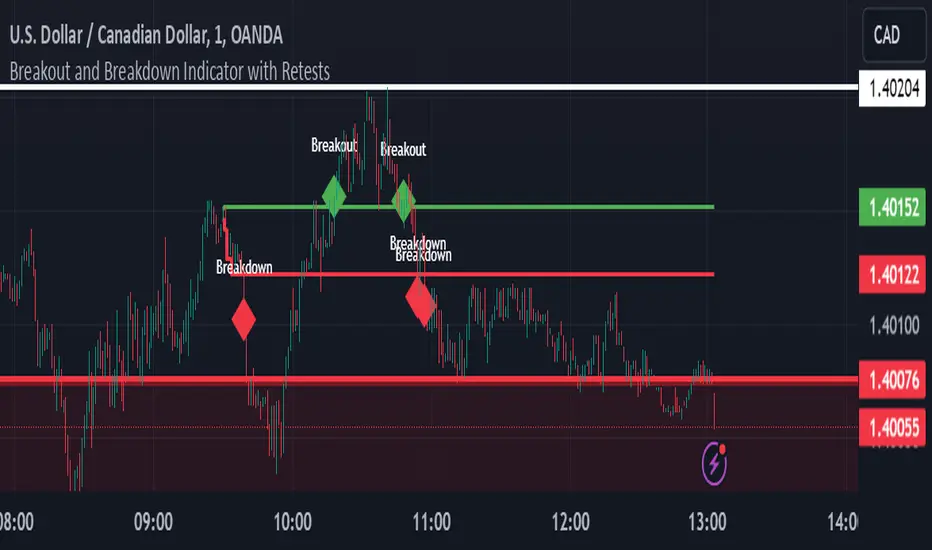
Breakout and Breakdown Indicator with RetestsThis indicator is designed to help traders identify high-probability breakout and breakdown points based on the first 5 minutes of market activity (9:30 am to 9:35 am). It works effectively on both the 1-minute and 5-minute timeframes, making it ideal for day traders and scalpers.
This indicator is a better indicator of my previous 5-Minute Opening Range Breakout indicator.
Key Features:
Dynamic Support and Resistance Lines: Automatically plots the highest and lowest price levels from 9:30 am to 9:35 am, providing essential support and resistance zones.
Breakout/Breakdown Detection: Identifies and marks successful breakout and breakdown points only after a confirmed retest, ensuring more accurate signals.
Visual Markers: Uses customizable green diamonds for successful breakouts and red diamonds for successful breakdowns, allowing easy identification on the chart.
Customization Options:
Change Colors: You can personalize the color of the breakout and breakdown markers, the label text, and the lines drawn from the 9:30 am to 9:35 am window.
Adapt to Your Chart: Adjust the indicator to match your preferred charting theme, ensuring it blends seamlessly with your trading setup.
How It Works:
Plots Key Levels: Identifies the highest and lowest prices during the first 5 minutes of trading (9:30 am to 9:35 am) and plots them on the chart.
Monitors Retests: Waits for a retest of these levels before confirming a breakout or breakdown.
Labels Breakouts/Breakdowns: After a retest, successful breakouts are marked with green diamonds and "Breakout" text, while breakdowns are marked with red diamonds and "Breakdown" text.
Why Use This Indicator?
Avoid False Signals: The retest requirement helps filter out false breakouts and breakdowns, offering more reliable trading signals.
Works Across Timeframes: Suitable for both 1-minute and 5-minute charts, allowing flexibility for different trading styles.
Some what Customizable: Adjust colors to fit your charting preferences and enhance visual clarity.
Recommended Use: Combine this indicator with other technical analysis tools, such as volume, candlestick patterns, or moving averages, for more informed trading decisions.
Breakout Scanner Checklist for Swing Trades📈 EOD Breakout Scanner Checklist Overview
This indicator combines Mark Minervini's legendary Trend Template criteria with additional breakout detection enhancements, specifically optimized for end-of-day (EOD) scanning and Qullamaggie-style momentum trading.
Perfect for swing traders who scan stocks after market close and execute breakout entries on the first 5-minute candle after market open.
🎯 Core Features
1. Complete Minervini Trend Template (8 Criteria)
Implements all 7 rules from Mark Minervini's trend template methodology:
- Price above 150 & 200 day EMAs (long-term uptrend)
- EMA(150) above EMA(200) (trend alignment)
- EMA(200) trending up for at least 1 month (sustained trend)
- EMA(50) above both 150 & 200 EMAs (intermediate strength)
- Current price above EMA(50) (short-term momentum)
- Price at least 25% above 52-week low (sufficient rally)
- Price within 25% of 52-week high (near strength)
- (additional) Price within 10% above EMA(10) (not overextended)
2. Enhanced Breakout Detection (Toggle On/Off)
Three powerful enhancements that can be individually enabled:
Stage Analysis - Identifies stocks in Weinstein Stage 2 (advancing phase)
- Confirms proper EMA alignment
- Validates upward slope of 200 EMA
- Filters out late-stage or declining trends
Volatility Squeeze - Detects "coiled spring" setups
- ATR compression (recent volatility < 80% of average)
- Bollinger Band squeeze detection
- Identifies tight consolidations before explosive moves
Price Action Quality - Measures clean accumulation
- Up/down day ratio (prefers >1.2 ratio)
- Controlled price range (< 20% over 20 days)
- Filters erratic, whipsaw price action
3. Dual Table System
Main Table - Focus on what matters
- Shows only enabled enhanced criteria
- 🚀 BREAKOUT SIGNAL - Clear YES/NO verdict
- Clean visual hierarchy
Support Table (Optional) - Deep dive analysis
- All 8 Minervini criteria with status
- Can be toggled on/off for cleaner charts
- Perfect for understanding why a signal triggered
🔧 How To Use
For EOD Scanning:
- Run this indicator on your stock universe after market close
- Look for stocks showing 🚀 BREAKOUT SIGNAL = YES for quick scan or use the support table to reach more details for deep down analysis
- Add the stocks falls with your criteria to your watchlist for the next trading day
For Intraday Execution:
- At market open, watch your watchlist from EOD scan
- Identify the pivot point (recent resistance high, possible PDH)
- Wait for price to break above pivot on first 5-min candle
- Confirm with volume
- Enter if both price + volume confirm breakout
Note on Volume:
This indicator intentionally does NOT include volume confirmation in the signal, as it's designed for EOD scanning. You should manually verify volume when the actual breakout occurs at market open.
🎨 Visual Features
- EMA(10) Zone: Purple shaded area showing 10% zone above EMA(10)
- 52-Week High/Low Lines: Orange reference lines (toggleable)
- Modern Dark Theme: Low-contrast, professional design easy on the eyes
- Clean Status Indicators: ✓ for pass, ✗ for fail
⚙️ Customizable Settings
Display Options:
- Toggle 52-week high/low lines
- Toggle EMA(10) +10% zone
- Adjust lookback periods
Enhanced Detection:
- Enable/disable Stage Analysis
- Enable/disable Volatility Squeeze
- Enable/disable Price Action Quality
Panel Settings:
- Position tables (top/middle/bottom, left/center/right)
- Show/hide Minervini criteria support table
📚 Best For
✅ Swing traders looking for momentum breakouts
✅ Traders using EOD scanning + intraday execution
✅ Minervini/O'Neil CANSLIM methodology followers
✅ Qullamaggie-style breakout traders
✅ Anyone seeking high-probability setups with institutional backing
💡 Trading Strategy Context
This indicator is based on proven methodologies:
- Mark Minervini: SEPA (Specific Entry Point Analysis) and Trend Template
- Kristjan Qullamaggie: Momentum breakouts with volume confirmation
- Stan Weinstein: Stage Analysis for market cycle timing
Combined, these create a powerful framework for identifying stocks with:
- Strong institutional sponsorship
- Proper trend structure
- Tight consolidation (coiled energy)
- Clean accumulation patterns
- High probability of continuation
⚠️ Disclaimer
This indicator is a screening and analysis tool, not a trading system. It helps identify potential setups but does not provide entry/exit signals. Always:
- Verify volume at actual breakout
- Use proper position sizing
- Set stop losses
- Manage risk appropriately
- Do your own due diligence
Past performance does not guarantee future results.
📖 Credits
Based on Mark Minervini's Trend Template methodology and enhanced with modern breakout detection techniques. Original code/influence by yogy.frestarahmawan.
Happy Trading! 🚀
If you find this indicator useful, please give it a thumbs up and share your feedback!

Breakout Volume AlertThis indicator helps traders identify true breakouts confirmed by strong volume.
It automatically highlights candles where the current bar’s volume is greater than 1.5× the 10-bar average volume, confirming institutional participation and momentum strength.
How It Works:
A yellow line tracks the 10-bar volume average.
When current volume exceeds 1.5× the average, the bar turns green — signaling strong buying/selling interest.
Normal or weak bars remain faded red.
You can use this with your Price Action + Multi-Timeframe strategy to validate breakouts, retests, and reversals
Best Used For:
Breakout + Retest confirmation (Intraday or Swing)
Volume spike detection before momentum moves
Filtering fake breakouts with low participation
Works perfectly with 5m / 15m / 30m / 4H charts
Settings:
Default volume average length = 1
Volume strength multiplier = 1.5×
Add alert: "Volume > 1.5x average" for instant notifications

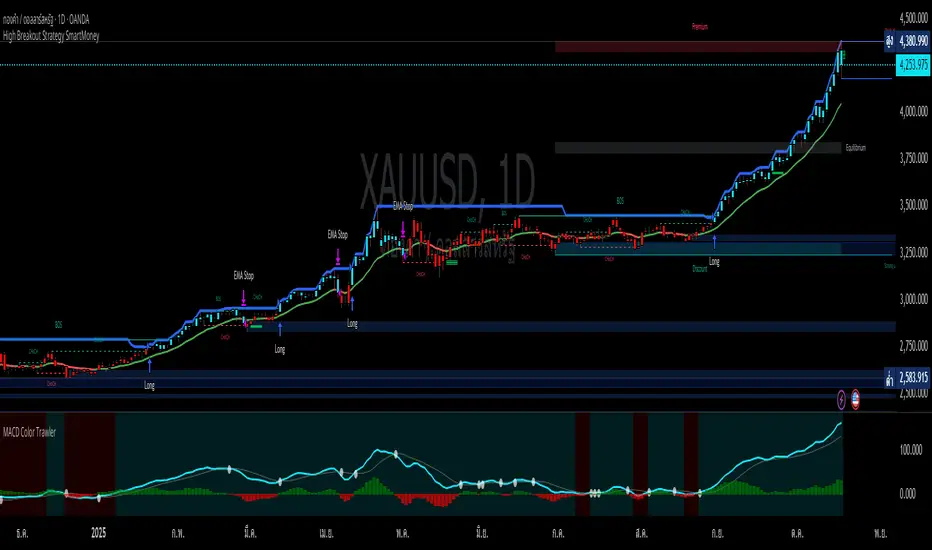
High Breakout Strategy SmartMoneybreakout_lookback = input.int(52, title="Breakout Lookback Period", minval=1)
// Trend & Trailing Stop Filter
ema_length = input.int(15, title="EMA Length", minval=1)
// Risk Management
risk_percent = input.float(6.0, title="Risk Stop-Loss (%)", minval=0.1)
Breakout asia USD/CHF1 — Customizable Parameters
sess1 & sess2: The two time ranges that define the Asian session (e.g., 20:00–23:59 and 00:00–08:00).
Important: format is HHMM-HHMM.
rr: The risk/reward ratio (default = 3.0, meaning TP = 3× risk size).
onePerSess: Toggle to allow only one trade per Asian session or multiple.
bufTicks: Extra margin for the SL beyond the signal candle.
2 — Detecting the Asian Session
The script checks if the candle’s time is inside the first range (sess1) or inside the second range (sess2).
While inside the Asian session, it updates the current high and low.
When the session ends, it locks in these levels as rangeHigh and rangeLow.
3 — Step 1: Detecting the Initial Breakout
Bullish breakout → close above rangeHigh → flag breakoutUp is set to true.
Bearish breakout → close below rangeLow → flag breakoutDown is set to true.
No trade yet — this is just the breakout signal.
4 — Step 2: Waiting for the Retest
If a bullish breakout occurred, wait for the price to return to or slightly below rangeHigh and then close back above it.
If a bearish breakout occurred, wait for the price to return to or slightly above rangeLow and then close back below it.
5 — Entry & Exit
When the retest is confirmed:
strategy.entry() is triggered.
SL = behind the retest confirmation candle (with optional bufTicks margin).
TP = entry price ± RR × risk size.
If onePerSess is enabled, no further trades happen until the next Asian session.
6 — Chart Display
Green line = locked Asian session high.
Red line = locked Asian session low.
Light blue background = active Asian session hours.
Trade entries are shown on the chart when retests occur.

Breakout + Retest StrategyThe Breakout + Retest Strategy is a proven price action approach used by professional traders to catch high-probability market moves after key levels are broken. This strategy aims to enter the market after confirmation — reducing false breakouts and improving entry accuracy.
🔍 Strategy Logic:
Identify a Key Support or Resistance Level
These could be recent swing highs/lows, consolidation zones, or session highs.
Wait for a Clean Breakout
Price must decisively break above resistance or below support with strong momentum.
Watch for the Retest
After the breakout, wait for the price to pull back to the broken level (now flipped support/resistance).
Enter on Retest Confirmation
Look for signs like rejection wicks, bullish/bearish engulfing candles, or strong volume on the retest.
Set Risk-Managed Stops and Targets
Stop loss goes below (for long) or above (for short) the retested level.
Target is usually set at a 1:2 or higher risk-to-reward ratio, or based on structure.
✅ Why It Works:
Filters out fake breakouts
Uses market structure and liquidity traps to your advantage
Combines both momentum and confirmation
⚙️ Best Timeframes:
15-minute to 1-hour for intraday setups
4-hour and daily for swing trades
📊 Ideal for:
Futures (NQ, ES, Gold)
Forex pairs
Crypto
Stocks near key earnings or breakout zones

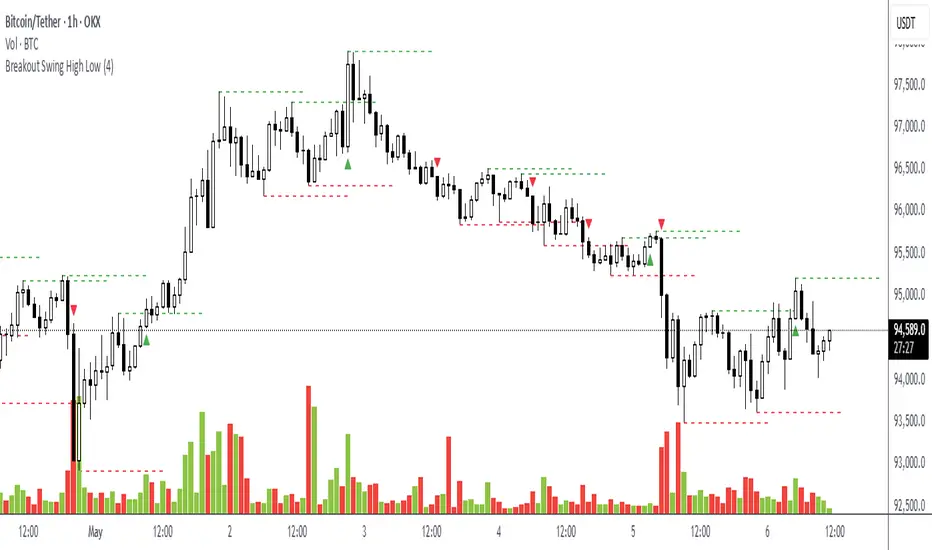
Breakout Swing High LowThis open-source indicator identifies swing high and swing low breakouts, providing clear visual signals for potential trend entries. It is designed for traders who use price action to spot breakout opportunities in trending markets.
How It Works
Swing Detection: The indicator uses a user-defined lookback period (default: 4 candles) to identify swing highs (peaks) and swing lows (troughs). A swing high is confirmed when a candle's high is higher than the surrounding candles, and a swing low is confirmed when a candle's low is lower.
Breakout Signals: A green triangle below the candle signals a breakout above the most recent swing high, indicating a potential buy opportunity. A red triangle above the candle signals a breakout below the most recent swing low, indicating a potential sell opportunity. Each swing level triggers only one breakout signal to avoid clutter.
Visualization: Swing high levels are drawn as green dashed lines, and swing low levels as red dashed lines, extending 15 candles for clarity. Breakout signals are marked with small triangles.
How to Use
Apply the Indicator: Add the indicator to your TradingView chart.
Adjust Lookback: Set the "Lookback Candles" input (default: 4) to control the sensitivity of swing detection. Smaller values detect shorter-term swings, while larger values identify more significant levels.
Interpret Signals:
Green triangle (below candle): Consider a buy opportunity when price breaks above a swing high.
Red triangle (above candle): Consider a sell opportunity when price breaks below a swing low.
Combine with Other Tools: Use in conjunction with trend indicators (e.g., 50-period EMA) or support/resistance levels to filter signals in trending markets.
Timeframes: Works best on higher timeframes (e.g., 1H, 4H) in trending markets to avoid false breakouts in sideways conditions.
Breakout Finder By Hitesh Somani(Aapkainvestments)Breakout Finder By Hitesh Somani(Aapkainvestments)
Welcome to one of the most powerful momentum reversal indicators designed specifically for traders looking to catch high-probability reversal signals with precision and confidence.
✅ This indicator gives high-probability SELL signals based on RSI momentum and Bollinger Band breakouts.
✅ It filters noise and avoids over-trading, focusing only on setups that meet high-conviction criteria with built-in back-to-back signal prevention.
✅ Works best on 5-minute and 15-minute timeframes in trending markets.
✅ Features dual-mode operation: RSI Confirmation mode for momentum validation or Pure Price Action mode for breakout detection.
✅ Automatically calculates Entry, Stop Loss, and Target levels with customizable Risk:Reward ratio (default 1:1.5).
Suggested Rules to Use This Indicator Effectively
Follow these rules and you'll see the accuracy improve significantly:
• Best trading hours: 9:30 AM to 2:30 PM – Avoid trades in the last hour of market
• Entry Strategy: Enter short when the low of the signal candle breaks on the next candle
• Stop Loss: Automatically set at the higher of signal candle high or previous candle high
• Target: Default 1:1.5 Risk:Reward ratio (customizable up to 1:10)
• Trail Stop Loss: After reaching 1:1 risk:reward, consider trailing your stop to lock in profits
• If a new signal comes while an earlier trade is running, the indicator automatically prevents back-to-back signals (shows blue circle for filtered signals)
• Use RSI Confirmation mode for higher accuracy in trending markets, or disable it for pure price action setups
• Monitor the Intelligence Dashboard for real-time RSI, Breakout status, Entry, SL, and Target levels
These simple rules, when followed with discipline, can help you extract consistent profits from momentum reversals and breakout pullback trades.
This isn't just another Indicator — it's built in-house by Hitesh Somani, tested on real price action, and trusted by the Aapka Investment community.
Disclaimer:
This content is purely for educational purposes.
We are not responsible for any financial profits or losses resulting from use of this tool or content.

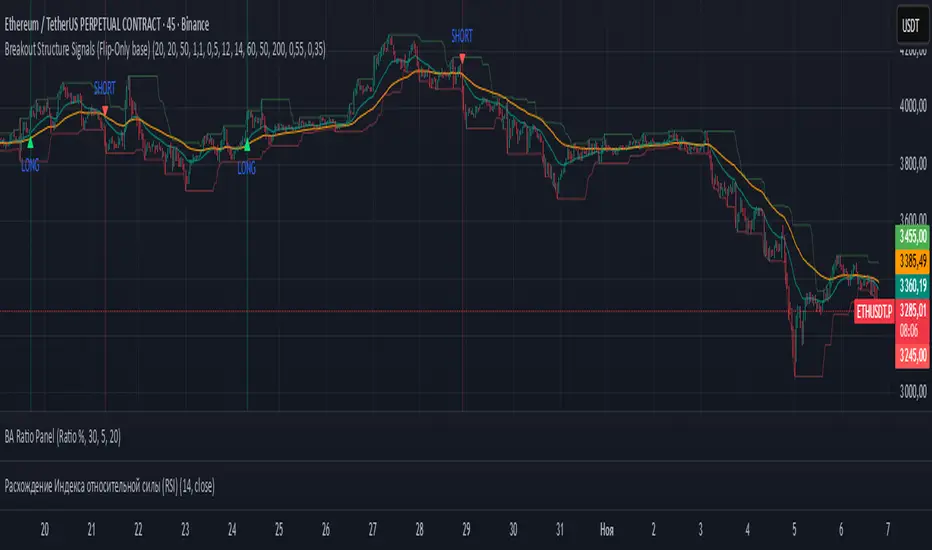
Breakout Structure SignalsBreakout Structure Signals
Trend-following Donchian breakouts with optional retests, HTF trend filter, volume & ADX gates, and one-signal-per-direction control.
What it does
Prints LONG / SHORT when price breaks the prior Donchian High/Low and/or makes a qualified retest of that level.
Works with trend via EMAs on the chart TF; optional HTF EMA filter confirms higher-timeframe bias.
Optional Volume and ADX filters, plus soft candle-quality checks.
Signals confirm on bar close (no intrabar repaint on your chart TF). Duplicate signals can be suppressed until direction flips.
Core logic
Breakout Long: close > DonchianHigh AND EMAfast > EMAslow AND close > EMAslow .
Breakout Short: close < DonchianLow AND EMAfast < EMAslow AND close < EMAslow .
Retest (optional): after breakout, wait up to maxBarsWait for a pullback within ATR × retestTolATR around the breakout level; price must also align with the fast EMA (above for longs, below for shorts).
Filters (optional): Volume > SMA20 × volMult , ADX > 20 , candle-quality: close position within range ≥ closePosMin and body/range ≥ impulseBodyMin .
HTF trend (optional): Longs require HTF EMAfast > HTF EMAslow ; shorts require the opposite (via request.security on htf_tf ).
Inputs (key)
lengthRange — Donchian N (high/low lookback).
emaFastLen , emaSlowLen — chart-TF trend filter.
useVolumeFilt , volMult — volume gate (turn OFF where volume is unreliable).
useRetest , retestTolATR , maxBarsWait — retest behavior & tolerance.
useADX , adxLen — trend-strength filter.
useHTF , htf_tf , htfEmaFastLen , htfEmaSlowLen — higher-TF confirmation.
useCandleQual , closePosMin , impulseBodyMin — soft candle-quality checks.
confirmOnClose — confirm signals on close.
suppressSameSide — block repeats until reversal.
showBg — background highlight on signal bars.
Visuals
Plots: EMA Fast , EMA Slow , Donchian High/Low .
Markers: triangle LONG below bars, triangle SHORT above bars.
Optional background tint on signal bars.
Alerts
LONG signal — breakout or qualified retest (long).
SHORT signal — breakout or qualified retest (short).
How to use
Start with Donchian 20 , EMA 20/50 ; for LTF trading, consider HTF = 60m/240m.
Retests: try 0.3–0.6 ATR tolerance and 8–12 bars wait for cleaner fills.
Stops: beyond breakout/retest by 1–1.5 ATR or beyond fast EMA; manage with partials and a trailing exit.
Turn Volume filter OFF where volume isn’t informative.
This indicator provides signals only; always combine with risk management.
Breakout an Reversal Signal Detector with Colored in Bar TrendsThe script detects breakouts and/or reversals: when candles close outside the recent period high or low, it prompts a signal, indicating a change in market trend.
You can customize the bar color to indicate trending phases.
It can be used effectively to identify both breakouts and reversals, making it a versatile tool for trend and reversal analysis.
Simple yet effective.
Enjoy!

Breakout line - AndurilThis line shows the highest daily closing price of last 20 days default (can be adjusted from the settings). to help you to understand consolidation points and breakouts.

Breakout: HHHL & LLHL + Close ConditionWhat This Script Does:
Green triangle below the bar = Bullish breakout (Higher High + Higher Low + Close > Previous High)
Red triangle above the bar = Bearish breakdown (Lower High + Lower Low + Close < Previous Low)

Breakout mode patterns [yohtza]This indicator detects three kinds of price action patterns:
ii - consecutive inside bars ( high and low inside of the previous bar), triangle on a lower timeframe
oo - consecutive outside bars ( high above the high of the previous bar and the low below the low of the previous bar), expanding triangle on a lower timeframe
ioi - inside outside inside, diamond pattern on a lower timeframe
Traders that trade these patterns are entering on breakouts above/below .When they appear in a trending market, they are good setups for both continuation and reversal swing trades. When they appear in ranging market, they are not nearly as powerful since most breakouts fail in this context. To achieve the highest probability, it is best to trade in the direction of the trend on the last bar in the pattern with a stop loss on the other side and going for a reward that is at least twice the risk.

Breakout DetectorDetects possible breakouts (from sideways) and shows trade opportunities
the grey areas show breakout potentials (from sideways)
the red and green bars show trade opportunities
optimized for Bitcoin 1 hour
