Pineconnector Strategy TemplateHello traders
After getting five requests in a raw to convert an indicator into a backtest strategy with statistics + Metatrader MT4/MT5 bot using Pineconnector, I decided to publish this TradingView strategy plug-and-play template automatically generating the Pineconnector alerts for you.
Trial
A 4-day FREE TRIAL is available upon request.
I'll help you with the Expert Advisor configuration on Metatrader if needed.
Features
✅ Easily convert your TradingView Indicators into a Strategy with automatically generated alerts using the Pineconnector syntax.
Non-coders don't know how to send the entry price/SL/TP/etc information from TradingView to Pineconnector.
I made that automatic - the alert messages are automatically generated with the correct syntax based on the selected broker connected to your Metatrader.
For example, the OANDA tickers aren't the same as the EightCap tickers.
The template pre-selects the correct tickers for you, and I'll keep updating that tickers list whenever there is a ticker name update on the broker side.
✅ Select whether you want to create "at-market" or "limit" orders.
The alert messages are updated accordingly.
✅ Custom close condition
Some indicators may have a custom close trade condition
For example, A trader could decide to cut a trade if another indicator gives a signal in the opposite direction
In that case, the template alerts the Expert Advisor to close the opened trade(s).
✅ Includes a Stop-Loss, Take-Profit, Trailing Stop-Loss, Stop-Loss to breakeven features
The Stop-Loss/Take-Profit can be set in percentage or pips value.
The template sends those price values to the MetaTrader Expert Advisor.
✅ For a complicated TradingView script to connect or for more filters, we suggest selecting the "Custom Integration" option
A complex TradingView is any script involving a Zig Zag, divergences, Harmonic patterns, or similar logic.
If you don't know if the indicator(s) you want to connect is/are complex or not, please ask me in DM to have a look first.
Alerts
Important: When creating the alerts, select the option "Order fills and alert() function calls"
Leave the alert message field as is - It has already been pre-filled for you.
Need more information?
For more information, please send me a direct message or email.
Strategy Results from this post
Please note they're not relevant.
I connected a simple SMA cross indicator not to showcase the backtest statistics but the connection feature between a TradingView indicator script with this Pineconnector strategy template.
Dave
ค้นหาในสคริปต์สำหรับ "bot"

Consolidation Finder Expo [serkany88]It's relatively easy to create a repainting system where you can detect consolidation but it can be pretty hard to detect breakouts while the consolidation is happening live. This experimental approach came to my mind after brainstorming a bit.
What it does
This indicator DOES NOT REPAINT and try to show consolidation zones by coloring the bars or background to a selected color(default white)
How it works
In this approach we use weighted standard deviation of Vidya (Variable Index Dynamic Average created by Tushar Chande). The reason we use vidya is it's length is actually being adapted to volatility and lookback is dynamically adjusted. After getting vidya of base we also create same length vidya of high's and low's and get weighted standard deviation of those. After this we add and subtract those with base vidya and and get their average with our multiplier weight starting from the first bar. If our current value is higher than the average it means we are not in consolidation, else we are thus the bar and background will be painted.
How to use
Consolidation Finder can be used with your existing bot strategy as an additional filter or can be used with your manual trading system as an additional filter or detect breakouts. But be aware that you might need to tinker with length and multipliers in the settings depending on your timeframe to get best results possible before using it reliably. You can also enable the plots of vidya's from the style tab which is disabled by default to see how the deviations actually move if you are interested in it.

Cloud Levels [Import Price Levels]This script allows you to import TA and price levels from an external source. For example, you may do some TA on a different software but want to import it to TradingView. Or you may have a script or bot that calculates levels for you end-of-day. Or you may be part of a community that provides TA and levels. There are many different reasons why you may want to import levels from an external source.
All you need is a source for the data. The data format shouldn't really matter since it can usually be converted fairly easily to a custom format. Information about the necessary format can be found below.
The script currently supports:
Labelled lines with customs style and colors
Boxes / zones with custom fill color and borders
Fibonacci ratios
In the plans:
Channel support
Trend lines
The input format looks like this:
FIGURE 1 - Lines with labels
Columns: ,,,,;
Example: 1677724019999,3976.50,Label text,255/255/0/125,sol
FIGURE 2 - Boxes
Columns: ,,,,,,,;
Example: 1686715971428,4430.18,1686773561538,4409.52,68/98/194/15,1,1,153/204/255/204
FIGURE 3 - Fibonacci ratios
Columns: ,,,,,,,,
Example: 1656649151300,4588.75,1656649151300,3639,dot,1,3,0.236|0.382|0.5|0.618|0.706|0.786|0.886,170/200/255/76|170/200/255/76|170/200/255/76|0/255/0/76|255/153/0/76|255/153/0/76|255/153/0/76
*ratios and ratio colors are separated by '|'
*RGBA colors must look like this: 255/255/0/125, each value separated by '/'
*Line style s must be one of these values: dsh, sol or dot (dashed, solid or dotted)
Separate each item within the same figure with a semicolon (;), e.g for two labelled lines: 1677724019999,3976.50,Label text,255/255/0/125,sol;1677724019999,4026,Label text 2,255/255/0/125,sol
Only put a semicolon at the end if there is a new item after it.
Finally, put all figures together with '§' separator between each figure/category, in the correct order:
1 - Lines with labels
2 - Boxes
3 - Fibonacci ratios
The result looks like this for the examples above:
1677724019999,3976.50,Label text,255/255/0/125,sol§1686715971428,4430.18,1686773561538,4409.52,68/98/194/15,1,1,153/204/255/204§1656649151300,4588.75,1656649151300,3639,dot,1,3,0.236|0.382|0.5|0.618|0.706|0.786|0.886,170/200/255/76|170/200/255/76|170/200/255/76|0/255/0/76|255/153/0/76|255/153/0/76|255/153/0/76
An incorrect format will give you errors.
With basic programming skills you can create a simple tool to convert your data to this format, that's what I do. If needed, I may be able to provide a customized converting tool for this, PM if interested.

ATR GOD Strategy by TradeSmart (PineConnector-compatible)This is a highly-customizable trading strategy made by TradeSmart, focusing mainly on ATR-based indicators and filters. The strategy is mainly intended for trading forex , and has been optimized using the Deep Backtest feature on the 2018.01.01 - 2023.06.01 interval on the EUR/USD (FXCM) 15M chart, with a Slippage value of 3, and a Commission set to 0.00004 USD per contract. The strategy is also made compatible with PineConnector , to provide an easy option to automate the strategy using a connection to MetaTrader. See tooltips for details on how to set up the bot, and check out our website for a detailed guide with images on how to automate the strategy.
The strategy was implemented using the following logic:
Entry strategy:
A total of 4 Supertrend values can be used to determine the entry logic. There is option to set up all 4 Supertrend parameters individually, as well as their potential to be used as an entry signal/or a trend filter. Long/Short entry signals will be determined based on the selected potential Supertrend entry signals, and filtered based on them being in an uptrend/downtrend (also available for setup). Please use the provided tooltips for each setup to see every detail.
Exit strategy:
4 different types of Stop Losses are available: ATR-based/Candle Low/High Based/Percentage Based/Pip Based. Additionally, Force exiting can also be applied, where there is option to set up 4 custom sessions, and exits will happen after the session has closed.
Parameters of every indicator used in the strategy can be tuned in the strategy settings as follows:
Plot settings:
Plot Signals: true by default, Show all Long and Short signals on the signal candle
Plot SL/TP lines: false by default, Checking this option will result in the TP and SL lines to be plotted on the chart.
Supertrend 1-4:
All the parameters of the Supertrends can be set up here, as well as their individual role in the entry logic.
Exit Strategy:
ATR Based Stop Loss: true by default
ATR Length (of the SL): 100 by default
ATR Smoothing (of the SL): RMA/SMMA by default
Candle Low/High Based Stop Loss: false by default, recent lowest or highest point (depending on long/short position) will be used to calculate stop loss value. Set 'Base Risk Multiplier' to 1 if you would like to use the calculated value as is. Setting it to a different value will count as an additional multiplier.
Candle Lookback (of the SL): 50 by default
Percentage Based Stop Loss: false by default, Set the stop loss to current price - % of current price (long) or price + % of current price (short).
Percentage (of the SL): 0.3 by default
Pip Based Stop Loss: Set the stop loss to current price - x pips (long) or price + x pips (short). Set 'Base Risk Multiplier' to 1 if you would like to use the calculated value as is. Setting it to a different value will count as an additional multiplier.
Pip (of the SL): 10 by default
Base Risk Multiplier: 4.5 by default, the stop loss will be placed at this risk level (meaning in case of ATR SL that the ATR value will be multiplied by this factor and the SL will be placed that value away from the entry level)
Risk to Reward Ratio: 1.5 by default, the take profit level will be placed such as this Risk/Reward ratio is met
Force Exiting:
4 total Force exit on custom session close options: none applied by default. If enabled, trades will close automatically after the set session is closed (on next candle's open).
Base Setups:
Allow Long Entries: true by default
Allow Short Entries: true by default
Order Size: 10 by default
Order Type: Capital Percentage by default, allows adjustment on how the position size is calculated: Cash: only the set cash amount will be used for each trade Contract(s): the adjusted number of contracts will be used for each trade Capital Percentage: a % of the current available capital will be used for each trade
ATR Limiter:
Use ATR Limiter: true by default, Only enter into any position (long/short) if ATR value is higher than the Low Boundary and lower than the High Boundary.
ATR Limiter Length: 50 by default
ATR Limiter Smoothing: RMA/SMMA by default
High Boundary: 1000 by default
Low Boundary: 0.0003 by default
MA based calculation: ATR value under MA by default, If not Unspecified, an MA is calculated with the ATR value as source. Only enter into position (long/short) if ATR value is higher/lower than the MA.
MA Type: RMA/SMMA by default
MA Length: 400 by default
Waddah Attar Filter:
Explosion/Deadzone relation: Not specified by default, Explosion over Deadzone: trades will only happen if the explosion line is over the deadzone line; Explosion under Deadzone: trades will only happen if the explosion line is under the deadzone line; Not specified: the opening of trades will not be based on the relation between the explosion and deadzone lines.
Limit trades based on trends: Not specified by default, Strong Trends: only enter long if the WA bar is colored green (there is an uptrend and the current bar is higher then the previous); only enter short if the WA bar is colored red (there is a downtrend and the current bar is higher then the previous); Soft Trends: only enter long if the WA bar is colored lime (there is an uptrend and the current bar is lower then the previous); only enter short if the WA bar is colored orange (there is a downtrend and the current bar is lower then the previous); All Trends: only enter long if the WA bar is colored green or lime (there is an uptrend); only enter short if the WA bar is colored red or orange (there is a downtrend); Not specified: the color of the WA bar (trend) is not relevant when considering entries.
WA bar value: Not specified by default, Over Explosion and Deadzone: only enter trades when the WA bar value is over the Explosion and Deadzone lines; Not specified: the relation between the explosion/deadzone lines to the value of the WA bar will not be used to filter opening trades.
Sensitivity: 150 by default
Fast MA Type: SMA by default
Fast MA Length: 10 by default
Slow MA Type: SMA
Slow MA Length: 20 by default
Channel MA Type: EMA by default
BB Channel Length: 20 by default
BB Stdev Multiplier: 2 by default
Trend Filter:
Use long trend filter 1: false by default, Only enter long if price is above Long MA.
Show long trend filter 1: false by default, Plot the selected MA on the chart.
TF1 - MA Type: EMA by default
TF1 - MA Length: 120 by default
TF1 - MA Source: close by default
Use short trend filter 1: false by default, Only enter long if price is above Long MA.
Show short trend filter 1: false by default, Plot the selected MA on the chart.
TF2 - MA Type: EMA by default
TF2 - MA Length: 120 by default
TF2 - MA Source: close by default
Volume Filter:
Only enter trades where volume is higher then the volume-based MA: true by default, a set type of MA will be calculated with the volume as source, and set length
MA Type: RMA/SMMA by default
MA Length: 200 by default
Date Range Limiter:
Limit Between Dates: false by default
Start Date: Jan 01 2023 00:00:00 by default
End Date: Jun 24 2023 00:00:00 by default
Session Limiter:
Show session plots: false by default, show market sessions on chart: Sidney (red), Tokyo (orange), London (yellow), New York (green)
Use session limiter: false by default, if enabled, trades will only happen in the ticked sessions below.
Sidney session: false by default, session between: 15:00 - 00:00 (EST)
Tokyo session: false by default, session between: 19:00 - 04:00 (EST)
London session: false by default, session between: 03:00 - 11:00 (EST)
New York session: false by default, session between: 08:00 - 17:00 (EST)
Trading Time:
Limit Trading Time: true by default, tick this together with the options below to enable limiting based on day and time
Valid Trading Days Global: 123567 by default, if the Limit Trading Time is on, trades will only happen on days that are present in this field. If any of the not global Valid Trading Days is used, this field will be neglected. Values represent days: Sunday (1), Monday (2), ..., Friday (6), Saturday(7) To trade on all days use: 123457
(1) Valid Trading Days: false, 123456 by default, values represent days: Sunday (1), Monday (2), ..., Friday (6), Saturday(7) The script will trade on days that are present in this field. Please make sure that this field and also (1) Valid Trading Hours Between is checked
(1) Valid Trading Hours Between: false, 1800-2000 by default, hours between which the trades can happen. The time is always in the exchange's timezone
All other options are also disabled by default
PineConnector Automation:
Use PineConnector Automation: false by default, In order for the connection to MetaTrader to work, you will need do perform prerequisite steps, you can follow our full guide at our website, or refer to the official PineConnector Documentation. To set up PineConnector Automation on the TradingView side, you will need to do the following:
1. Fill out the License ID field with your PineConnector License ID;
2. Fill out the Risk (trading volume) with the desired volume to be traded in each trade (the meaning of this value depends on the EA settings in Metatrader. Follow the detailed guide for additional information);
3. After filling out the fields, you need to enable the 'Use PineConnector Automation' option (check the box in the strategy settings);
4. Check if the chart has updated and you can see the appropriate order comments on your chart;
5. Create an alert with the strategy selected as Condition, and the Message as {{strategy.order.comment}} (should be there by default);
6. Enable the Webhook URL in the Notifications section, set it as the official PineConnector webhook address and enjoy your connection with MetaTrader.
License ID: 60123456789 by default
Risk (trading volume): 1 by default
NOTE! Fine-tuning/re-optimization is highly recommended when using other asset/timeframe combinations.

D-BoT Alpha 'Short' SMA and RSI StrategyDostlar selamlar,
İşte son derece basit ama etkili ve hızlı, HTF de çok iyi sonuçlar veren bir strateji daha, hepinize bol kazançlar dilerim ...
Nedir, Nasıl Çalışır:
Strateji, iki ana girdiye dayanır: SMA ve RSI. SMA hesaplama aralığı 200 olarak, RSI ise 14 olarak ayarlanmıştır. Bu değerler, kullanıcı tercihlerine veya geriye dönük test sonuçlarına göre ayarlanabilir.
Strateji, iki koşul karşılandığında bir short sinyali oluşturur: RSI değeri, belirlenen bir giriş seviyesini (burada 51 olarak belirlenmiş) aşar ve kapanış fiyatı SMA değerinin altındadır.
Strateji, kısa pozisyonu üç durumda kapatır: Kapanış fiyatı, takip eden durdurma seviyesinden (pozisyon açıldığından beri en düşük kapanış olarak belirlenmiştir) büyükse, RSI değeri belirlenen bir durdurma seviyesini (bu durumda 54) aşarsa veya RSI değeri belirli bir kar al seviyesinin (bu durumda 32) altına düşerse.
Güçlü Yönleri:
İki farklı gösterge (SMA ve RSI) kullanımı, yalnızca birini kullanmaktan daha sağlam bir sinyal sağlayabilir.
Strateji, karları korumaya ve fiyat dalgalanmalarında kayıpları sınırlamaya yardımcı olabilecek bir iz süren durdurma seviyesi içerir.
Script oldukça anlaşılır ve değiştirmesi nispeten kolaydır.
Zayıf Yönleri:
Strateji, hacim, oynaklık veya daha geniş piyasa eğilimleri gibi diğer potansiyel önemli faktörleri göz önünde bulundurmaz.
RSI seviyeleri ve SMA süresi için belirli parametreler sabittir ve tüm piyasa koşulları veya zaman aralıkları için optimal olmayabilir.
Strateji oldukça basittir. Trade maliyetini (kayma veya komisyonlar gibi) hesaba katmaz, bu da trade performansını önemli ölçüde etkileyebilir.
Bu Stratejiyle Nasıl İşlem Yapılır:
Strateji, short işlemler için tasarlanmıştır. RSI, 51'in üzerine çıktığında ve kapanış fiyatı 200 periyotluk SMA'nın altında olduğunda işleme girer. RSI, 54'ün üzerine çıktığında veya 32'nin altına düştüğünde veya fiyat, pozisyon açıldığından beri en düşük kapanış fiyatının üzerine çıktığında işlemi kapatır.
Lütfen Dikkat, bu strateji veya herhangi bir strateji izole bir şekilde kullanılmamalıdır. Tüm bu çalışmalar eğitsel amaçlıdır. Yatırım tavsiyesi içermez.
This script defines a trading strategy based on Simple Moving Average (SMA) and the Relative Strength Index (RSI) indicators. Here's an overview of how it works, along with its strengths and weaknesses, and how to trade using this strategy:
How it works:
The strategy involves two key inputs: SMA and RSI. The SMA length is set to 200, and the RSI length is set to 14. These values can be adjusted based on user preferences or back-testing results.
The strategy generates a short signal when two conditions are met: The RSI value crosses over a defined entry level (set at 51 here), and the closing price is below the SMA value.
When a short signal is generated, the strategy opens a short position.
The strategy closes the short position under three conditions: If the close price is greater than the trailing stop (which is set as the lowest close since the position opened), if the RSI value exceeds a defined stop level (54 in this case), or if the RSI value drops below a certain take-profit level (32 in this case).
Strengths:
The use of two different indicators (SMA and RSI) can provide a more robust signal than using just one.
The strategy includes a trailing stop, which can help to protect profits and limit losses as the price fluctuates.
The script is straightforward and relatively easy to understand and modify.
Weaknesses:
The strategy doesn't consider other potentially important factors, such as volume, volatility, or broader market trends.
The specific parameters for the RSI levels and SMA length are hard-coded, and may not be optimal for all market conditions or timeframes.
The strategy is very simplistic. It doesn't take into account the cost of trading (like slippage or commissions), which can significantly impact trading performance.
How to trade with this strategy:
The strategy is designed for short trades. It enters a trade when the RSI crosses above 51 and the closing price is below the 200-period SMA. It will exit the trade when the RSI goes above 54 or falls below 32, or when the price rises above the lowest closing price since the position was opened.
Please note, this strategy or any strategy should not be used in isolation. It's important to consider other aspects of trading such as risk management, capital allocation, and combining different strategies to diversify. Back-testing the strategy on historical data and demo trading before going live is also a recommended practice.

D-Bot Alpha RSI Breakout StrategyHello dear Traders,
Here is a simple yet effective strategy to use, for best profit higher time frame, such as daily.
Structure of the code
The code defines inputs for SMA (simple moving average) length, RSI (relative strength index) length, RSI entry level, RSI stop loss level, and RSI take profit level. The default values of these variables can be customized as per the user's preferences.
The script calculates SMA and RSI based on the input parameters and the closing price of the asset.
Trading logic
This strategy allows the placement of a long position when:
The RSI crosses above the RSI entry level and
The close price is above the SMA value.
After entering a long position, it applies a trailing stop mechanism. The stop price is updated to the close price if the close price is lower than the last close price.
The script closes the long position when:
RSI falls below the stop loss level.
RSI reaches or exceeds the take profit level.
If the trailing stop is activated (once RSI reaches or exceeds the take profit level), the closing price falls below the trailing stop level.
Strengths
The strategy includes mechanisms for entering a position, taking profit, and stopping losses, which are fundamental aspects of a trading strategy.
It applies a trailing stop mechanism that allows to capture further gains if the price keeps increasing while protecting from losses if the price starts to decrease.
Weaknesses
This strategy only contemplates long positions. Depending on the market situation, the strategy may miss opportunities for short selling when the market is on a downward trend.
The choice of the fixed RSI entry, stop loss, and take profit levels may not be ideal for all market conditions or assets. It might benefit from a more adaptive mechanism that adjusts these levels according to market volatility or trend.
The strategy doesn't factor in trading costs (such as spread or commission), which could have a significant impact on the net profit, especially if the user is trading with a high frequency or in a low liquidity market.
How to trade with this strategy
Given these parameters and the strategy outlined by the code, the trader would enter a long position when the RSI crosses above the RSI entry level (default 34) and the closing price is above the SMA value (SMA calculated with default period of 200). The trader would exit the position when either the RSI falls below the RSI stop loss level (default 30), or RSI rises above the RSI take profit level (default 50), or when the trailing stop is hit.
Remember "The strategies I have prepared are entirely for educational purposes and should not be considered as investment advice. Support your trades using other tools. Wishing everyone profitable trades..."

D-BoT Alpha ReversalsHello traders, today I'm going to share with you a strategy that I use very frequently. I wanted to share this strategy that I use in my manual trades by translating it into code. I'm sharing it with you with completely open source code.
RSI of ROC: The indicator initially calculates RSI (Relative Strength Index) on ROC (Rate of Change). This is a method that tracks the rate of price change (ROC) over a certain period and applies it to the RSI calculation.
Adaptive RSI: The code then calculates the RSI for all periods between the minimum and maximum RSI lengths. It takes the average of these calculations and names it as avg_rsi66. In addition, it checks whether each RSI value exceeds the determined overbought and oversold limits.
Signal Triggers: If both RSI of ROC and avg_rsi66 are above or below the specified overbought or oversold levels and the difference between these two values is less than the specified threshold value (Extremities Sensitivity), a signal is triggered. In addition, the color of the bar is also checked: An overbought (sell) signal is triggered for a red bar and an oversold (buy) signal is triggered for a green bar.
Signal Visualization: Signals are shown on the chart at appropriate places with "Sell" or "Buy" shapes. Also, each of these conditions is defined as an alert condition.
The general purpose of this indicator is to determine the turning points of the market. Overbought and oversold signals are based on the idea that the price may turn from these areas. That is, a "Sell" signal indicates a turning point where the price may start to fall, while a "Buy" signal indicates a turning point where the price may start to rise.
These types of indicators usually have some weak points:
False Signals: Like any kind of technical analysis indicator, this indicator can also give false signals. That is, you may get a "Buy" or "Sell" signal but the price may not move in the expected direction.
Market Conditions: This indicator may perform better under certain market conditions. For example, a trend-following indicator usually works well in trending markets, but can be misleading in range-bound markets. This indicator too can perform better or worse in a particular market situation.
Parameter Selection: The choice of the parameters of the indicator (ROC and RSI lengths, overbought/oversold levels, etc.) can significantly affect the quality of the indicator signals. Parameters should be optimized for various assets and time frames.
In conclusion, it would be better to use this indicator not as a standalone trading system, but in conjunction with other technical analysis tools or fundamental analysis. Also, it is always beneficial to test a new trading strategy on past data or on a demo account before trading with real money."
Stay tuned for more of my original strategies :)
Happy trading...

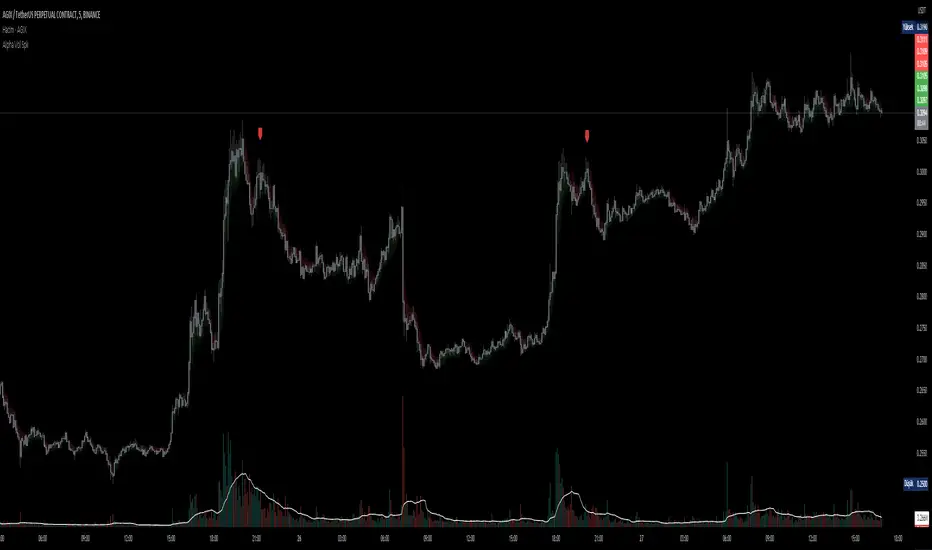
D-BoT Alpha Volume SpikeHello traders, Let me explain the code and provide an example of how to trade using this indicator.
The code you provided is a Pine Script indicator that combines multiple technical indicators, such as Supertrend, ADX, RSI, and MFI, to generate buy and sell signals. Here's a breakdown of the code:
User Settings:
The user can adjust parameters like overbought_limit, oversold_limit, volume_multiplier, volume_ma_length, volume_spike_multiple, lookback_period, and use_extremities_confirmation according to their preference.
Calculate Supertrend:
The Supertrend indicator is calculated using three different ATR lengths (supertrend_atr_period1, supertrend_atr_period2, supertrend_atr_period3) and corresponding factors (supertrend_factor1, supertrend_factor2, supertrend_factor3).
The supertrend_value1, supertrend_value2, and supertrend_value3 represent the Supertrend values, while trend_direction1, trend_direction2, and trend_direction3 indicate the trend direction (negative for downtrend, positive for uptrend).
Candle calculations:
The high and low values are checked to identify bullish and bearish candles based on specific conditions.
Volume Spikes:
Volume spikes are detected by comparing the current volume with a median volume over a specified lookback period.
If the volume exceeds a certain multiple of the median volume and the DI+ value is greater than the DI- value, an "up" signal is generated. Similarly, if the DI- value is greater than the DI+ value, a "down" signal is generated.
Additional Filters (RSI and MFI):
Relative Strength Index (RSI) and Money Flow Index (MFI) are used as additional filters.
The RSI and MFI parameters can be adjusted according to the user's preference.
The signals generated by the volume spikes are filtered based on RSI and MFI conditions.
Plotting:
The indicator plots shapes (triangles) to represent buy and sell signals.
The Supertrend lines are plotted using different colors and transparency levels based on the distance from the current price.
The "bodyMiddle" plot is used for filling the area between the Supertrend lines.
Example Trade Scenario:
Let's consider an example trade scenario using this indicator:
When the indicator generates an "up" signal (trendBuy = true), indicating a potential bullish trend, and all the confirmation conditions (RSI, MFI, Supertrend) are met, you can consider opening a long position.
Conversely, when the indicator generates a "down" signal (trendSell = true), indicating a potential bearish trend, and all the confirmation conditions are met, you can consider opening a short position.
Remember, this is just an example, and it's crucial to perform thorough analysis and consider other factors before making trading decisions. It's recommended to backtest the strategy, assess risk management, and apply appropriate position sizing techniques.
Please note that the code provided is a simplified version, and there might be additional factors and considerations specific to your trading strategy that are not included in this code. *******"I have also reviewed the following indicators, and the volume calculation approaches of my friends have been very helpful in creating this indicator: "Volume Spikes " © tradeforopp and "Volume Spikes & Growing Volume Signals With Alerts & Scanner" © FriendOfTheTrend."*******
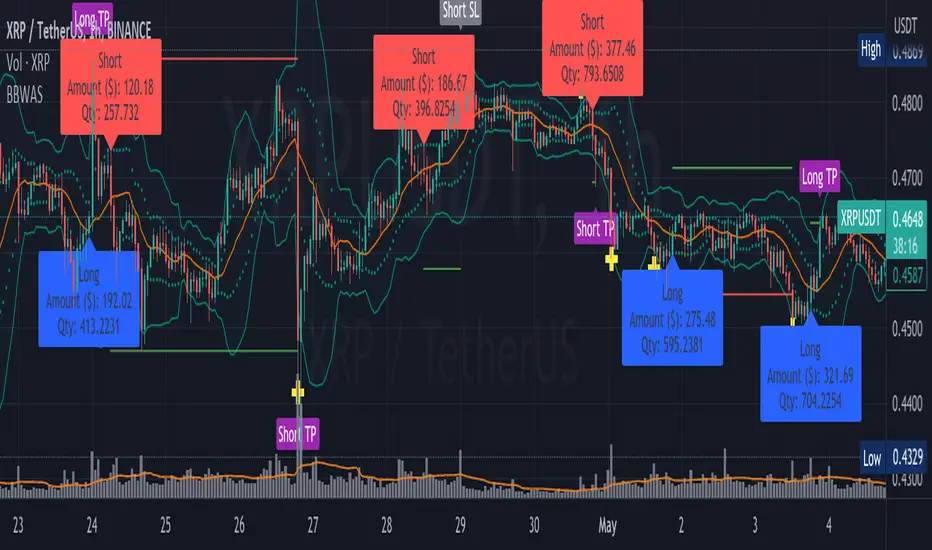
BBWAS Enhanced with Webhook Alerts and Money ManagementThe Enhanced BBWAS Indicator is a powerful tool designed to identify breakouts in the price of a security or asset. It utilizes Bollinger Bands, which consist of three lines: the upper band, the lower band, and the middle band (or basis). These bands help define the expected price range within which the asset is likely to fluctuate.
When the price breaks above the upper band or below the lower band, it indicates a potential breakout. A bullish breakout occurs when the price closes above the upper band, while a bearish breakout occurs when the price closes below the lower band.
In this enhanced version of the indicator, several new features have been added to provide more flexibility and functionality:
Webhook Alerts: Traders now have the ability to configure webhook alerts to trigger a bot or any external system. This allows for timely notifications when a breakout occurs, enabling automated actions or manual intervention as desired.
Multiple Moving Average Types: The indicator now supports different types of moving averages for increased customization. Traders can choose from popular moving average types such as Simple Moving Average (SMA), Exponential Moving Average (EMA) and Weighted Moving Average (WMA). This enables users to experiment and find the moving average type that best suits their trading strategy.
Money Management: To assist traders in managing risk, a money management feature has been incorporated into the indicator. It calculates the optimal position size or number of units to purchase for each trade, considering the desired risk per trade. By specifying a maximum risk per trade, traders can ensure that their position sizes are adjusted accordingly, helping to maintain risk control in their trading activities.
Dear traders, while we strive to provide you with the best trading tools and resources, we want to remind you to exercise caution and diligence in your investing decisions.
It is important to always do your own research and analysis before making any trades. Remember, the responsibility for your investments ultimately lies with you.
Happy trading!
Premium MTF Layered RSI - Bitcoin Bot [wbburgin]This the premium version of my MTF Layered RSI strategy, which improves significantly on the original strategy (publicly available on my profile). Improvements are below. This strategy will also appear as an overlay on your chart. It is completely non-repainting.
The MTF Layered RSI strategy uses the current timeframe and two configurable higher timeframes to enter a long position when Bitcoin is oversold on all three timeframes, and exit the long position when Bitcoin is overbought on the current timeframe. This hedges against situations where the RSI on higher timeframes never reaches the overbought level and we are left "holding the bag" so to speak with the classic "enter long at oversold and enter short at overbought" strategy.
IMPORTANT: This strategy does not work on ranges. It will work on all timeframes and assets, but does not work on ranges (Renko blocks and some other advanced types of charts).
********** My Background
I am an investor, trader, and entrepreneur with 10 years of cryptocurrency and equity trading experience and founder of two fintech startups. I am a graduate of a prestigious university in the United States and carry broad and inclusive interests in mathematical finance, computer science, machine learning / artificial intelligence, as well as other fields.
**********
Improvements over the original MTF RSI strategy include:
Filters for Uptrends and Downtrends → The Premium RSI strategy will adjust its buy and sell thresholds depending on whether the instrument is trending. This means that, in uptrends, the Premium strategy will buy more frequently, bringing in potentially greater profit, and in downtrends, the strategy will stop buying altogether. These filters and dynamic buy/sell thresholds have made this strategy more profitable in my backtesting across random timeframes, but I cannot guarantee that the strategy will be profitable for you on the default settings. To that end, I have enabled a number of different configurations that you can change in the settings of the strategy.
Stop Loss / Take Profit Calculation Per Tick → Stop loss and take profit are now both enabled in the script and each has their own alerts. You can specify what type of stop loss or take profit you want: percentage or ATR. If you have alerts configured, you will be alerted mid-bar, instead of at close. This helps prevent loss from abrupt falls in price between closing price and next bar open.
Customizable Alert Messages In-Strategy → In the settings, there will be text boxes where you can create your own alerts. All you will need to do is create an alert in the alert panel on Tradingview and leave the message box blank - if you fill out the alert boxes in the settings, these will automatically populate into your alerts. There are in total eight different customizable alerts messages: Entry, Exit, Stop loss, and Take profit alerts for both Long and Short sides. If you disable stop loss and/or take profit, these alerts will also be disabled. Similarly, if you disable shorts, all short alerts will be disabled.
**********
Display
Configuring Stop Loss or Take Profit will make their corresponding displays appear.
Separately from the trading boxes, background colors (green, red) signify extended uptrends and downtrends, respectively.
Configuring Alerts
In TradingView desktop, go to the ‘Alerts’ tab on the right panel. Click the “+” button to create a new alert. Select this strategy for the condition and one of the two options that includes alert() function calls. Name the alert what you wish and clear the default message, because your text in the settings will replace this message.
Now that the alert is configured, you can go to the settings of the strategy and fill in your chosen text for the specific alert condition. You will need to check “Long and Short” in the “Trade Direction” setting in order for any Short Alerts to become active. Similarly, you will need to check “Enable Stop Loss” for stop loss alerts to become active and “Enable Take Profit” for take profit alerts to become active.
**********
Disclaimer
Copyright by wbburgin.
The information contained in my Scripts/Indicators/Algorithms does not constitute financial advice or a solicitation to buy or sell any securities of any type. I will not accept liability for any loss or damage, including without limitation any loss of profit, which may arise directly or indirectly from the use of or reliance on such information.
All investments involve risk, and the past performance of a security, industry, sector, market, financial product, trading strategy, backtest, or individual's trading does not guarantee future results or returns. Investors are fully responsible for any investment decisions they make. Such decisions should be based solely on an evaluation of their financial circumstances, investment objectives, risk tolerance, and liquidity needs.
**********
Notes on the Strategy Performance below: This is 3% of equity per trade, with a pyramiding number of 3. I did not include fees because Binance US on Bitcoin/USD does not charge fees on the instrument; however, I heavily encourage you to include fees in your backtesting if you use a different brokerage. To mitigate fees, this strategy is designed with a high average %/trade. If your current fees are greater than the strategy's average %/trade, I encourage you to choose a higher RSI period, such as 14 or 28, which will result in less trades but potentially a higher %/trade.

Bollinger Bands %B (ValueRay)One of the key features of this BB%B is its ability to highlight overbought and oversold conditions. This allows you to make informed decisions on when to enter and exit a trade, helping you maximize your profits and minimize your losses.
- Bollinger Bands %B with the ability to change to a different Time Frame.(Defaults to current Chart Time Frame).
- Ability To Turn On/Off Background Highlighting if BB %B is Above/Below 0 / 1 thresholds.
- Ability To Turn On/Off Background Highlighting when BB %B Crosses back above/unser 0/1 thresholds.
---
My personal recommandation use: combine with CM_Ultimate RSI Multi Time Frame (ChrisMoody) and have solid oversold/overbought levels, when hes RSI and my BB %B are bot red/green

Risk Reward Calculator [lovealgotrading]
OVERVIEW:
This Risk Reward Calculator strategy can help you maximize your RR value with help of algorithmic trading.
INDICATOR:
I wanted to setup my trades more easier with this indicator, I didn't want to calculate everytime before orders, with help this indicator we can calculate R:R value, avarage price, stoploss price, take-profit price, order prices, all position cost and more ...
Our strategy is a risk revard calculation indicator that is made easy to use by using visualized lines and panels, and also has algorithmic trading support.
With the help of this indicator, we can quickly and easily calculate our risk reward values and enter the positions.
If we want to ensure that our balance grows regularly while trading in the stock market, we need to manage the risks and rewards otherwise we may fall below our initial balance at the end of the day, even if we seem to be winning.
What is the Risk-Reward value ?
This value is a value that shows how many times the amount of risk we take when entering the position is successful, we will earn.
- For example, you risked $100 while entering the trade, so if your trade stops, you will lose 100 $.
Your Risk-Reward(RR) value is 2 means that if your position is successful, you will have 200 $ in your pocket.
A trader's success is determined by the amount of R he earns monthly or yearly, not how much money he makes.
What is different in this indicator ?
I want to say thank you to © EvoCrypto. His Calculator (weighted) – evo indicator helped me when I was developed my indicator.
I want to explain what I have improved:
1-In this strategy, we can determine the time period in which we want to open our positions.
2-We can open a maximum of 4 positions in the same direction and close our positions at a single level. StopLoss or TakeProfit
3-This indicator, which works in the form of a strategy, shows where our positions have been opened or closed. With the help of this, it helps us to determine our strategy in our future positions more accurately.
4-The most important improvement is that we do not miss our positions with the help of alarms (WEB HOOK). if we want, we receive by quickly connecting all these positions to our robot, the software can enter and exit the position while we are busy.
IMPLEMENTATION DETAILS – SETTINGS:
1 - We can set the start and end dates of the positions we will take.
2- We can set our take profit, stoploss levels.
3- If your trade is stopped, we can determine the amount of the trade that we will lose.
4- We can adjust our entry levels to positions and our position sizes at entry levels.
(Sum of positions weight must be 100%)
5- We can receive our positions even if we are busy with the help of algorithmic trading. For this, we must paste our Jshon codes into the fields specified in the settings panel.
6- Finally, we can change the settings we want and don't want to have in our visual elements.
Let's make a LONG side example together
We have determined our positions to enter stoploss, take profit and long positions. We did not forget to set the start time of our strategy
Our strategy appear on the graph as follows.
Our strategy has calculated the total position size, our R-R value, the distance of the current price to the stop and take profit levels, in short, a lot of things we could look visually.
Notes:
If you're going to connect this bot to an automatic Long or Short direction,
Don’t forget! you need to Webhook URL,
Don’t miss paste this code to your message window {{strategy.order.alert_message}}
ALSO:
If you have any ideas what to add to my work to add more sources or make calculations cooler, feel free to write me.

Spaghetti by RainbowLabsWhen I started trading, very few people gave me a hand or even a small piece of advice. One of them was @btc_charlie. From Charlie, I first saw the spaghetti chart, and he explained to me how it was useful in identifying which coin made the most sense to trade at a specific time.
In practice, it worked like this: in the "add" section, you add all the pairs you want and overlap them on the chart, creating the spaghetti chart. Although it worked, and still works, this way, I wondered if it would be better to write an indicator that does the same thing, maybe less invasive on the chart, that you can call as many times as you want and in different versions. In short, I tried to recreate the same thing but potentially better, let's see if I succeeded.
Introducing Spaghetti chart by RainbowLabs:
This indicator takes 20 different pairs as user input and works with any pair on any exchange provided the name is spelled correctly. In the settings, there are four columns: the first for the exchange, the second for the ticker, the third for the base pair, and lastly, the color. Again, it works with any pair on any exchange, but if you put something that does not exist or is misspelled, it will cause the script to error.
The second thing to do is to set when our spaghetti will be reset. By default, it resets every hour, but you can change it to any preferred timeframe in the menu, keeping in mind that we will write the timeframe in minutes, not alphanumeric. For example, 4h will not be four hours, but you will have to write 240.
In the settings, we can also change the position and size of the table.
How it works:
All pairs are reset when the timeframe defined by the user in the settings changes. The script then calculates the percentage difference from that moment onwards for each pair at the closing of the candle of the timeframe we are in. For example: by default, the timeframe resets every hour, so we will use it on one minute. It does not make sense on larger timeframes, and you will have to increase the reset timeframe.
How to use it:
Risk on\off BTC vs alts
As Charlie says in his tweet: "should I be risk on or off?" for SIX:ALTS rule might be ">70% of Alts recovering after a dip."
Identify a dip on bitcoin and compare what happens immediately after. If more than 70% of alts gain more than BTC, it may be better to remain positioned in alts. When the opposite happens, it is better to stay on BTC or stable.
Sell-off, Rally
During a significant sell-off or rally, it is important to analyze which coins were performing better or worse in the immediate past. It is statistically more profitable to trade those pairs that were over-performing, positively or negatively, just before the event.
Arbitrage and Triangular Arbitrage.
While it may be difficult to find large arbitrage opportunities in current market conditions, we can use tools to identify the best price of the same pair on multiple exchanges and compare it with one or multiple pairs on other exchanges. Having a comprehensive view of the market can be useful for anyone who is not using advanced trading bots to find arbitrage opportunities.
Quick Screener
You can add multiple spaghetti indicators to a single chart, and with the paid version of TradingView, you can use multiple layouts to plot as many coins on as many exchanges as you want. In the picture, you can see 240 pairs on four different exchanges all together. This feature allows you to quickly screen for potential trading opportunities and identify trends across multiple pairs and exchanges.
Known issues:
When the currency exchange rate is equal to 0.0000, the plotted line may not be visible.

MTF Diagonally Layered RSI - 1 minute Bitcoin Bot [wbburgin]This is a NON-REPAINTING multi-timeframe RSI strategy (long-only) that enters a trade only when two higher timeframes are oversold. I wrote it on BTC/USD for 1min, but the logic should work on other assets as well. It is diagonally layered to be profitable for when the asset is in a downtrend.
Diagonal layering refers to entry and exit conditions spread across different timeframes. Normally, indicators can become unprofitable because in downtrends, the overbought zones of the current timeframe are not reached. Rather, the overbought zones of the faster timeframes are reached first, and then a selloff occurs. Diagonally-layered strategies mitigate this by selling diagonally, that is, selling once the faster timeframe reaches overbought and buying once the slower timeframe reaches oversold.
Thus this strategy is diagonally layered down . I may create a separate script that alternates between diagonal-up and diagonal-down based off of overall trend, as in extended trend periods up this indicator may not flash as frequently. This can be visualized in a time series x timeframe chart as an "X" shape. Something to consider...
Let me know if you like this strategy. Feel free to alter the pyramiding entries, initial capital, and entry size, as well as commission regime. My strategies are designed to maximize average profit instead of flashing super frequently, as the fees will eat you up. Additionally, at the time of publication, all of my strategy scripts are intended to have profitable Sharpe and Sortino ratios.
Timeframes, RSI period, and oversold/overbought bounds are configurable.

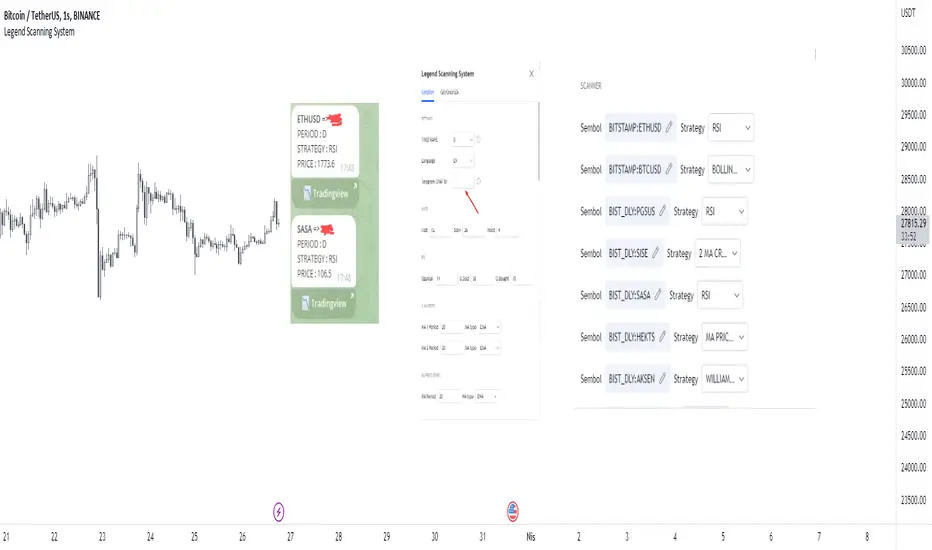
Legend Scanning System - Telegram SenderHello traders, I'm Only Fibonacci.
This is what i posted, not really an indicator or strategy. An alarm mechanism.
What does it do?
First, you select a period during which the vehicle will scan.
Then, with this system, you adjust the settings of the strategies installed on our vehicle. Then you select forty symbols and specify which strategy you want the symbols to be scanned.
We come to the alarm setting screen, select the alarm, and enter your telegram bot's token-hosted message request link from the webhook section. You should contact me for assistance in these matters.
You can see most of the settings in the image below.
You can see most of the settings in the image below.
Important note: The period of the open graph must be less than the scanned period. Otherwise, the results may be erroneous.
Strategies will be constantly updated and become more customizable.
Proper use of this tool gives you:
It serves to scan different strategies on forty symbols different instruments of your choice. And not only that, you will receive these results in telegram.
The strategies loaded in these scans consist of the strategies in the techniques section in tradingview.
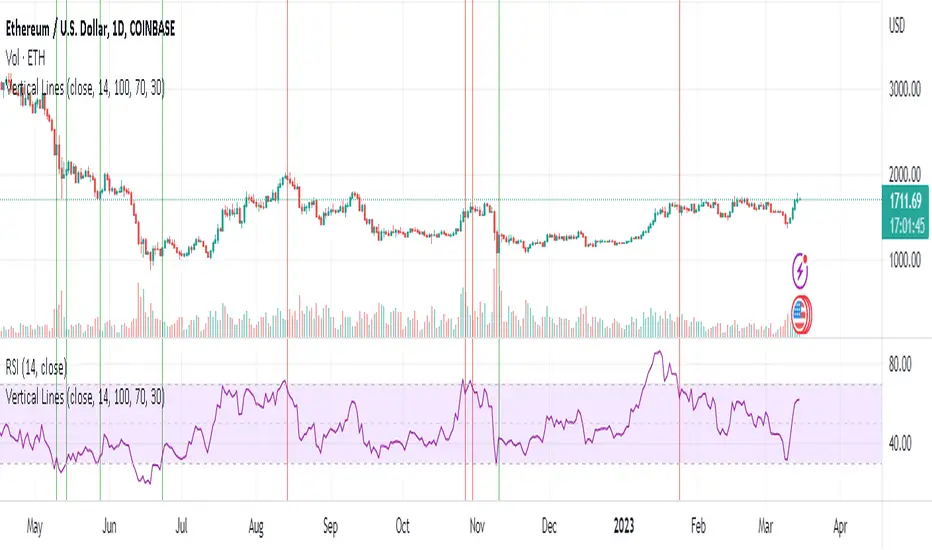
Vertical Lines 2A vertical line plotting function is missing in Pinescript. This is another method to plot vertical line on a chart, and an improvement on my previous script "vertical lines" .
The script hacks the plotcandle function to display just the wicks without the body. This hack simulates a vertical line. The body of the candle is non-existing since the open and close are the same and its color is set to null. The wicks are abutting resulting in a continuous vertical line.
Drawbacks include inability to set width and transparency of the lines. The plotcandle function does not allow setting the width and transparency of the wicks. This feature would be desirable.
The crossing of the RSI of overbought and undersold zones is used as an example in this published script. Any indicator can be used and this script can be executed on any other indicator by using "add indicator" on the desired indicator, and selecting the indicator as the source. I added crossover lines on the plotted RSI as an example.
//////////////////////////////////////////////////////Breakdown of the script////////////////////////////////////////////////////////
The src input determines which price data is used for the highest value calculation. By default, it is set to the close price.
The length input determines the length of the RSI calculation. By default, it is set to 14.
The mult input determines the multiplier of the highest value that is used to determine the height of the vertical lines. By default, it is set to 100%, meaning the lines will reach the highest value in the dataset.
The top and bot inputs determine the overbought and oversold levels for the RSI. By default, they are set to 70 and 30, respectively.
The current_rsi and previous_rsi variables calculate the RSI values for the current bar and the previous bar, respectively.
The hi_value variable finds the highest value in the dataset, and the hi variable calculates the height of the vertical lines based on the highest value and the user-defined multiplier. The lo variable calculates the distance between the highest value and the current price data.
The uph, dnh, upl, and dnl variables determine the height and low of the vertical lines for when the RSI crosses overbought or oversold levels.
The if statements check if the RSI has crossed overbought or oversold levels and set the uph, dnh, upl, and dnl variables accordingly.
Finally, the plotcandle() function is used to plot the vertical lines on the chart. The open and close values are set to the src input, and the high and low values are set to the uph, dnh, upl, and dnl variables. The bordercolor argument is set to na to hide the borders of the lines, and the wickcolor argument is set to green or red, depending on whether the line is an overbought or oversold crossover.
/////////////////////////////////////////////////////////////////////////////////////////////////////////////////////////////////////////