ProfitTrailerV2 RSI+BB+SRSI+Stochastic Oscillator Signal+AlertsThis is an all-in-one indicator with alerts that most people call signals and it's designed for Cryptocurrency leverage trading. This indicator features, the most popularly used indicators in technical analysis and are the basic technical analysis indicators any successful trader should master before going into more advanced technical analysis tool. The ProfitTrailerV2 RSI+BB+SRSI+Stochastic Oscillator Signal+Alerts features the Bollinger Bands, Relative Strength Index, Stochastic RSI and Stochastic Oscillator, and it was designed for use with ProfitTrailer V2 and can also be used with all other trading bots or on its own as a powerful market leveraging and trading indicator using alerts.
The ProfitTrailerV2 RSI+BB+SRSI+Stochastic Oscillator Signal+Alerts can be customized to any trader specific trading patterns and offers the ability to choose a combination of indicators from the featured ones to use. With the Buy and Sell Signal feature, trading on any cryptocurrency exchange can be automated and with the alerts feature, the ProfitTrailerV2 RSI+BB+SRSI+Stochastic Oscillator Signal+Alerts will automated buying and selling signals for any crypto trading bot but I'll always recommend using for making buys only when using with any bot. This indicator/script can be used with any base pair; BTC, ETH, and USD or USDT.
As mentioned above, all four indicators can be combined to find a very safe and secure buy and profitable sell signals, which maximizes your profit margins and overall earnings over time. Also, 2 or 3 could be combined as well, depending on the traders knowledge on how to use each indicator independently to find its best settings. My recommendation would be to test all independently and or together with very little capital to find what works best for you. I recommend this because the cryptocurrency market in a very volatile market and unpredictable, some combination of indicators would work for some certain coin pairs and not all, while others would work better with a different setting and a particular coin pair.
As with all script use at your own risk and only trade what you can afford to lose, while this indicator isn't designed to lose you money and I will not be held liable for any losses due to misuse. I am also not a financial advisor and the ProfitTrailerV2 RSI+BB+SRSI+Stochastic Oscillator Signal+Alerts will be made available soon as it's still undergoing rigorous testing.
ค้นหาในสคริปต์สำหรับ "bot"

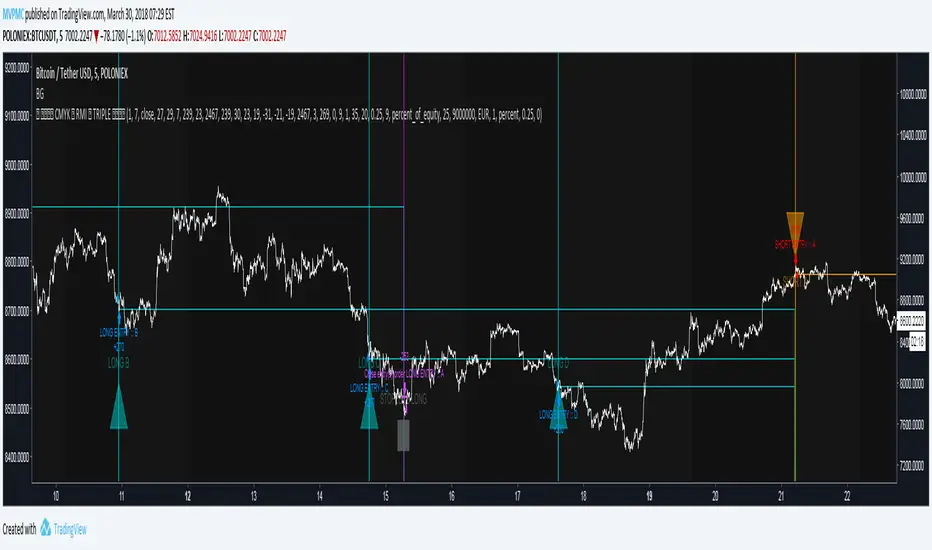
CMYK RMI TRIPLE Automated strategy▼ This is the strategy version of the script.
◊ Introduction
This script makes use of three RMI 's, that indicate Overbought/Oversold on different timescales that correspond with Frequency’s that move the market.
◊ Origin
The Relative Momentum Index was developed by Roger Altman and was introduced in his article in the February, 1993 issue of Technical Analysis of Stocks & Commodities magazine.
While RSI counts up and down ticks from close to close, the Relative Momentum Index counts up and down ticks from the close relative to a close x number of days ago.
This results in an RSI that is smoother, and has another setting for fine tuning results.
This bot originated out of Project XIAM , an investigative script that outlined my approach towards Automated Trading Strategies.
Are you interested in writing bots yourself ? check out the beta version of this script.
It has many bugs, but also most of the Skeleton.
◊ Usage
This script is intended for Automated Trading with AUTOVIEW or TVAUTOTRADER , on the 1 minute chart.
◊ Features Summary
Overlay Mode
Indicator Mode
Three RMI's
Trend adjustment
Pyramiding
Ignore first entries
Take Profit
Stop Loss
Interval between Entries
Multiring Fix
Alert signal Seperation
◊ Community
Wanna try this script out ? need help resolving a problem ?
CMYK :: discord.gg
AUTOVIEW :: discordapp.com
TRADINGVIEW UNOFFICIAL :: discord.gg
◊ Setting up Autoview Alerts
Use the study version of this script, To set up The Alerts Autoview Picks up on.
The Signals to work with are :
Open 1 Long
Use this to open one Long Position.
With quantity being : /
Once per bar
Being larger than 0
Comment example : e=exchange b=long q=amount t=market
Open 1 Short
Use this to open one Short Position.
With quantity being : /
Once per bar
Being larger than 0
Comment example : e=exchange b=short q=amount t=market
Close1 Position
Use this to Close The amount of one Open Position.
With quantity* being : /
Once per bar
Being larger than 0
Comment example : e=exchange c=position q=amount t=market
*Beware when using a percental % quantity, instead of an absolute quantity.
Percental Quantities are based on the , Not
And will change in absolute value relative to the amount of open trades.
Close All positions
Use this to Close All Open Positions.
With quantity being :
Once per bar
Being larger than 0
Comment example : e=exchange c=position t=market
For the specific Syntax used in the comment of the alert, visit Autoview .
◊ Setting up TVAutotrader
Use the strategy version of this script, And load it into TVAT .
◊ Backtesting
Use the strategy version of this script for backtesting.
◊ Contact
Wanna try this script out ? need help resolving a problem ?
CMYK :: discord.gg
PT Magic Triggers So its me again. I have decided to create Trend Trigger Script for PT Magic addon for a trading bot Profit Trailer. If you do not own this bot and Addon the following explanation will not help you.
For each Trend you define number of minutes and it then calculates the percentage change between the close price now and X candles before.
Same calculation is for all 6 Triggers i beleive that is all you need :)
Hope it helps you all.
LTC: LYHj4WDN7BPu5294cSpqK3SgWSWdDX56Qt
BTC: 1NPVzeDSsenaCS9QdPro877hkMk93nRLcD

MACD, backtest 2015+ only, cut in half and doubledThis is only a slight modification to the existing "MACD Strategy" strategy plugin!
found the default MACD strategy to be lacking, although impressive for its simplicity. I added "year>2014" to the IF buy/sell conditions so it will only backtest from 2015 and beyond ** .
I also had a problem with the standard MACD trading late, per se. To that end I modified the inputs for fast/slow/signal to double. Example: my defaults are 10, 21, 10 so I put 20, 42, 20 in. This has the effect of making a 30min interval the same as 1 hour at 10,21,10. So if you want to backtest at 4hr, you would set your time interval to 2hr on the main chart. This is a handy way to make shorter time periods more useful even regardless of strategy/testing, since you can view 15min with alot less noise but a better response.
Used on BTCCNY OKcoin, with the chart set at 45 min (so really 90min in the strategy) this gave me a percent profitable of 42% and a profit factor of 1.998 on 189 trades.
Personally, I like to set the length/signals to 30,63,30. Meaning you need to triple the time, it allows for much better use of shorter time periods and the backtests are remarkably profitable. (i.e. 15min chart view = 45min on script, 30min= 1.5hr on script)
** If you want more specific time periods you need to try plugging in different bar values: replace "year" with "n" and "2014" with "5500". The bars are based on unix time I believe so you will need to play around with the number for n, with n being the numbers of bars.

AngleAura UTAngleAura UT is an advanced trading indicator built on top of the classic UT Bot concept, enhanced with modern risk‑management logic, next‑candle execution, and a clean visual interface.
The script uses a modified algorithm based on:
- ATR‑adjusted trailing levels
- EMA crossover logic
- Dynamic trend switching
This helps identify trend reversals with minimal noise.

BTC - Sentiment (Posts weighted) LSMABTC - Sentiment (Posts Weighted) LSMA | RM
Concept
In the current 2026 market regime, Bitcoin has transitioned into a mature institutional asset. However, retail "Social Liquidity" remains the primary driver of local volatility and blow-off tops. This script serves as a deterministic proxy for crowd conviction, utilizing the LUNARCRUSH:BTC_SENTIMENT feed to identify when social hype has decoupled from fundamental value.
Data Source: LunarCrush Integration
This model utilizes the native LunarCrush data prefix. Unlike simple "mention counts," the BTC_SENTIMENT metric is a percentage-based value (0-100%) representing the "Sentiment of positive posts weighted by interactions."
• Interactions vs. Volume: By weighting sentiment by interactions (likes, shares, comments), the data filters out bot-driven "spam" and focuses on what real participants are actually engaging with.
• Meaning of the Value: 100% indicates that every single interaction-weighted post is positive; 0% indicates total negativity. Historically, BTC sentiment rarely drops below 60% or stays above 90% for long, creating a predictable mean-reverting corridor.
Technical Architecture
• The LSMA Denoising Engine Raw social data is inherently "jittery." To extract a tradable signal, we apply a Least Squares Moving Average (LSMA) with a 28-day lookback.
• Mathematical Advantage: Unlike a Simple Moving Average (SMA), the LSMA calculates a linear regression line for each period to find the "best fit." This allows the indicator to track the velocity of sentiment shifts with significantly less lag, which is critical for identifying "Social Exhaustion" before a price reversal occurs.
• The Social Heat Index (SHI) Calculation: To align this data with the broader Rob Maths ecosystem, we normalize the LSMA output into a standardized 0–10 score using a Linear Feature Scaling (Min-Max) formula: SHI = ((Current LSMA - 65) / 25) * 10 ; This formula treats 65% as the "Floor" (Apathy) and 90% as the "Ceiling" (Hysteria). This 0–10 scale allows for immediate comparison against other institutional risk metrics.
Regime Audits & Usage
• Accumulation (Blue Zone / <72.5%): Social Despair. Retail interest is at a mathematical minimum. Historically, these periods of "Social Apathy" coincide with major local bottoms as institutional "Smart Money" absorbs the lack of retail demand.
• Neutral Zone (Grey): Sustainable growth. Sentiment is within the normal distribution.
• Distribution (Red Zone / >82.5%): Overheated. The crowd is in a state of maximum FOMO. When the SHI exceeds 8.5/10, the risk of a "Liquidity Flush" increases significantly.
Visual Scaling
To ensure the curve is readable, the indicator pane is hard-locked to a 65–90 scale. This prevents the "flat line" effect often seen in 0-100 oscillators and highlights the subtle divergences that occur at cycle peaks.
Disclaimer
Past performance does not guarantee future results. Social metrics are alternative data points and should be used in conjunction with price action and risk management. This is a mathematical model, not financial advice.
Tags
Rob Maths, Rob_Maths, robmaths, Bitcoin, Sentiment, LunarCrush, Quant, LSMA, OnChain, Social Liquidity

Empyrean - Strat 1minGood for bot trading. 1min TF, with 15min confluence. Setting are here
22
Min Pivot Size x ATR
0.1
Enable TF1
Resolution TF1
15
Use SMA
SmaLen
23
ADX Length
21
ADX Threshold
20
ATR Baseline Length
2
TP * ATR
5.5
SL * ATR
1.5/3

ETH Scalping Bot V2 (Aggressive)⚠️ BACKTEST DATA NOTICE Due to TradingView's 1-minute bar limit, the Strategy Tester below only shows the last 7-14 days of data. The +7,107% profit is based on Deep Backtesting (3 Years).
👉 To see the FULL 3-Year Report: Please check the screenshot on my Whop page or the link below
This is a custom automated strategy designed for Ethereum (ETH) scalping on lower timeframes (1m/5m). It is built to capture volatility while strictly managing risk using a dual-mode logic.
█ Strategy Concept
This script combines Trend-Following indicators with Momentum Oscillators to identify high-probability entry points.
1. Trend Filter: Uses EMA and volatility bands to filter out chop/noise.
2. Entry Logic: Enters trades only when momentum confirms the trend direction.
3. Exit Logic: Dynamic take-profit and stop-loss levels based on market volatility (ATR).
█ Key Features
• NO Repainting: All signals are confirmed on 'Bar Close'. The backtest results match live execution.
• Dual Modes Included:
- Aggressive Mode: Compounding logic for maximizing growth.
- Safe Mode: Fixed risk management for capital preservation.
• Risk Management: Includes a daily drawdown limit and automated crash protection.
█ How to Use
1. Apply this strategy to the ETHUSDT chart.
2. Choose your mode in the settings (Aggressive or Safe).
3. Set up alerts for automation (compatible with 3Commas/Whop).
-------------------------------------------------------------
-------------------------------------------------------------
🔒 HOW TO GET ACCESS
This is an Invite-Only script.
To get access to this strategy, please check the link in my or below. 👇
(Access is managed via Whop subscription for instant authorization.)
-------------------------------------------------------------

ETH Scalping Bot V2 [Tori System]This is a custom automated strategy designed for Ethereum (ETH) scalping on lower timeframes (1m/5m). It is built to capture volatility while strictly managing risk using a dual-mode logic.
█ Strategy Concept
This script combines Trend-Following indicators with Momentum Oscillators to identify high-probability entry points.
1. Trend Filter: Uses EMA and volatility bands to filter out chop/noise.
2. Entry Logic: Enters trades only when momentum confirms the trend direction.
3. Exit Logic: Dynamic take-profit and stop-loss levels based on market volatility (ATR).
█ Key Features
• NO Repainting: All signals are confirmed on 'Bar Close'. The backtest results match live execution.
• Dual Modes Included:
- Aggressive Mode: Compounding logic for maximizing growth.
- Safe Mode: Fixed risk management for capital preservation.
• Risk Management: Includes a daily drawdown limit and automated crash protection.
█ How to Use
1. Apply this strategy to the ETHUSDT chart.
2. Choose your mode in the settings (Aggressive or Safe).
3. Set up alerts for automation (compatible with 3Commas/Whop).
-------------------------------------------------------------
🔒 ACCESS:
This is an Invite-Only script.
To get access and view the backtest results, please visit the link in my profile or signature.
(Or visit: whop.com/tori-algo)
-------------------------------------------------------------
-------------------------------------------------------------
🔒 HOW TO GET ACCESS
This is an Invite-Only script.
To get access to this strategy, please check the link in my or below. 👇
(Access is managed via Whop subscription for instant authorization.)
-------------------------------------------------------------

Supertrend Clean Pro + Discord Alert📈 Supertrend Clean Pro with Discord Alert: Strategy Guide
1. Indicator Overview
The Supertrend Clean Pro with Discord Alert is a trend-following indicator that combines price action and volatility (ATR) to identify market direction.
Green Line : Bullish trend; focus on Long entries.
Red Line : Bearish trend; focus on Short entries.
Start Dots : High-visibility markers that appear exactly when a trend flips.
2. Dashboard Metrics
STATUS : Real-time trend direction.
MARKET : Uses the Volatility Filter. If "FLAT," the ATR is below its moving average, suggesting low-volume consolidation—typically a bad time to enter.
STOP GAP : The distance between current price and the Supertrend line (suggested Risk).
TREND GAIN : Tracks how many pips the current trend has moved since the last flip.
3. Best Execution Strategy
To maximize win rates, follow these rules based on the script logic:
A. The "Flat Line" Rule (Avoid Sideways Markets)
When the Supertrend line becomes flat or horizontal, the market is in a range.
Avoid: Taking new signals when the line has been flat for several candles.
Prefer: Signals where the Supertrend line has a clear **diagonal slope**, indicating strong momentum.
B. The Volatility Filter
The script includes an isVolatile check. Only take signals when the Dashboard shows " ACTIVE 🔥 ". This ensures you aren't entering a trade during a "dead" market where price just "bleeds" through your stop loss without moving.
C. Risk Management
The indicator automatically calculates a 2.0 Risk-Reward Ratio (RRR). Use the Discord alert or the dashboard "Stop Gap" to set your position size.
---
⚙️ Optimized ATR Settings (2H Timeframe)
Settings are optimized for the 2-hour chart to balance noise reduction with trend sensitivity.
| Symbol | ATR Period | Multiplier | Notes |
| --- | --- | --- | --- |
| XAUUSD (Gold) | 10 | 3.5 | Wider multiplier to handle gold’s "whipsaws." |
| XAGUSD (Silver) | 12 | 3.0 | Silver requires a slightly longer period for stability. |
| EURUSD | 10 | 2.5 | Lower multiplier for tight-ranging FX pairs. |
| GBPUSD | 10 | 3.0 | Standard setting for the "Cable's" volatility. |
| USDCAD | 14 | 3.0 | Slightly slower period to filter CAD oil-related noise. |
| AUDJPY | 10 | 2.8 | Captures yen-carry trade trends effectively. |
| GBPJPY | 12 | 4.0 | High volatility requires a much wider multiplier. |
| BTCUSD | 10 | 4.0 | Wide multiplier to avoid being stopped out by BTC spikes. |
Disclaimer: Trading foreign exchange is highly speculative and carries a substantial risk of loss. Past performance does not guarantee or predict future results. The publisher, and any associated software, automated trading systems ("bots"), or indicators, are not responsible for any financial losses or damages resulting from their use. You alone assume all risk.

Trend Highway (Manual Edition)Trend Highway (Manual Edition)
All-in-One Trend Following System with Smart Filter Logic
This indicator is a comprehensive trading system designed for Manual Traders who seek precision and reduced noise. It merges the power of Trend Highway, Smart Money Concepts (Order Blocks & Market Structure), and Moving Averages into a single, clean chart interface.
⚠️ Note: This is the "Manual Edition". All bot automation codes (BingX/Telegram) have been removed to ensure a lightweight and fast performance.
Key Features (ฟีเจอร์หลัก)
1. Trend Highway Core (ถนนเทรนด์)
Visualizes the trend direction using a dynamic ribbon.
🟢 Green/Orange: Bullish Trend (ขาขึ้น)
🔴 Red/Yellow: Bearish Trend (ขาลง)
2. Smart Chop Filter (ระบบกรองไซด์เวย์ขั้นสูง) 🧠 This is the heart of the system. It prevents "False Breakouts" by enforcing a strict momentum sequence before signaling an entry:
Step 1 (Rest): The Chop Index (CI) must first rise above 61.8. This indicates the market is resting or consolidating (creating "Potential Energy").
Step 2 (Run): The CI must then drop below 50. This confirms the consolidation is over and a true momentum breakout is occurring (releasing "Kinetic Energy").
Result: You only trade when the market has "rested enough" and is ready to run.
3. Strategic Entry & Add-On (ระบบเข้าออเดอร์)
First Entry: Signals when a trend reversal is confirmed with valid momentum.
Add-On (Add+): Allows you to compound positions safely. The system only suggests adding to a winner if the price pulls back, consolidates (triggers the 61.8 memory), and breaks out again.
4. Hybrid Exit Strategy (ระบบปิดทำกำไร) 🛡️ Exits are dynamic and adapt to market conditions:
Unified SL: Trailing Stop Loss calculated from consolidation structures.
CHoCH Exit: Immediately signals an exit if a Change of Character (Trend Structure Shift) occurs against your position.
5. Institutional Context
Order Blocks (OB): Auto-detects high-probability Supply & Demand zones.
Market Structure: Real-time labeling of BOS (Break of Structure) and CHoCH (Change of Character).
EMAs: Includes EMA 50 & 200 for macro trend identification.
How to Trade (วิธีการใช้งาน)
🟢 LONG Setup:
Trend Highway turns Green.
Price is above EMA 200 (Optional but recommended).
Wait for Alert: "Open LONG" signal appears (Confirmed by CI Filter < 50).
Stop Loss: Place at the red "Unified SL" cross or the recent swing low.
🔴 SHORT Setup:
Trend Highway turns Red.
Price is below EMA 200 (Optional but recommended).
Wait for Alert: "Open SHORT" signal appears (Confirmed by CI Filter < 50).
Stop Loss: Place at the red "Unified SL" cross or the recent swing high.
🏁 EXIT Strategy:
Close the position immediately when you receive a "Close LONG/SHORT" alert.
This alert triggers on either a Stop Loss hit OR a structural change (CHoCH), helping you lock in profits before the trend reverses.
Alerts Configuration (การตั้งค่าแจ้งเตือน)
You can set up a single alert to cover all scenarios:
Add Alert on this indicator.
Condition: Select "Trend Highway (Manual Edition)".
Select "Any alert() function call".
You will receive human-readable notifications for:
Open LONG / Add-On Buy 🟢
Open SHORT / Add-On Sell 🔴
Close LONG / SHORT 🏁
Developed by User Request (AomTawan Logic Merged)

OSVS Advanced CRT Scanner + FVG & Filter📌 Script Name
OSVS Advanced CRT Scanner + FVG & Trend Filter
📖 Description
OSVS Advanced CRT Scanner is an advanced CRT (Candle Range Theory) scanner based on ICT / Smart Money concepts, designed for multi-timeframe and multi-symbol market scanning.
The script combines multiple filters such as:
Liquidity sweeps
Fair Value Gap (FVG) interactions
Trend filter (EMA)
Risk / Reward (R:R) validation
Signal maturity (candle completion)
to identify high-quality long and short trading opportunities.
It provides both visual trade setups (Entry / SL / TP) on the chart and a dashboard for monitoring multiple markets simultaneously.
🚀 Key Features
🔎 Multi-Symbol Scanner
Scan up to 7 different symbols simultaneously
Supports cryptocurrencies, dominance indices, and futures contracts
⏱ Multi-Timeframe Analysis
Weekly (1W)
Daily (1D)
4H
1H
Each timeframe runs through an independent CRT + filtering process.
🧠 Smart Filters
✅ CRT Sweep Logic
✅ Outside Bar (Range Fill) filter
✅ Fair Value Gap (FVG) interaction confirmation
✅ Trend direction filter (EMA)
✅ Minimum Reward / Risk ratio
✅ Candle maturity (% completion) filter
📊 Trend Filter
User-defined EMA length
User-defined trend timeframe
Counter-trend signals can be optionally filtered out
🎯 Trade Setup Visualization
Automatically plotted on the chart:
Entry
Stop Loss
Take Profit (2R)
If price touches TP or SL before entering the trade, the setup is automatically invalidated (stale filter).
🟡 FVG Quality (+) Tag
A “+” quality tag is added if the signal interacts with an active Fair Value Gap (FVG)
Displayed visually on both the chart and the dashboard
📋 Dashboard (Scanning Panel)
All symbols displayed on a single screen
Color-coded based on trend direction
Long / Short / Quality status:
L / S
L+ / S+
– (no signal)
⚙️ Input Settings
🔹 Symbols
Up to 7 symbols
🔹 Visual Settings
CRT levels
Trend EMA
Trade setup drawings
FVG quality tag
🔹 Trend Filter
Enable / disable trend filter
EMA length
Trend timeframe
🔹 Risk Management
Minimum Reward / Risk ratio
🔹 Signal Timing
Candle completion percentage (% maturity)
🔹 Advanced Filters
Outside bar filter
FVG lookback bar count
🔹 Dashboard
Size (Tiny / Small / Normal)
Position (Top / Bottom)
🔔 Alert System
Triggered when an active CRT setup appears on any symbol
JSON-compatible alert message:
CRT STATUS: Setup Detected!
Compatible with bots and webhook systems.
⚠️ Disclaimer
This script is not financial advice.
It is intended for educational and analytical purposes only.
Trading financial markets involves risk.
All trading decisions are the sole responsibility of the user.
🧩 Usage Recommendation
For best performance, use with an HTF → LTF top-down approach
Signals become more selective when the trend filter is enabled
FVG (+) tagged setups are considered higher probability
-----------------------------------------------------------------------------------------------------------

Alertrino - Alpha EdgeAlertrino: Alpha Edge AI Indicator & Trading Intelligence
Master the Markets with Institutional AI on TradingView 🚀
The core of your success starts with the Alpha Edge Indicator. Designed to eliminate guesswork, this professional-grade tool transforms your charts into a precision-driven trading machine. Powered by advanced neural networks, Alpha Edge does the heavy lifting so you can trade with absolute clarity.
🔵 The Flagship: Alpha Edge Indicator
AI-Driven Signals: High-probability Buy/Sell signals based on trend reversals and institutional momentum.
Smart Liquidity Levels: Automatic Support & Resistance zones derived from real market volume.
Trend Confirmation: Advanced filtering to keep you on the right side of the trend and avoid "fakeouts."
TradingView Native: Easy integration with customizable alerts sent directly to your phone or desktop.
🤖 Your Intelligence Arsenal: 20+ AI Bots Enhance your Alpha Edge strategy with our comprehensive data ecosystem:
Smart Money & Dark Pools: Track $1M+ "Golden Sweeps" and hidden institutional block trades.
AI Predictions: Predictive scoring for intraday and swing moves using machine learning.
Breakout Scanners: 24/7 monitoring of 5,000+ assets to catch momentum before it explodes.
Insider Activity: Real-time alerts on CEO buying/selling and Wall Street analyst shifts.
Why Alertrino? We combine visual technical precision through Alpha Edge with real-time fundamental data from our bots. It’s the ultimate "Edge" for serious stock, options, and crypto traders.
Get Alpha Edge Now & Trade with Confidence
Website: alertrino.com

SpaceORB-BTC- Multi-Trade ORB SystemThe SpaceORB as Created by Virtal Solutions is based on the very popular ORB trading system combined with SpacemanBTC features to create better choices on where to enter and to sell. Many ORB systems exist, but none with this combination and also none with the shear number of custom parameters that can be tweaked or fine tuned.The system is an indicator with extensive Alerts, but based on the old-style Fixed types. If requested enough we might convert to a strategy version at a later stage. We tried our best to incorporate all possible setups and parameters to enable you to fine tune your system to the best of your ability. The current setup is for BTC and delivers a 1.8 Profit factor on the Bitget data, but it is possible to tune it to a 2.0 factor on a 9 minute period. On more volatile coins you can increase profitability sharply. There might be 1 or 2 small issues that has not been smoothed out yet, but it works well and doesn't use too much processing resources. Trading commission has not been included in any results.
The basic idea of this system is to create a bot that can run independently and control it's setup on it's own by creating variable Stop losses and Profit targets. We belief this system is one of the superior trading systems currently available, but let us know what you think and if you have any other ideas for further improvement, please drop us a message. Virtal Solutions -virtal08@gmail.com

EstongA* Bot Alerts ProV1*Here’s a consolidated list of warnings and advice for traders, whether you're just starting or are experienced:
⚠️ Critical Warnings
1. You can lose all your capital – Trading is not a get-rich-quick scheme. Never trade with money you can’t afford to lose.
2. Avoid leverage until you fully understand it – Leverage amplifies both gains and losses. Many traders get wiped out by over-leveraging.
3. Beware of "guaranteed profit" systems – If it sounds too good to be true, it is. No strategy works all the time.
4. Emotional trading is a career killer – Fear, greed, and revenge trading destroy accounts.
5. Don’t follow tips or "hot leads" blindly – Do your own analysis. Many influencers are secretly unloading positions onto followers.
📚 Essential Advice
Mindset & Psychology
• Treat trading like a business, not gambling. Have a plan for every trade.
• Develop patience – Wait for high-probability setups; don’t force trades.
• Accept losses as part of the game – Even the best traders have losing streaks. The key is risk management.
• Keep a trading journal – Record every trade: entry/exit reasoning, emotional state, outcome. Review weekly.
Risk Management (Non-Negotiable)
• Risk only 1-2% of your capital per trade – This protects you from ruin during a losing streak.
• Always use stop-losses – Decide your stop-loss BEFORE entering a trade.
• Never add to a losing position ("averaging down") – This is how small losses become catastrophes.
• Have a risk/reward ratio of at least 1:2 – Aim for potential profit to be at least double your potential loss.
Strategy & Education
• Master one market/strategy at a time – Don’t jump between forex, stocks, crypto, and options simultaneously.
• Backtest and forward-test any strategy before using real money.
• Understand market context – Are you in a trending or ranging market? Adjust your strategy accordingly.
• Continuously educate yourself – Markets evolve. Stay updated, but avoid constantly switching strategies.
Practical Habits
• Start with a demo account – Prove you can be consistently profitable before using real money.
• When moving to real money, start small – The psychology changes with real money on the line.
• Set trading hours and stick to them – Avoid overtrading and burnout.
• Regularly withdraw profits – Secure gains and reinforce the reality of your earnings.
🚨 Red Flags in Yourself
• Chasing losses – Trying to immediately recoup a loss leads to bigger losses.
• Overconfidence after wins – Leads to taking oversized, reckless trades.
• Ignoring your trading plan – If you’re making exceptions, you don’t have a plan.
• Blaming the market or others – You are responsible for every trade. Take ownership.
🔍 Choosing a Broker/Platform
• Regulation is crucial – Ensure they are licensed by a reputable authority (FCA, SEC, ASIC, etc.).
• Understand all fees – Spreads, commissions, overnight financing, withdrawal fees.
• Test customer support – You need them in a crisis.
• Start with a well-known, established broker – Avoid obscure platforms with offers that seem too good.
💡 Final Wisdom
• Preservation of capital is more important than making profits. Survive to trade another day.
• The market will always be there – Missing an opportunity is better than taking a bad trade.
• Trading is a marathon of consistency, not a sprint for mega-returns.
• If you're consistently losing, stop, step back, and re-evaluate. Sometimes the best trade is no trade.
Remember, approximately 90% of retail traders lose money. To be in the successful 10%, you need discipline, continuous learning, and emotional control more than a "perfect" strategy. Good luck.

EMA Pullback & Dual Crossover Pro Strategy,EMA Pullback & Dual Crossover Pro Strategy,
(EMA 20 / 50 / 200 Trend-Based System)
🔍 Strategy Overview
The EMA Pullback & Dual Crossover Pro Strategy is a trend-following and trend-reversal trading system designed to capture high-probability entries while filtering out low-quality trades during market noise.
The strategy combines:
Trend continuation trades using EMA 20/50 pullbacks
Major trend reversal trades using EMA 20/200 crossovers
A smart EMA 200 trend filter is applied only to pullback trades, ensuring trades align with the dominant market direction.
This hybrid approach allows the strategy to perform well in:
Strong trending markets
Early trend reversals
Controlled pullback environments
📐 Indicators Used
Indicator Purpose
EMA 20 Fast momentum & entry timing
EMA 50 Pullback structure
EMA 200 Long-term trend direction
🧠 Strategy Logic Breakdown
1️⃣ Trend Definition (EMA 200)
The EMA 200 defines the dominant market trend:
Bullish Trend → Price above EMA 200
Bearish Trend → Price below EMA 200
This trend filter is only applied to EMA 20/50 trades.
2️⃣ EMA 20 / 50 Pullback Trades (Trend Continuation)
These trades capture pullbacks within an existing trend.
🔼 BUY Conditions (20/50 Pullback)
EMA 20 crosses above EMA 50
Price is above EMA 200
Close confirms above EMA 20
Trade triggers after confirmation bars
🔽 SELL Conditions (20/50 Pullback)
EMA 20 crosses below EMA 50
Price is below EMA 200
Close confirms below EMA 20
Trade triggers after confirmation bars
🛑 Counter-trend 20/50 trades are blocked automatically.
3️⃣ EMA 20 / 200 Crossover Trades (Trend Reversal)
These trades capture major market reversals and breakouts.
🔼 BUY Conditions (20/200 Crossover)
EMA 20 crosses above EMA 200
Close confirms above EMA 20
🔽 SELL Conditions (20/200 Crossover)
EMA 20 crosses below EMA 200
Close confirms below EMA 20
🚀 These trades are not trend-filtered to allow early participation in new trends.
⏱ Confirmation Logic
To reduce false signals:
Entries are triggered only after confirmation bars
Price must close in the direction of the trade
Prevents wick-based and noise-induced entries
⚙️ Strategy Settings
Parameter Description
EMA 20 / 50 / 200 Adjustable lengths
Confirmation Bars Signal validation
Enable 20/50 Trades Toggle pullback trades
Enable 20/200 Trades Toggle reversal trades
EMA 200 Trend Filter Applies to 20/50 only
🎯 Trade Types Summary
Trade Type Purpose Trend Filter
EMA 20/50 Trend continuation (pullback) ✅ Yes
EMA 20/200 Trend reversal / breakout ❌ No
📊 Best Use Cases
Markets: XAUUSD, Indices, Major Forex Pairs
Timeframes: M5, M15, H1
Market Conditions: Trending & breakout environments
⚠️ Risk Disclaimer
This strategy is designed for systematic trading and should be used with:
Proper risk management
Fixed position sizing
Stop-loss rules defined by the trader
Backtesting and forward testing are strongly recommended before live deployment.
🧩 Final Notes
This strategy is structured like a professional institutional system:
One engine captures trend pullbacks
One engine captures trend shifts
Noise is filtered using EMA structure and confirmations
It is not a scalping bot, but a trend-aligned trading framework suitable for disciplined traders.

OrangePulse v3.0 Lite - Educational DCA StrategyThis open-source script is a simplified version of the OrangePulse algorithm, designed for educational purposes to demonstrate the power of Dollar Cost Averaging (DCA) and Mean Reversion.
📈 Strategy Logic:
The script uses a combination of Bollinger Bands and RSI (Relative Strength Index) to identify potential mean reversion opportunities.
- Entry: Triggered when price pushes below the lower Bollinger Band while RSI is in oversold territory.
- Management: Utilizes up to 3 Safety Orders (DCA) to improve the average entry price during pullbacks.
🎯 Features:
• Customizable Volume Scale and Step Scale for Safety Orders.
• Visual AVG price line and TP/SL levels.
• Time-window filter for backtesting.
• Real-time Status Table for position monitoring.
This script is shared in the spirit of open-source development on TradingView. It is intended to help traders understand how automated position building and risk management work in volatile markets.
Check my profile status/bio for more information on our project.
⚠️ Disclaimer: For educational purposes only. Past performance does not guarantee future results.

TradingHelperLibLibrary "TradingHelperLib"
Trading Helper Library - Limit order, pip calculation and utility functions for trading bots
f_pipValue()
Calculates pip value based on symbol info
Returns: Pip value
f_pipsToPrice(pips)
Converts pip count to price difference
Parameters:
pips (float) : Number of pips
Returns: Price difference
calcExpireBarCount(minutesToExpire)
Converts minutes to bar count based on timeframe
Parameters:
minutesToExpire (float) : Duration in minutes
Returns: Bar count
calcLimitPrice(isLong, signalPrice, deviation, deviationType)
Calculates limit order price with deviation
Parameters:
isLong (bool) : True for long, false for short
signalPrice (float) : Signal price
deviation (float) : Deviation amount
deviationType (string) : Deviation type ("USDT" or "%")
Returns: Limit price
checkLimitFill(isLong, limitPrice)
Checks if limit order is filled
Parameters:
isLong (bool) : True for long, false for short
limitPrice (float) : Limit price to check
Returns: True if filled
f_multiplier(lvl, mode)
Calculates DCA multiplier based on level and mode
Parameters:
lvl (int) : DCA level
mode (string) : Multiplier mode ("Sabit", "Fibonacci", "Martingale", etc.)
Returns: Multiplier value
f_pctToPrice(pct, basePrice)
Converts percentage value to price difference
Parameters:
pct (float) : Percentage value (e.g. 2.0 = 2%)
basePrice (float) : Reference price
Returns: Price difference
f_priceChange_toPct(priceChange, basePrice)
Converts price change to percentage
Parameters:
priceChange (float) : Price difference
basePrice (float) : Reference price
Returns: Percentage value
calcMargin(notional, leverage)
Calculates margin from notional value
Parameters:
notional (float) : Trade size (e.g. $1000)
leverage (int) : Leverage value (e.g. 100)
Returns: Margin value
calcNotional(margin, leverage)
Calculates notional from margin
Parameters:
margin (float) : Collateral value
leverage (int) : Leverage value
Returns: Notional value
calcLiqPriceLongSimple(avgPrice, leverage)
Calculates simple liquidation price for Long position
Parameters:
avgPrice (float) : Average entry price
leverage (int) : Leverage value
Returns: Estimated liquidation price
calcLiqPriceShortSimple(avgPrice, leverage)
Calculates simple liquidation price for Short position
Parameters:
avgPrice (float) : Average entry price
leverage (int) : Leverage value
Returns: Estimated liquidation price
calcPnlLong(entryPrice, currentPrice, notional)
Calculates Long position PNL
Parameters:
entryPrice (float) : Entry price
currentPrice (float) : Current price
notional (float) : Position size
Returns: PNL value
calcPnlShort(entryPrice, currentPrice, notional)
Calculates Short position PNL
Parameters:
entryPrice (float) : Entry price
currentPrice (float) : Current price
notional (float) : Position size
Returns: PNL value
calcFee(notional, feeRate)
Calculates trading fee
Parameters:
notional (float) : Trade size
feeRate (float) : Fee rate in percentage (e.g. 0.1 = 0.1%)
Returns: Fee value

Market State Engine V2# Market State Engine
**Deterministic Confidence-Scoring System for TradingView**
A professional-grade PineScript v5 indicator that scores market conditions from 0-100, helping traders identify high-quality trading opportunities through systematic structure analysis, VWAP positioning, order flow dynamics, and time-based context.
---
## 🎯 Overview
The **Market State Engine** is not a trading bot—it's a **noise-reduction and opportunity-ranking system** designed to filter market conditions and surface only the highest-quality setups.
Instead of blindly taking every signal, this indicator:
- ✅ **Scores** market conditions objectively (0-100 scale)
- ✅ **Filters** out low-probability setups automatically
- ✅ **Classifies** opportunities into A, A+, and A++ grades
- ✅ **Alerts** only on confirmed structure shifts with supporting context
- ✅ **Keeps the human in control** - provides intelligence, not automation
### Philosophy: Reduce Noise. Enforce Discipline. Surface Quality.
---
## 🚀 Key Features
- **Deterministic Scoring** - No black boxes, fully explainable logic
- **Multi-Factor Analysis** - Combines 4 independent market state components
- **Structure-First Approach** - Only alerts on confirmed pivot breaks
- **VWAP Mean Reversion Logic** - Directional filtering based on VWAP zones
- **Order Flow Proxy** - CVD divergence and confirmation detection
- **Session-Aware Scoring** - Prioritizes high-volume New York sessions
- **Alert De-Duplication** - One alert per unique structure shift
- **Zero Repainting** - Uses confirmed pivots only (left=2, right=2)
- **Fully Configurable** - All parameters exposed as inputs
- **Visual Feedback** - VWAP bands, setup labels, and real-time score panel
---
## 📊 Scoring System (0-100)
The Market State Engine evaluates **four independent components**, each contributing up to **25 points** for a maximum total score of **100**.
### 🎯 Component Breakdown
| Component | Max Points | Description |
|-----------|------------|-------------|
| **VWAP Context** | 25 | Measures price deviation from session VWAP |
| **Structure Shift** | 25 | Confirms pivot breakout (HARD GATE) |
| **CVD Alignment** | 25 | Detects order flow divergence/confirmation |
| **Time-of-Day** | 25 | Identifies high-probability trading sessions |
---
### 1️⃣ VWAP Context (Max 25 Points)
**Purpose:** Identifies extreme price deviations from fair value for mean-reversion opportunities.
VWAP (Volume-Weighted Average Price) is calculated session-anchored to New York market time, with standard deviation bands creating zones of opportunity.
#### Band Structure:
- **1st Band**: ±1σ from VWAP (fair value zone)
- **2nd Band**: ±2σ from VWAP (moderate deviation)
- **3rd Band**: ±3σ from VWAP (extreme deviation)
#### Scoring Logic (Exclusive):
```
Price in 3rd VWAP Band (>2σ and ≤3σ) → +25 points
Price in 2nd VWAP Band (>1σ and ≤2σ) → +15 points
Otherwise (inside 1σ or beyond 3σ) → 0 points
```
**Key Insight:** The further price stretches from VWAP, the higher the probability of mean reversion.
---
### 2️⃣ Structure Shift (Max 25 Points) — **HARD GATE**
**Purpose:** Confirms momentum shift through confirmed pivot breakouts.
⚠️ **CRITICAL:** Structure shift is **mandatory**. If no valid structure shift occurs, the **total score becomes 0** regardless of other factors.
#### Detection Method:
Uses TradingView's `ta.pivothigh()` and `ta.pivotlow()` functions with **locked parameters**:
- **Left bars**: 2
- **Right bars**: 2
- **Source**: Configurable (Wick or Body)
- **Break confirmation**: Candle close only
#### Bullish Structure Shift:
- ✅ Prior swing high exists (confirmed pivot)
- ✅ Current candle **closes above** swing high + tick buffer
- ✅ Must occur in VWAP 2nd or 3rd band
- ✅ **VWAP Filter**: Price must be **at or below VWAP** (lower bands)
#### Bearish Structure Shift:
- ✅ Prior swing low exists (confirmed pivot)
- ✅ Current candle **closes below** swing low - tick buffer
- ✅ Must occur in VWAP 2nd or 3rd band
- ✅ **VWAP Filter**: Price must be **at or above VWAP** (upper bands)
#### Scoring:
```
Valid structure shift → +25 points
No structure shift → Total score = 0
```
**Tick Buffer:** Default 5 ticks (configurable) - prevents false breaks from minor price noise.
---
### 3️⃣ CVD Alignment (Max 25 Points)
**Purpose:** Detects institutional order flow through volume delta analysis.
CVD (Cumulative Volume Delta) is a proxy for order flow:
```
Close > Open → +Volume (buying pressure)
Close < Open → -Volume (selling pressure)
```
#### Scoring Logic:
| Condition | Points | Description |
|-----------|--------|-------------|
| **Divergence** | +25 | Price makes higher high + CVD makes lower high (bearish)Price makes lower low + CVD makes higher low (bullish) |
| **Confirmation** | +20 | Price and CVD both make higher highs or lower lows |
| **Neutral** | 0 | No clear divergence or confirmation |
**Lookback Window:** Last 20 bars (configurable) - prevents stale divergences.
**Key Insight:** Divergences suggest weakening momentum, while confirmations validate the trend.
---
### 4️⃣ Time-of-Day Context (Max 25 Points)
**Purpose:** Prioritizes high-volume, high-volatility New York sessions.
#### Scored Sessions (America/New_York timezone):
| Session | Time Range (NY) | Points | Description |
|---------|-----------------|--------|-------------|
| **Pre-Market** | 03:00 - 04:00 | +25 | Early liquidity injection |
| **Market Open** | 09:30 - 11:30 | +25 | Highest volume period |
| **Off-Hours** | All other times | 0 | Lower probability setups |
**Key Insight:** Structure shifts during active sessions have higher follow-through probability.
---
## 🏆 Setup Classification
Setups are graded based on total score thresholds (configurable):
| Grade | Score Range | Typical Components | Quality Level |
|-------|-------------|-------------------|---------------|
| **A++ Setup** | ≥90 | All 4 factors aligned(VWAP 3rd band + Structure + CVD + Session) | Premium - Rare |
| **A+ Setup** | ≥75 | Structure + VWAP + CVD or Session(3 of 4 factors) | High - Select |
| **A Setup** | ≥60 | Structure + VWAP + Session(Minimum viable setup) | Good - Regular |
| **No Grade** | <60 | Insufficient confluence | Filtered out |
**Default Thresholds:**
- A Setup: 60 points
- A+ Setup: 75 points
- A++ Setup: 90 points
---
## 📥 Installation
### Step 1: Download the Indicator
Download the `market_state_engine.pine` file from this repository.
### Step 2: Add to TradingView
1. Open (www.tradingview.com)
2. Open the **Pine Editor** (bottom panel)
3. Click **"New"** → **"Blank indicator"**
4. Delete all default code
5. Paste the contents of `market_state_engine.pine`
6. Click **"Add to Chart"**
### Step 3: Configure for Your Symbol
1. Click the **gear icon** next to the indicator name
2. Adjust **Tick Size** for your instrument:
- ES futures: `0.25`
- NQ futures: `0.25`
- Stocks: `0.01`
3. Save settings
---
## ⚙️ Configuration
### Symbol Settings
| Parameter | Default | Description |
|-----------|---------|-------------|
| **Tick Size** | 0.25 | Minimum price movement for your symbol |
| **Tick Buffer Count** | 5 | Ticks beyond swing for valid break |
### VWAP Settings
| Parameter | Default | Description |
|-----------|---------|-------------|
| **VWAP Band 1 (σ)** | 1.0 | 1st standard deviation multiplier |
| **VWAP Band 2 (σ)** | 2.0 | 2nd standard deviation multiplier |
| **VWAP Band 3 (σ)** | 3.0 | 3rd standard deviation multiplier |
### Session Settings
| Parameter | Default | Description |
|-----------|---------|-------------|
| **Session 1** | 0300-0400 | Pre-market window (NY time) |
| **Session 2** | 0930-1130 | Market open window (NY time) |
### Score Thresholds
| Parameter | Default | Description |
|-----------|---------|-------------|
| **A Setup Threshold** | 60 | Minimum score for A grade |
| **A+ Setup Threshold** | 75 | Minimum score for A+ grade |
| **A++ Setup Threshold** | 90 | Minimum score for A++ grade |
### CVD Settings
| Parameter | Default | Description |
|-----------|---------|-------------|
| **CVD Divergence Lookback** | 20 | Maximum bars for divergence detection |
### Swing Settings
| Parameter | Default | Options | Description |
|-----------|---------|---------|-------------|
| **Swing Detection Method** | Wick | Wick / Body | Use high/low or open/close for pivots |
### Visual Settings
| Parameter | Default | Description |
|-----------|---------|-------------|
| **Show VWAP Bands** | ✅ | Display VWAP and standard deviation bands |
| **Show Setup Labels** | ✅ | Display setup markers on chart |
| **Show Score Panel** | ✅ | Display real-time score breakdown |
---
## 📖 How to Use
### Step 1: Apply to 1-Minute Chart
⚠️ **The indicator is locked to 1-minute timeframe** - do not use on other timeframes.
### Step 2: Understand the Visual Signals
#### Setup Labels
- **Green Triangle (▲)** - Bullish (Long) setup detected
- **Red Triangle (▼)** - Bearish (Short) setup detected
- Label shows **Grade** (A/A+/A++) and **Total Score**
#### VWAP Bands
- **Yellow Line** - Session VWAP (fair value)
- **Blue Bands** - ±1σ (fair value zone)
- **Purple Bands** - ±2σ (moderate deviation)
- **Red Bands** - ±3σ (extreme deviation)
#### Score Panel (Top Right)
Real-time breakdown of all four components:
```
Component Score
VWAP Zone 15/25
Structure 25/25
CVD 20/25
Session 25/25
TOTAL 85/100 (A+)
```
### Step 3: Interpret Signals
#### Valid Long Setup:
✅ Green triangle below candle
✅ Price in **lower VWAP bands** (below VWAP)
✅ Structure shift breaks swing high
✅ Score ≥60
#### Valid Short Setup:
✅ Red triangle above candle
✅ Price in **upper VWAP bands** (above VWAP)
✅ Structure shift breaks swing low
✅ Score ≥60
### Step 4: Set Up Alerts (See Alert Conditions section)
---
## 🚦 Signal Filters (VWAP Zone Logic)
The indicator uses **directional VWAP filtering** to prevent counter-trend signals:
### Long Signals (Green)
**Only allowed when price is AT or BELOW VWAP**
- ✅ Lower 2nd band (-2σ to -1σ)
- ✅ Lower 3rd band (-3σ to -2σ)
- ✅ At VWAP exactly
- ❌ **BLOCKED** in upper bands (above VWAP)
**Logic:** Longs when price is stretched below fair value (mean reversion)
### Short Signals (Red)
**Only allowed when price is AT or ABOVE VWAP**
- ✅ Upper 2nd band (+1σ to +2σ)
- ✅ Upper 3rd band (+2σ to +3σ)
- ✅ At VWAP exactly
- ❌ **BLOCKED** in lower bands (below VWAP)
**Logic:** Shorts when price is stretched above fair value (mean reversion)
---
## 🎨 Visual Elements
### Chart Overlays
| Element | Color | Description |
|---------|-------|-------------|
| **VWAP Line** | Yellow | Session-anchored fair value |
| **±1σ Bands** | Blue | Fair value zone (no score) |
| **±2σ Bands** | Purple | Moderate deviation (15 pts) |
| **±3σ Bands** | Red | Extreme deviation (25 pts) |
| **Swing Highs** | Red ▼ | Confirmed pivot highs |
| **Swing Lows** | Green ▲ | Confirmed pivot lows |
| **Session Background** | Light Green | Active high-value session |
### Setup Labels
**Bullish Setup:**
```
A+
▲ 75
```
Green label below candle, shows grade and score
**Bearish Setup:**
```
A++
▼ 90
```
Red label above candle, shows grade and score
### Score Panel
Real-time table in top-right corner:
- Individual component scores (0-25 each)
- Total score (0-100)
- Current setup grade (A/A+/A++)
- Updates in real-time as market conditions change
---
## 🔔 Alert Conditions
### Setting Up Alerts
#### Method 1: Built-in Alert Conditions
1. Click **"Create Alert"** in TradingView
2. Select **Market State Engine** as condition
3. Choose alert type:
- **Bullish Setup** - Long signals only
- **Bearish Setup** - Short signals only
- **Any Setup** - All signals
4. Set to **"Once Per Bar Close"**
5. Configure notification method (app, email, webhook)
#### Method 2: Custom Alert Message
Alert messages include full breakdown:
```
A+ Setup Detected (Score: 85)
Components: VWAP(25) + Structure(25) + CVD(20) + Time(15)
CVD State: Confirmation
Direction: Long
Timeframe: 1m
```
### Alert Behavior
✅ **One alert per unique pivot break** - no spam
✅ **Fires on candle close only** - no repainting
✅ **Minimum score filter** - only A grade or higher (≥60)
✅ **Direction-specific** - separate bullish/bearish conditions
⚠️ **No cooldown between different pivots** - multiple alerts per session allowed if different swing levels break
---
## 🔧 Technical Details
### Timeframe Lock
- **Required**: 1-minute chart only
- **Reason**: Scoring model calibrated for 1m micro-structure
- **Future**: Multi-timeframe support planned for v2
### Timezone Configuration
- **Hard-coded**: `America/New_York`
- **Session Detection**: Uses TradingView's native session functions
- **Consistency**: All time-based logic uses NY timezone
### Swing Detection Parameters
**Locked to specification:**
- `ta.pivothigh(source, left=2, right=2)`
- `ta.pivotlow(source, left=2, right=2)`
**Implications:**
- Pivots confirmed 2 bars after formation
- No repainting - historical pivots don't move
- 4-bar minimum swing structure (2 left + pivot + 2 right)
### VWAP Calculation
- **Type**: Session-anchored (resets daily)
- **Source**: Typical price `(high + low + close) / 3`
- **Weighting**: Volume-weighted
- **Standard Deviation**: True population standard deviation
### CVD Proxy Formula
```pine
barDelta = close > open ? volume : close < open ? -volume : 0
CVD = cumulative sum of barDelta (session-reset)
```
### Performance Limits
- **Max Labels**: 500 (TradingView limit)
- **Max Bars Back**: 500
- **Memory**: Lightweight - uses only essential variables
---
## 💡 Best Practices
### 1. **Use as a Filter, Not a Strategy**
❌ Don't: Blindly take every signal
✅ Do: Use score as confluence for your existing analysis
### 2. **Higher Grades = Better Probability**
- **A Setups (60-74)**: Regular opportunities, still require discretion
- **A+ Setups (75-89)**: High-quality, multiple factors aligned
- **A++ Setups (90-100)**: Rare premium opportunities, strongest edge
### 3. **Respect the VWAP Zone Filter**
The indicator **automatically blocks**:
- Longs in upper VWAP bands (counter-trend)
- Shorts in lower VWAP bands (counter-trend)
Trust this logic - it enforces mean reversion discipline.
### 4. **Monitor the Score Panel**
Watch which components are scoring to understand **why** a setup formed:
- Missing CVD score? → No order flow confirmation
- Missing Time score? → Outside high-volume sessions
- Low VWAP score? → Weak deviation from fair value
### 5. **Combine with Risk Management**
The indicator provides **opportunity scoring**, not position sizing:
- Use stop losses based on swing structure
- Scale position size with setup grade (larger on A++, smaller on A)
- Set profit targets at VWAP or opposing band
### 6. **Session Awareness**
Prioritize signals during **active sessions**:
- **03:00-04:00 NY**: Pre-market momentum
- **09:30-11:30 NY**: Highest volume, tightest spreads
Off-hours signals (0 time score) are lower probability but still valid if other factors strong.
### 7. **Understand the Hard Gate**
If **no structure shift** occurs:
- Total score = 0
- No alerts fire
- Other components irrelevant
**Why?** Structure shift confirms momentum change - without it, there's no tradable opportunity.
### 8. **Avoid Over-Optimization**
Default settings are well-calibrated:
- Don't chase "perfect" parameters
- Test changes on historical data before live use
- Document any modifications
### 9. **Leverage Alert De-Duplication**
The indicator prevents spam automatically:
- One alert per unique swing break
- New swing levels = new alerts
- No need to manually filter notifications
### 10. **Supplement with Price Action**
Use the indicator alongside:
- Support/resistance levels
- Order flow footprint charts
- Volume profile
- Market internals (breadth, TICK, etc.)
---
## 📚 Example Scenarios
### Example 1: A++ Premium Setup (Score: 95)
```
Price: In lower 3rd VWAP band (-2.8σ) → VWAP: 25 pts
Structure: Close breaks swing high → Structure: 25 pts
CVD: Price LL + CVD HL (bullish div) → CVD: 25 pts
Time: 10:15 AM NY (market open) → Time: 25 pts
Direction: LONG (price below VWAP) → Valid
Grade: A++ (95/100)
```
**Interpretation:** All factors aligned - premium mean-reversion long opportunity.
---
### Example 2: A+ Strong Setup (Score: 80)
```
Price: In upper 2nd VWAP band (+1.5σ) → VWAP: 15 pts
Structure: Close breaks swing low → Structure: 25 pts
CVD: Price HH + CVD LH (bearish div) → CVD: 25 pts
Time: 2:00 PM NY (off-hours) → Time: 0 pts
Direction: SHORT (price above VWAP) → Valid
Grade: A+ (65/100)
```
**Interpretation:** Strong setup despite off-hours, bearish divergence adds confidence.
---
### Example 3: Filtered Setup (Score: 0)
```
Price: In upper 3rd VWAP band (+2.5σ) → VWAP: 25 pts (if allowed)
Structure: Close breaks swing high → Structure: BLOCKED
CVD: Price HH + CVD HH (confirmation) → CVD: 20 pts (if allowed)
Time: 10:00 AM NY → Time: 25 pts (if allowed)
Direction: LONG (price ABOVE VWAP) → ❌ INVALID ZONE
Grade: None (0/100) - NO ALERT
```
**Interpretation:** VWAP filter blocked long signal in upper band - prevents counter-trend trade.
---
## 🛠️ Troubleshooting
### No Signals Appearing
- ✅ Verify you're on **1-minute chart**
- ✅ Check **Tick Size** matches your symbol
- ✅ Ensure **VWAP Bands** are visible
- ✅ Wait for confirmed pivots (requires at least 5 bars of history)
### Alerts Not Firing
- ✅ Confirm alert is set to **"Once Per Bar Close"**
- ✅ Check score threshold (must be ≥60 by default)
- ✅ Verify VWAP zone filter isn't blocking signals
- ✅ Check that structure shift is actually occurring
### Score Always Zero
- ✅ No structure shift detected (hard gate active)
- ✅ Price may not be in valid VWAP zone (2nd or 3rd band)
- ✅ Insufficient swing history (wait for pivots to form)
### Too Many/Too Few Signals
**Too many signals:**
- Increase **A Setup Threshold** (e.g., 70 instead of 60)
- Increase **Tick Buffer Count** (reduces false breaks)
**Too few signals:**
- Decrease **A Setup Threshold** (e.g., 50 instead of 60)
- Decrease **Tick Buffer Count** (more sensitive to breaks)
---
## 📜 License
This indicator is provided under the **Mozilla Public License 2.0**.
---
## 🤝 Credits
Developed as a professional trading tool for systematic opportunity identification.
**Philosophy:** Reduce noise. Enforce discipline. Keep the human in control.
---
## 📞 Support
For questions, issues, or feature requests, please consult:
1. This README documentation
2. The specification document (`pinescript_market_state_engine_spec.docx`)
3. Inline code comments in `market_state_engine.pine`
---
## 🔄 Version History
**v1.0** (Current)
- Initial release
- 4-component scoring model (VWAP + Structure + CVD + Time)
- VWAP zone directional filtering
- Alert de-duplication
- Configurable inputs
- Real-time score panel
- Session-aware logic
---
## 🎓 Understanding the Numbers
### Quick Reference Card
| Score Range | Grade | Quality | Typical Use |
|-------------|-------|---------|-------------|
| 90-100 | A++ | Premium | Highest conviction trades |
| 75-89 | A+ | High | Strong probability setups |
| 60-74 | A | Good | Acceptable with discretion |
| 0-59 | None | Filtered | Skip or wait for confluence |
### Component Contribution Examples
**Minimum A Setup (60 points):**
- Structure (25) + VWAP 3rd band (25) + Time (25) = 75 ✅
**Typical A+ Setup (75 points):**
- Structure (25) + VWAP 2nd band (15) + CVD confirm (20) + Time (25) = 85 ✅
**Maximum A++ Setup (100 points):**
- Structure (25) + VWAP 3rd band (25) + CVD divergence (25) + Time (25) = 100 ✅
---
## 🎯 Final Reminder
**This is NOT a trading bot.**
**This is NOT financial advice.**
**This is a decision-support tool.**
Always:
- ✅ Use proper risk management
- ✅ Understand the logic before trading
- ✅ Backtest on your symbols
- ✅ Keep the human in control
**Happy Trading! 📈**
