Apex Liquidity & Trend Architect [Smart]Trading charts often suffer from two problems: Noise (too many false signals in chopping markets) and Clutter (too many old lines and zones obscuring price).
ALTA solves both. It is a streamlined, institutional-grade trend system that uses ADX filtering to silence weak signals and Time-Decay logic to automatically clean up old liquidity zones. It respects your screen real estate, showing you only what matters, right now.
1. The "Smart" Engine
Unlike standard trend indicators that repaint or clutter the screen, ALTA introduces three key innovations:
A. Hull Moving Average (HMA) Baseline
We have upgraded the core engine to use the Hull Moving Average. HMA is significantly faster and smoother than standard EMAs or SMAs, reducing lag on entry signals.
Note: You can switch back to WMA or SMA in the settings if you prefer a slower pace.
B. ADX Momentum Filtering
Quality over Quantity: The script monitors the ADX (Average Directional Index). If the trend flips, but the ADX is below 20 (weak trend), the signal is blocked.
This prevents you from getting chopped out during sideways accumulation phases. You only get a "BUY" or "SELL" label when there is actual momentum behind the move.
C. Adaptive Gradient Coloring
The candles do not just turn Green or Red. They change intensity based on trend strength.
Bright/Vivid Candles: Strong Momentum (High ADX).
Dark/Dull Candles: Weak Momentum (Low ADX).
Visual Cue: If the candles are fading into the background, stay out of the market.
2. Self-Cleaning Liquidity Zones
Most support/resistance indicators leave old boxes on the chart forever. ALTA uses a Decay Protocol.
Volume Validation: Supply/Demand zones are only drawn if the pivot point had volume significantly higher than average (configurable).
Mitigation: If price wicks through a zone, it is deleted instantly.
Time Decay (New): If a zone is not hit within a set number of bars (Default: 100), it automatically deletes itself. This keeps your chart focused on fresh levels only.
3. The Minimalist HUD
A simplified dashboard in the corner of your screen provides an instant health check of the market:
ALTA Label: System Status.
Trend: BULL / BEAR / WAIT (Squeeze).
Power: WEAK / SOLID / STRONG (Based on ADX).
4. How to Trade (The Strategy)
The High-Probability Buy
Trend: Ribbon is Green.
Candles: Candles are Bright Green (indicating High ADX Strength).
Signal: A "BUY" label appears (confirmed by ADX filter).
Liquidity: Price is bouncing off a valid Demand Zone.
The High-Probability Sell
Trend: Ribbon is Red.
Candles: Candles are Bright Red (indicating High ADX Strength).
Signal: A "SELL" label appears.
Liquidity: Price is rejecting off a valid Supply Zone.
When to STAY OUT
The Squeeze: If the ribbon turns Grey/White, volatility is compressing. Wait for the breakout.
The Fade: If the candles are dark/translucent, momentum is dying. Take profits or wait for a fresh impulse.
5. Settings & Customization
Basis Type: Switch between HMA (Fast), WMA (Standard), or SMA (Slow).
Signal Quality Filter: Toggle the ADX filter on/off.
Zone Life: How many bars should a Supply/Demand zone survive before decaying?
Tooltips: Every single setting in this script includes a descriptive tooltip. Hover over the "i" icon in the settings menu for detailed explanations of every feature.
Disclaimer
This indicator is for educational purposes only. Past performance (even with smart filtering) does not guarantee future results. Always manage your risk.
ค้นหาในสคริปต์สำหรับ "adx"

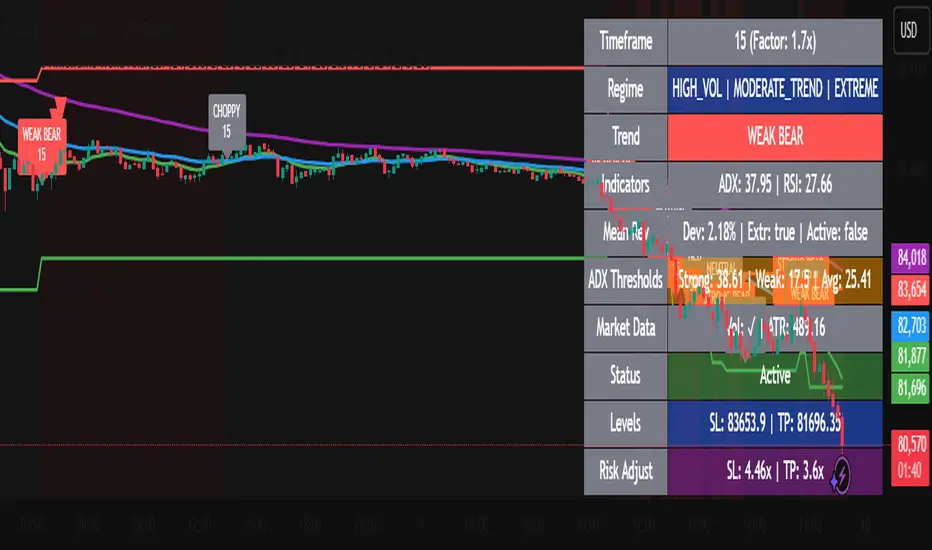
Dynamic Timeframe Trend AnalyzerPurpose and Core Logic
This indicator automatically adjusts its calculations based on the current chart’s timeframe, allowing traders to analyze trends, momentum, and mean reversion opportunities without manually changing indicator settings for each interval. It detects potential long or short setups by combining several techniques:
Dynamic Timeframe Factor
The script compares the current timeframe to a base (e.g., 5 minutes) and calculates a “factor” to scale certain parameters, such as EMA lengths or ATR settings. This reduces the need to reconfigure indicators when switching timeframes.
Regime Detection
It uses ADX (Average Directional Index) to classify the market as strongly trending, moderately trending, choppy, or in a potential mean-reversion phase.
RSI (Relative Strength Index) is also monitored for extreme levels (e.g., overbought/oversold) to detect potential reversal zones.
Volume is compared to a moving average to confirm or refute volatility conditions.
Trend & Mean Reversion Signals
EMA Alignment (8/21/55) helps identify bullish or bearish phases (strong bull if all EMAs align upward, strong bear if aligned downward).
For mean reversion opportunities, the script checks if ADX is sufficiently low (indicating weak or no trend) while price and RSI are at extreme levels—suggesting a snapback or countertrend move may occur.
Dynamic Stop Loss & Take Profit
Uses ATR (Average True Range) to set initial stop-loss (SL) and take-profit (TP) levels, then adjusts these levels further with “regime multipliers” based on whether the market is in a high-volatility trend or a quieter mean-reversion environment.
This approach aims to place stops and targets in a more adaptive way, reflecting current market conditions rather than a one-size-fits-all approach.
Visual Aids
Color-coded chart backgrounds (e.g., greenish for bullish trend, red for bearish, yellow/orange for mean reversion).
Triangles to show recent bullish/bearish signals.
A status table in the top-right corner (optional) displaying key metrics like ADX, RSI, dynamic thresholds, current SL/TP levels, and whether a stop loss has been hit.
How It Works Internally
ADX & Dynamic Thresholds:
A moving average (adx_mean) and standard deviation (adx_std) of the ADX are calculated over a lookback period to define “strong” vs. “weak” ADX thresholds.
This allows the script to adapt to changing volatility and trend strength in different markets or timeframes.
Mean Reversion Criteria:
The indicator checks if price deviates significantly from its own moving average, alongside RSI extremes. If ADX suggests no strong directional push (i.e., the market is “quiet”), it may classify conditions as mean-reverting.
Regime Multipliers:
Once the script identifies the market regime (e.g., strong uptrend, choppy, mean reversion), it applies different multipliers to the user-defined base values for stop-loss and take-profit. For instance, strong trending conditions might allow for wider stops to handle volatility, while mean reversion signals use tighter exits to capture quick reversals.
How to Use It
Timeframe Agnostic
Simply apply it to any timeframe (from 1-minute up to daily or weekly). The “Dynamic Timeframe Factor” will scale the indicator parameters automatically.
Look for Buy/Sell Triangles
When the script detects a valid bullish trend shift or a mean-reversion long setup, it plots a green triangle under the price bar. Conversely, it plots a red triangle above the price bar for bearish or mean-reversion short setups.
Check the Status Table
The table in the top-right corner summarizes the indicator’s current readings: ADX, RSI, volume trends, and the market regime classification.
The table also shows if a stop loss has been hit (SL Hit) and displays recommended SL/TP levels if a signal is active.
Stop Loss & Take Profit
The script plots lines for SL and TP on your chart after a new signal. These lines are automatically adjusted based on ATR, volume conditions, and ADX-derived multipliers.
Mean Reversion vs. Trend-Following
If you see a “Mean Rev” state in the table or the background turning yellow/orange, it suggests potential countertrend trades. Conversely, “STRONG BULL” or “STRONG BEAR” states favor momentum-based entries in the prevailing direction.
Originality & Benefits
Adaptive to Timeframe: Many indicators require reconfiguration when switching from short to long timeframes. This script automates that process using the “timeframe factor” logic.
Regime-Based SL/TP: Instead of fixed risk parameters, the script dynamically tunes stop and target levels depending on whether the market is trending or reverting.
Comprehensive Market View: It combines multiple factors—ADX, RSI, volume, moving averages, and volatility measurements—into a single, integrated framework that categorizes the market regime in real time.
Best Practices & Notes
Timeframes: It typically performs well on intraday timeframes (5m, 15m, 1H) but can also be used for swing trading on 4H or Daily charts.
Settings: The defaults are a good starting point, but you can adjust the base ATR multiplier or ADX lookbacks if you prefer a different balance between sensitivity and stability.
Risk Management: This indicator is not a guarantee of any specific results. Always use proper risk management (position sizing, stop-losses, and diversified strategies).
Alert Conditions: Built-in alert conditions can notify you when a new long or short signal appears, or when a stop loss is triggered.
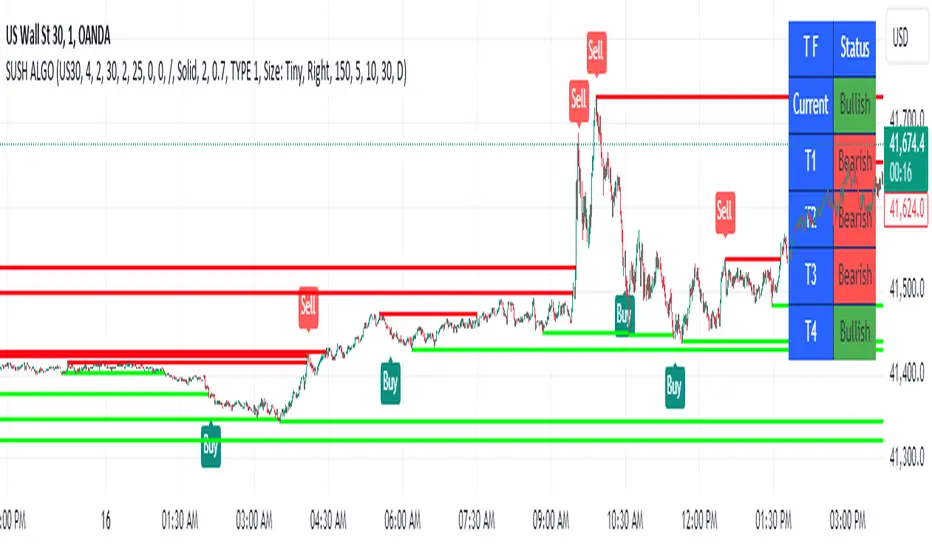
SUSH ALGOStep-by-Step Guide for Trading Using the Script
1. Asset Selection
When applying this script, the first thing to do is select your desired asset to trade.
You can select from the following assets within the script:
Scalping
Gold
USD/JPY
EUR/USD
EUR/JPY
BTC/USD
NIFTY 50
The parameters for the strategy (e.g., q, r, s, and ADX Threshold) will adjust automatically based on your selected asset. If you want to use custom parameters, turn on the Use Manual Settings option.
2. Adjust Manual Settings (Optional)
Use Manual Settings: Toggle this if you want to input your custom values for the strategy parameters.
Manual q: Affects swing period calculation.
Manual r: Affects the smoothing in the calculation of the oscillator.
Manual s: Affects the smoothing period of the main line of the oscillator.
Manual Signal Length: Length of the signal line for generating buy/sell signals.
Manual ADX Threshold: Adjusts the ADX value to filter trades based on trend strength.
3. Reading the SMI (Stochastic Momentum Index) Oscillator
SMI: This indicator oscillates between overbought and oversold levels, signaling potential entry and exit points.
Overbought Level: +30
Oversold Level: -30
The signal line is calculated based on the smoothed SMI value.
A crossover above the signal line in the oversold region (< -30) signals a buy.
A crossunder below the signal line in the overbought region (> +30) signals a sell.
4. Trade Signal Alerts
Buy Signal Alert: Triggered when the SMI crosses over the signal line in the oversold zone, and ADX exceeds the threshold.
Sell Signal Alert: Triggered when the SMI crosses under the signal line in the overbought zone, and ADX exceeds the threshold.
5. Entry, Stop Loss, and Target Levels
Entry Line: The script will plot an entry line at the close price when a buy or sell signal is triggered.
Stop Loss: A stop loss will be set based on the lowest low (for buy signals) or highest high (for sell signals) of the previous candles.
Take Profit Targets:
Target 1 (TP1): 3 times the size of the entry candle.
Target 2 (TP2): 6 times the size of the entry candle.
Target 3 (TP3): 10 times the size of the entry candle.
Make sure the Show Entry, Show Stop Loss, and Show Targets toggles are enabled to visualize these lines on the chart.
6. Monitoring the ADX (Average Directional Index)
The ADX value filters weak signals, ensuring that you trade only in trending markets.
If ADX > adxThreshold, the trend is strong, and the buy or sell signal becomes valid.
If ADX < adxThreshold, the trade signals are ignored to avoid trading in sideways markets.
7. Box, Line, and Label Toggles for Swing Highs/Lows
The script allows you to visualize swing highs and lows for better market context. You can toggle the following options:
Show Boxes: Displays rectangular boxes around the swing highs and lows.
Show Swing Lines: Plots lines at swing highs and lows for visual confirmation of key price levels.
Show Labels: Adds text labels to the swing levels, indicating whether they represent a swing high or low.
8. Customize Appearance (Optional)
You can change the appearance of the boxes, lines, and labels, such as their color, width, and style (solid or dotted), from the Appearance settings.
9. Monitor Volume and Open Interest (Optional)
You can also track volume and open interest (OI) data from various exchanges like Binance and BitMEX to get additional confirmations.
Steps for Trading
1.Select your asset from the drop-down menu based on your trading preferences.
2.Adjust manual settings (optional) if you want to use your own parameters for the strategy.
3.Wait for a buy or sell signal to trigger based on the crossover of the SMI oscillator in the overbought/oversold regions.
4.Once a signal is triggered, check for the plotted entry price, stop loss, and take profit levels on your chart.
5.Monitor the ADX value to ensure that the market is trending strongly.
6.If the trade meets your criteria, enter the trade at the indicated price.
Set your stop loss and take profit orders as indicated by the script.
Key Notes
# This strategy is designed for both trending and mean-reversion markets depending on the asset and the ADX value.
# Make sure to practice proper risk management by adjusting the stop loss and position size based on your risk tolerance.
Trend Type Indicator by BobRivera990Usage:
The purpose of this indicator is to programmatically determine the type of price trend using technical analysis tools.
You can do a quick check on the asset’s higher and lower time frames. For example, if you are trading on an H1 chart, you can check the m5 chart to ensure that the trend is in the same direction and similarly check the H4 chart to ensure that the higher time frame price is also moving in the same direction.
If multiple time frame charts confirm a similar trend, then it is considered a very strong trend and ideal for Trend trading.
Remarks:
By default, the last status is related to 8 periods before the latest closing price.
Related definitions:
The three basic types of trends are up, down, and sideways.
1. Uptrend
An uptrend describes the price movement of a financial asset when the overall direction is upward. The uptrend is composed of higher swing lows and higher swing highs.
Some market participants ("long" trend traders) only choose to trade during uptrends.
2. Downtrend
A downtrend refers to the price action of a security that moves lower in price as it fluctuates over time.
The downtrend is composed of lower swing lows and lower swing highs.
3. Sideways
A sideways trend is the horizontal price movement that occurs when the forces of supply and demand are nearly equal. This typically occurs during a period of consolidation before the price continues a prior trend or reverses into a new trend.
How it works:
Step 1: Sideways Trend Detection
In this step we want to distinguish the sideways trend from uptrend and downtrend. For this purpose, we use two common technical analysis tools: ATR and ADX
1. Average True Range (ATR)
The average true range (ATR) is a technical analysis indicator that measures market volatility.
We also use a 20-period moving average of the ATR.
When the ATR is below the average of its last 20-periods, it means that the rate of price volatility has decreased and we conclude that the current trend is sideways
2. Average Directional Index (ADX)
The average directional index (ADX) is a technical analysis indicator used by some traders to determine the strength of a trend.
The trend has strength when ADX is above 25.
So when the ADX is less than or equal to 25, there is no strong trend, and we conclude that the current type of trend is sideways.
Step 2: Detect uptrend from downtrend
If it turns out that the current price trend is not sideways, then it is either uptrend or downtrend.
For this purpose, we use plus and minus directional Indicators (+ DI & -DI).
A general interpretation would be that during a strong trend, when +DI is higher than -DI, it is an uptrend. When -DI is higher than +DI, it is a downtrend.
Parameters:
"Use ATR …" ________________________// Use Average True Range (ATR) to detect Sideways Movements
"ATR Length"_______________________ // length of the Average True Range (ATR) used to detect Sideways Movements
"ATR Moving Average Type" ___________// Type of the moving average of the ATR used to detect Sideways Movements
"ATR MA Length" ____________________// length of the moving average of the ATR used to detect Sideways Movements
"Use ADX ..."_______________________ // Use Average Directional Index (ADX) to detect Sideways Movements
"ADX Smoothing”____________________// length of the Average Directional Index (ADX) used to detect Sideways Movements
"DI Length"_________________________// length of the Plus and Minus Directional Indicators (+DI & -DI) used to determine the direction of the trend
"ADX Limit" ________________________// A level of ADX used as the boundary between Trend Market and Sideways Market
"Smoothing Factor"__________________// Factor used for smoothing the oscillator
"Lag"______________________________// lag used to match indicator and chart
Resources:
www.investopedia.com

SpectreSPECTRE - Precision Reversal Detection System
OVERVIEW
Spectre is a channel breakout indicator designed to identify high-probability reversal points by combining Donchian channel breaches with momentum confirmation. It generates BUY signals at oversold extremes and SELL signals at overbought extremes, filtered by trend strength to avoid low-conviction setups.
This indicator replaces the Regime Engine, which will continue to evolve independently as an experimental platform for testing new strategies and enhancements. Spectre was selected as the production replacement based on extensive backtesting across multiple assets and timeframes, which demonstrated superior win rates compared to alternative sell logic approaches (RSI-based exits outperformed CMO-based exits in 13 of 18 test configurations).
SIGNAL LOGIC
BUY CONDITIONS (all must be true):
Price touches or breaks below Donchian lower band
RSI is at or below oversold threshold (default: 35)
ADX confirms sufficient trend strength (default: ≥22)
BBWP confirms adequate volatility (default: ≥20%)
Cooldown period has elapsed since last buy
Cascade limit not reached
SELL CONDITIONS (all must be true):
Price touches or breaks above Donchian upper band
RSI is at or above overbought threshold (default: 70)
ADX confirms sufficient trend strength (default: ≥22)
BBWP confirms adequate volatility (default: ≥20%)
Cooldown period has elapsed since last sell
Cascade limit not reached
Price is not underwater (if protection enabled)
KEY FEATURES
NON-REPAINTING DONCHIAN CHANNELS
Uses previous bar's high/low extremes to prevent signal repainting. What you see in history is what you would have seen in real-time.
MULTI-FACTOR CONFIRMATION
Signals require agreement between price action (Donchian), momentum (RSI), and trend strength (ADX) to filter out low-quality setups.
VOLATILITY FILTER (BBWP)
Bollinger Band Width Percentile measures current volatility relative to historical norms. Low BBWP indicates compressed ranges where breakouts are less reliable - signals are blocked until volatility returns.
CASCADE PROTECTION
Limits consecutive signals in the same direction to prevent overexposure during extended trends. Resets when a signal fires in the opposite direction.
UNDERWATER PROTECTION (Unique to Spectre)
Tracks average entry price of recent buys and blocks sell signals when price has fallen significantly below this level. This prevents locking in large losses during drawdowns and allows positions to recover before exiting.
REGIME DETECTION
Visual background shading indicates current market regime based on Directional Indicator spread and On-Balance Volume trend. Green indicates bullish regime (+DI > -DI, OBV rising). Red indicates bearish regime (-DI > +DI, OBV falling). White/Gray indicates neutral or ranging conditions.
RECOMMENDED SETTINGS BY TIMEFRAME
For 5-minute charts, use RSI Buy 30-35, RSI Sell 70-75, ADX 20-24.
For 15-minute charts, use RSI Buy 30-35, RSI Sell 68-72, ADX 22-26.
For 30-minute charts (default), use RSI Buy 32-38, RSI Sell 68-72, ADX 22-26.
For 1-hour charts, use RSI Buy 35-40, RSI Sell 65-70, ADX 20-24.
For 4-hour charts, use RSI Buy 35-40, RSI Sell 65-70, ADX 18-22.
These are starting points - optimize for your specific assets.
INFO PANEL GUIDE
Regime shows current market bias (Bullish/Bearish/Neutral). RSI shows current value with buy/sell threshold status. ADX shows trend strength categorized as Weak (<15), Range (15-24), Trend (24-34), or Strong (>34). BBWP shows volatility percentile with a warning symbol when below minimum. Donchian shows price position relative to channel bands. Avg Buy shows average entry price and underwater status. Cascade shows current consecutive signal counts versus limits.
USAGE TIPS
Works best in ranging or mean-reverting markets
Reduce RSI thresholds in strong trends (tighter = fewer signals)
Increase ADX minimum in choppy markets to filter noise
Enable underwater protection for swing trading, disable for scalping
Use regime background to contextualize signals (buy in green, sell in red)
Combine with support/resistance levels for additional confirmation

Helix Protocol 7Helix Protocol 7
Overview
Helix Protocol 7 is a trend-adaptive signal engine that automatically adjusts its buy and sell criteria based on current market conditions. Rather than using fixed thresholds that work well in some environments but fail in others, Helix detects whether the market is in a strong uptrend, neutral consolidation, or downtrend, then applies the appropriate signal parameters for each state. This adaptive approach helps traders buy dips aggressively in confirmed uptrends while requiring much stricter conditions before buying in downtrends.
Core Philosophy
The fundamental insight behind Helix is that the same indicator readings mean different things in different market contexts. An RSI of 45 during a strong uptrend represents a healthy pullback and buying opportunity. That same RSI of 45 during a confirmed downtrend might just be a brief pause before further decline. Helix encodes this context-awareness directly into its signal logic.
The Money Line
At the center of the indicator is the Money Line, which can be configured as either a linear regression line or a weighted combination of exponential moving averages. Linear regression provides a mathematically optimal fit through recent price data, while the weighted EMA option offers more responsiveness to recent price action. The slope of the Money Line determines whether the immediate price trend is bullish, bearish, or neutral, which affects the color of the bands and cloud shading.
Dynamic Envelope Bands
Upper and lower bands are calculated using Average True Range multiplied by a dynamic factor. When ADX indicates trending conditions, the bands automatically widen to accommodate larger price swings. The Chaikin Accumulation/Distribution indicator also influences band width, with strong accumulation or distribution causing additional band expansion. This dual adaptation helps the bands remain relevant across different volatility regimes.
Trend State Detection
Helix classifies market conditions into four distinct states using a combination of ADX behavior and Directional Movement analysis.
Strong Uptrend requires ADX to be rising (gaining momentum), ADX value above a threshold (default 25), and the positive directional indicator exceeding the negative. This combination confirms not just that price is rising, but that the trend is strengthening.
Strong Downtrend uses the same ADX requirements but with the negative directional indicator dominant. This identifies accelerating downward momentum.
Weak Downtrend is detected when ADX is falling (trend losing steam) but negative DI still exceeds positive DI. This often represents the exhaustion phase of a decline.
Neutral applies when none of the above conditions are met, typically during consolidation or when directional indicators are close together.
Adaptive Signal Thresholds
The indicator uses Fisher Transform and RSI as its primary oscillators, but the trigger levels change based on trend state.
During Strong Uptrend, buy conditions are relaxed significantly. The Fisher threshold might be set to 1.0 (only slightly below neutral) and RSI to 50, allowing entries on minor pullbacks within the established trend. Sell conditions are tightened, requiring Fisher above 2.5 and RSI above 70, letting winning positions run longer.
During Neutral conditions, both buy and sell thresholds return to traditional oversold and overbought levels. Fisher must reach -2.0 for buys and +2.0 for sells, with RSI requirements around 30 and 65 respectively.
During Downtrend, buy conditions become very strict. Fisher must reach extreme oversold levels like -2.5 and RSI must drop below 25, ensuring buys only trigger on genuine capitulation. Sell conditions are loosened, allowing exits on any meaningful bounce.
This asymmetric approach embodies the trading principle of being aggressive when conditions favor you and defensive when they do not.
Band Touch Signals
In addition to oscillator-based signals, Helix generates signals when price touches the dynamic bands. A touch of the lower band indicates potential support and generates a buy signal. A touch of the upper band suggests potential resistance and generates a sell signal. These band-based signals work alongside the oscillator signals, providing entries even when Fisher and RSI have not reached their thresholds.
Extreme Move Detection
Sometimes price moves so violently that it penetrates the bands by an unusual amount. Helix measures this penetration depth as a percentage of ATR and can flag these as "extreme" signals. Extreme signals have special properties: they can fire intra-bar (before the candle closes) to catch wick entries, they can bypass normal cooldown periods, and they can optionally bypass volatility freezes. This allows the indicator to capture panic selling events that might be missed by waiting for candle closes.
Cascade Protection System
A critical feature for risk management is the built-in cascade protection that prevents averaging down into oblivion. The system has two components.
First, it tracks Bollinger Band Width Percentile, which measures current volatility relative to its historical range. When BBWP exceeds a threshold (default 92%), indicating a volatility spike often associated with sharp directional moves, all buy signals are temporarily frozen. This prevents entries during the most dangerous market conditions.
Second, it counts consecutive buy signals without an intervening sell. After reaching the maximum (default 3), no additional buy signals are generated until a sell occurs. This absolute limit prevents the common mistake of repeatedly buying a falling asset.
The protection status is displayed in the information panel, showing current BBWP level and the consecutive buy count.
RSI Divergence Detection
Helix includes automatic detection of RSI divergences, which often precede trend reversals. Regular bullish divergence occurs when price makes a lower low but RSI makes a higher low, suggesting weakening downside momentum. Regular bearish divergence is the opposite pattern at tops. Hidden divergences, which suggest trend continuation rather than reversal, are also detected and can be displayed optionally. Divergence lines are drawn directly on the price chart connecting the relevant pivot points.
Signal Cooldown
To prevent signal clustering and overtrading, a configurable cooldown period prevents new signals for a set number of bars after each signal. This ensures each signal represents a distinct trading opportunity.
Visual Components
The indicator provides comprehensive visual feedback. The Money Line changes color based on slope direction. The cloud shading between bands reflects trend bias. An ADX bar at the bottom of the chart uses color coding to show trend state at a glance: lime for strong uptrend, red for downtrend, white for ranging (very low ADX), orange for flat, and blue for trending but not yet strong.
Price labels appear at signal locations showing the entry or exit price, the trigger type (band touch, uptrend dip, capitulation, etc.), and the current position in the consecutive buy count.
The information panel displays current trend state, divergence status, BBWP freeze status, buy counter, ADX with direction arrow, DI spread, Fisher and RSI values, and the current active thresholds for buy and sell signals. A compact mode is available for mobile devices.
How to Use
In strong uptrends, look for buy signals on pullbacks to the Money Line or lower band. The relaxed thresholds will generate more frequent entries, which is appropriate when trend momentum is confirmed. Consider letting sell signals pass if the trend remains strong.
In neutral markets, treat signals more selectively. Both buy and sell signals require significant oscillator extremes, making them higher-probability but less frequent.
In downtrends, exercise extreme caution with buy signals. The strict requirements mean buys only trigger on major oversold conditions. Respect sell signals promptly, as the loosened thresholds are designed to protect capital.
Always monitor the cascade protection status. If BBWP shows frozen or the buy counter is at maximum, the indicator is warning you that conditions are dangerous for new long entries.
Settings Guidance
The default settings are calibrated for cryptocurrency markets on 5-minute timeframes. For other assets or timeframes, consider adjusting the ADX threshold for strong trend detection (lower for less volatile assets), the Fisher and RSI thresholds for each trend state, and the BBWP freeze level based on the asset's typical volatility profile.
The indicator includes a debug panel that can be enabled to show the detailed state of all conditions, useful for understanding why signals are or are not firing.

ZENADX Flow DI+ DI-ZENADX Flow Di+ Di- — Modified ADX/DI Trend Structure
This indicator is a refined and brand-aligned enhancement of the classic ADX, +DI, and –DI system, inspired by the original open-source work of Gustavo Cardelle (Gu5).
The ZENADX Flow version focuses on clear trend interpretation, minimal visual noise, and stable performance for discretionary and algorithmic traders.
🔍 What This Indicator Does
ADX Line (White Base Tone)
Shows overall trend strength. Rising ADX = strengthening trend.
Color-Coded ADX Flow
Green shades → Bullish directional strength
Red shades → Bearish directional strength
White → Low ADX / ranging market
+DI and –DI Structure
Helps identify which side (buyers or sellers) currently controls momentum.
DI Cross (Yellow Signal Marker)
Highlights potential trend-shift zones where +DI and –DI intersect.
Trend Markers Above the Indicator
Bullish Trend
Bearish Trend
Strong Bullish
Strong Bearish
End Trend (trend exhaustion)
✨ Improvements in the ZENADX Flow Edition
New optimized defaults: DI Length = 8, Range Level = 25, Trend Level = 25
Cleaned color logic for clarity and emotional neutrality
Removed bar-coloring to keep price action clean
Alerts remain always available (no toggle required)
Fully rewritten into safe, stable Pine formatting to avoid syntax issues
📌 Recommended For
Trend-followers
Momentum traders
Algo developers using DI/ADX states
Reversal detection (via DI Cross)
🧭 ZENADX Flow Research
Developed and refined under the ZENADX Flow Research methodology, focusing on:
Simplicity
Psychological clarity
Consistency
Actionable trend structure
📝 License
This work extends the original script by Gustavo Cardelle (Gu5) and follows the same license:
Attribution–NonCommercial 4.0 International (CC BY-NC 4.0)
-------------------------------------------------------------------
ZENADX Flow Di+ Di- — ระบบวิเคราะห์เทรนด์ ADX/DI เวอร์ชันปรับปรุง
อินดิเคเตอร์ตัวนี้เป็นการพัฒนาและปรับปรุงจากโครงสร้างดั้งเดิมของ ADX / +DI / –DI โดยอ้างอิงจากงานต้นฉบับของ Gustavo Cardelle (Gu5)
เวอร์ชัน ZENADX Flow ถูกออกแบบให้ อ่านง่าย ชัดเจน และรองรับการใช้งานทั้งเทรดมืออาชีพและระบบอัตโนมัติ
🔍 สิ่งที่อินดิเคเตอร์นี้ช่วยให้เห็น
ADX สีขาวเป็นฐาน
แสดง “ความแข็งแรงของเทรนด์” (ไม่ใช่ทิศทาง)
โทนสีบอกพลังเทรนด์
เขียวเข้ม/อ่อน → เทรนด์ขาขึ้นกำลังแข็งแรง/อ่อน
แดงเข้ม/อ่อน → เทรนด์ขาลงกำลังแข็งแรง/อ่อน
ขาว → ช่วงตลาด Sideway / เทรนด์อ่อน
+DI / –DI
ช่วยบอกว่าซื้อหรือขายกำลังคุมตลาดอยู่
DI Cross (จุดสีเหลือง)
เป็นสัญญาณเปลี่ยนโมเมนตัมที่สำคัญ
สัญลักษณ์เหนืออินดิเคเตอร์
Bullish Trend
Bearish Trend
Strong Bullish
Strong Bearish
End Trend (จบเทรนด์)
✨ สิ่งที่ปรับปรุงในเวอร์ชัน ZENADX Flow
ค่าเริ่มต้นใหม่ที่เหมาะกับ Flow Trading: DI = 8, Range = 25, Trend = 25
ลบ bar-coloring เพื่อให้กราฟสะอาด
ระบบสีอ่านง่าย ไม่ปนกัน
Alerts ทำงานพร้อมใช้ทันที
จัด Code Format แบบ “Safe Format” เพื่อป้องกัน error ขณะแก้ไข
🧭 พัฒนาโดย ZENADX Flow Research
ยึดหลักสำคัญของ ZENADX คือ
ความเรียบง่าย
ความชัดเจนทางจิตวิทยา
ความสม่ำเสมอ
มุ่งเน้นเทรนด์ที่ “ไหล” ตามโครงสร้างตลาดจริง
📝 License
สคริปต์นี้พัฒนาต่อยอดจากอินดิเคเตอร์ต้นฉบับของ Gustavo Cardelle (Gu5)
และยังใช้สัญญาอนุญาตเดียวกัน:
Attribution–NonCommercial 4.0 International (CC BY-NC 4.0)

Kernel Market Dynamics [WFO - MAB]Kernel Market Dynamics
⚛️ CORE INNOVATION: KERNEL-BASED DISTRIBUTION ANALYSIS
The Kernel Market Dynamics system represents a fundamental departure from traditional technical indicators. Rather than measuring price levels, momentum, or oscillator extremes, KMD analyzes the statistical distribution of market returns using advanced kernel methods from machine learning theory. This allows the system to detect when market behavior has fundamentally changed—not just when price has moved, but when the underlying probability structure has shifted.
The Distribution Hypothesis:
Traditional indicators assume markets move in predictable patterns. KMD assumes something more profound: markets exist in distinct distributional regimes , and profitable trading opportunities emerge during regime transitions . When the distribution of recent returns diverges significantly from the historical baseline, the market is restructuring—and that's when edge exists.
Maximum Mean Discrepancy (MMD):
At the heart of KMD lies a sophisticated statistical metric called Maximum Mean Discrepancy. MMD measures the distance between two probability distributions by comparing their representations in a high-dimensional feature space created by a kernel function.
The Mathematics:
Given two sets of normalized returns:
• Reference period (X) : Historical baseline (default 100 bars)
• Test period (Y) : Recent behavior (default 20 bars)
MMD is calculated as:
MMD² = E + E - 2·E
Where:
• E = Expected kernel similarity within reference period
• E = Expected kernel similarity within test period
• E = Expected cross-similarity between periods
When MMD is low : Test period behaves like reference (stable regime)
When MMD is high : Test period diverges from reference (regime shift)
The final MMD value is smoothed with EMA(5) to reduce single-bar noise while maintaining responsiveness to genuine distribution changes.
The Kernel Functions:
The kernel function defines how similarity is measured. KMD offers four mathematically distinct kernels, each with different properties:
1. RBF (Radial Basis Function / Gaussian):
• Formula: k(x,y) = exp(-d² / (2·σ²·scale))
• Properties: Most sensitive to distribution changes, smooth decision boundaries
• Best for: Clean data, clear regime shifts, low-noise markets
• Sensitivity: Highest - detects subtle changes
• Use case: Stock indices, major forex pairs, trending environments
2. Laplacian:
• Formula: k(x,y) = exp(-|d| / σ)
• Properties: Medium sensitivity, robust to moderate outliers
• Best for: Standard market conditions, balanced noise/signal
• Sensitivity: Medium - filters minor fluctuations
• Use case: Commodities, standard timeframes, general trading
3. Cauchy (Default - Most Robust):
• Formula: k(x,y) = 1 / (1 + d²/σ²)
• Properties: Heavy-tailed, highly robust to outliers and spikes
• Best for: Noisy markets, choppy conditions, crypto volatility
• Sensitivity: Lower - only major distribution shifts trigger
• Use case: Cryptocurrencies, illiquid markets, volatile instruments
4. Rational Quadratic:
• Formula: k(x,y) = (1 + d²/(2·α·σ²))^(-α)
• Properties: Tunable via alpha parameter, mixture of RBF kernels
• Alpha < 1.0: Heavy tails (like Cauchy)
• Alpha > 3.0: Light tails (like RBF)
• Best for: Adaptive use, mixed market conditions
• Use case: Experimental optimization, regime-specific tuning
Bandwidth (σ) Parameter:
The bandwidth controls the "width" of the kernel, determining sensitivity to return differences:
• Low bandwidth (0.5-1.5) : Narrow kernel, very sensitive
- Treats small differences as significant
- More MMD spikes, more signals
- Use for: Scalping, fast markets
• Medium bandwidth (1.5-3.0) : Balanced sensitivity (recommended)
- Filters noise while catching real shifts
- Professional-grade signal quality
- Use for: Day/swing trading
• High bandwidth (3.0-10.0) : Wide kernel, less sensitive
- Only major distribution changes register
- Fewer, stronger signals
- Use for: Position trading, trend following
Adaptive Bandwidth:
When enabled (default ON), bandwidth automatically scales with market volatility:
Effective_BW = Base_BW × max(0.5, min(2.0, 1 / volatility_ratio))
• Low volatility → Tighter bandwidth (0.5× base) → More sensitive
• High volatility → Wider bandwidth (2.0× base) → Less sensitive
This prevents signal flooding during wild markets and avoids signal drought during calm periods.
Why Kernels Work:
Kernel methods implicitly map data to infinite-dimensional space where complex, nonlinear patterns become linearly separable. This allows MMD to detect distribution changes that simpler statistics (mean, variance) would miss. For example:
• Same mean, different shape : Traditional metrics see nothing, MMD detects shift
• Same volatility, different skew : Oscillators miss it, MMD catches it
• Regime rotation : Price unchanged, but return distribution restructured
The kernel captures the entire distributional signature —not just first and second moments.
🎰 MULTI-ARMED BANDIT FRAMEWORK: ADAPTIVE STRATEGY SELECTION
Rather than forcing one strategy on all market conditions, KMD implements a Multi-Armed Bandit (MAB) system that learns which of seven distinct strategies performs best and dynamically selects the optimal approach in real-time.
The Seven Arms (Strategies):
Each arm represents a fundamentally different trading logic:
ARM 0 - MMD Regime Shift:
• Logic: Distribution divergence with directional bias
• Triggers: MMD > threshold AND direction_bias confirmed AND velocity > 5%
• Philosophy: Trade the regime transition itself
• Best in: Volatile shifts, breakout moments, crisis periods
• Weakness: False alarms in choppy consolidation
ARM 1 - Trend Following:
• Logic: Aligned EMAs with strong ADX
• Triggers: EMA(9) > EMA(21) > EMA(50) AND ADX > 25
• Philosophy: Ride established momentum
• Best in: Strong trending regimes, directional markets
• Weakness: Late entries, whipsaws at reversals
ARM 2 - Breakout:
• Logic: Bollinger Band breakouts with volume
• Triggers: Price crosses BB outer band AND volume > 1.2× average
• Philosophy: Capture volatility expansion events
• Best in: Range breakouts, earnings, news events
• Weakness: False breakouts in ranging markets
ARM 3 - RSI Mean Reversion:
• Logic: RSI extremes with reversal confirmation
• Triggers: RSI < 30 with uptick OR RSI > 70 with downtick
• Philosophy: Fade overbought/oversold extremes
• Best in: Ranging markets, mean-reverting instruments
• Weakness: Fails in strong trends, catches falling knives
ARM 4 - Z-Score Statistical Reversion:
• Logic: Price deviation from 50-period mean
• Triggers: Z-score < -2 (oversold) OR > +2 (overbought) with reversal
• Philosophy: Statistical bounds reversion
• Best in: Stable volatility regimes, pairs trading
• Weakness: Trend continuation through extremes
ARM 5 - ADX Momentum:
• Logic: Strong directional movement with acceleration
• Triggers: ADX > 30 with DI+ or DI- strengthening
• Philosophy: Momentum begets momentum
• Best in: Trending with increasing velocity
• Weakness: Late exits, momentum exhaustion
ARM 6 - Volume Confirmation:
• Logic: OBV trend + volume spike + candle direction
• Triggers: OBV > EMA(20) AND volume > average AND bullish candle
• Philosophy: Follow institutional money flow
• Best in: Liquid markets with reliable volume
• Weakness: Manipulated volume, thin markets
Q-Learning with Rewards:
Each arm maintains a Q-value representing its expected reward. After every bar, the system calculates a reward based on the arm's signal and actual price movement:
Reward Calculation:
If arm signaled LONG:
reward = (close - close ) / close
If arm signaled SHORT:
reward = -(close - close ) / close
If arm signaled NEUTRAL:
reward = 0
Penalty multiplier: If loss > 0.5%, reward × 1.3 (punish big losses harder)
Q-Value Update (Exponential Moving Average):
Q_new = Q_old + α × (reward - Q_old)
Where α (learning rate, default 0.08) controls adaptation speed:
• Low α (0.01-0.05): Slow, stable learning
• Medium α (0.06-0.12): Balanced (recommended)
• High α (0.15-0.30): Fast, reactive learning
This gradually shifts Q-values toward arms that generate positive returns and away from losing arms.
Arm Selection Algorithms:
KMD offers four mathematically distinct selection strategies:
1. UCB1 (Upper Confidence Bound) - Recommended:
Formula: Select arm with max(Q_i + c·√(ln(t)/n_i))
Where:
• Q_i = Q-value of arm i
• c = exploration constant (default 1.5)
• t = total pulls across all arms
• n_i = pulls of arm i
Philosophy: Balance exploitation (use best arm) with exploration (try uncertain arms). The √(ln(t)/n_i) term creates an "exploration bonus" that decreases as an arm gets more pulls, ensuring all arms get sufficient testing.
Theoretical guarantee: Logarithmic regret bound - UCB1 provably converges to optimal arm selection over time.
2. UCB1-Tuned (Variance-Aware UCB):
Formula: Select arm with max(Q_i + √(ln(t)/n_i × min(0.25, V_i + √(2·ln(t)/n_i))))
Where V_i = variance of rewards for arm i
Philosophy: Incorporates reward variance into exploration. Arms with high variance (unpredictable) get less exploration bonus, focusing effort on stable performers.
Better bounds than UCB1 in practice, slightly more conservative exploration.
3. Epsilon-Greedy (Simple Random):
Algorithm:
With probability ε: Select random arm (explore)
With probability 1-ε: Select highest Q-value arm (exploit)
Default ε = 0.10 (10% exploration, 90% exploitation)
Philosophy: Simplest algorithm, easy to understand. Random exploration ensures all arms stay updated but may waste time on clearly bad arms.
4. Thompson Sampling (Bayesian):
The most sophisticated selection algorithm, using true Bayesian probability.
Each arm maintains Beta distribution parameters:
• α (alpha) = successes + 1
• β (beta) = failures + 1
Selection Process:
1. Sample θ_i ~ Beta(α_i, β_i) for each arm using Marsaglia-Tsang Gamma sampler
2. Select arm with highest sample: argmax_i(θ_i)
3. After reward, update:
- If reward > 0: α += |reward| × 100 (increment successes)
- If reward < 0: β += |reward| × 100 (increment failures)
Why Thompson Sampling Works:
The Beta distribution naturally represents uncertainty about an arm's true win rate. Early on with few trials, the distribution is wide (high uncertainty), leading to more exploration. As evidence accumulates, it narrows around the true performance, naturally shifting toward exploitation.
Unlike UCB which uses deterministic confidence bounds, Thompson Sampling is probabilistic—it samples from the posterior distribution of each arm's success rate, providing automatic exploration/exploitation balance without tuning.
Comparison:
• UCB1: Deterministic, guaranteed regret bounds, requires tuning exploration constant
• Thompson: Probabilistic, natural exploration, no tuning required, best empirical performance
• Epsilon-Greedy: Simplest, consistent exploration %, less efficient
• UCB1-Tuned: UCB1 + variance awareness, best for risk-averse
Exploration Constant (c):
For UCB algorithms, this multiplies the exploration bonus:
• Low c (0.5-1.0): Strongly prefer proven arms, rare exploration
• Medium c (1.2-1.8): Balanced (default 1.5)
• High c (2.0-3.0): Frequent exploration, diverse arm usage
Higher exploration constant in volatile/unstable markets, lower in stable trending environments.
🔬 WALK-FORWARD OPTIMIZATION: PREVENTING OVERFITTING
The single biggest problem in algorithmic trading is overfitting—strategies that look amazing in backtest but fail in live trading because they learned noise instead of signal. KMD's Walk-Forward Optimization system addresses this head-on.
How WFO Works:
The system divides time into repeating cycles:
1. Training Window (default 500 bars): Learn arm Q-values on historical data
2. Testing Window (default 100 bars): Validate on unseen "future" data
Training Phase:
• All arms accumulate rewards and update Q-values normally
• Q_train tracks in-sample performance
• System learns which arms work on historical data
Testing Phase:
• System continues using arms but tracks separate Q_test metrics
• Counts trades per arm (N_test)
• Testing performance is "out-of-sample" relative to training
Validation Requirements:
An arm is only "validated" (approved for live use) if:
1. N_test ≥ Minimum Trades (default 10): Sufficient statistical sample
2. Q_test > 0 : Positive out-of-sample performance
Arms that fail validation are blocked from generating signals, preventing the system from trading strategies that only worked on historical data.
Performance Decay:
At the end of each WFO cycle, all Q-values decay exponentially:
Q_new = Q_old × decay_rate (default 0.95)
This ensures old performance doesn't dominate forever. An arm that worked 10 cycles ago but fails recently will eventually lose influence.
Decay Math:
• 0.95 decay after 10 periods → 0.95^10 = 0.60 (40% forgotten)
• 0.90 decay after 10 periods → 0.90^10 = 0.35 (65% forgotten)
Fast decay (0.80-0.90): Quick adaptation, forgets old patterns rapidly
Slow decay (0.96-0.99): Stable, retains historical knowledge longer
WFO Efficiency Metric:
The key metric revealing overfitting:
Efficiency = (Q_test / Q_train) for each validated arm, averaged
• Efficiency > 0.8 : Excellent - strategies generalize well (LOW overfit risk)
• Efficiency 0.5-0.8 : Acceptable - moderate generalization (MODERATE risk)
• Efficiency < 0.5 : Poor - strategies curve-fitted to history (HIGH risk)
If efficiency is low, the system has learned noise. Training performance was good but testing (forward) performance is weak—classic overfitting.
The dashboard displays real-time WFO efficiency, allowing users to gauge system robustness. Low efficiency should trigger parameter review or reduced position sizing.
Why WFO Matters:
Consider two scenarios:
Scenario A - No WFO:
• Arm 3 (RSI Reversion) shows Q-value of 0.15 on all historical data
• System trades it aggressively
• Reality: It only worked during one specific ranging period
• Live trading: Fails because market has trended since backtest
Scenario B - With WFO:
• Arm 3 shows Q_train = 0.15 (good in training)
• But Q_test = -0.05 (loses in testing) with 12 test trades
• N_test ≥ 10 but Q_test < 0 → Arm BLOCKED
• System refuses to trade it despite good backtest
• Live trading: Protected from false strategy
WFO ensures only strategies that work going forward get used, not just strategies that fit the past.
Optimal Window Sizing:
Training Window:
• Too short (100-300): May learn recent noise, insufficient data
• Too long (1000-2000): May include obsolete market regimes
• Recommended: 4-6× testing window (default 500)
Testing Window:
• Too short (50-80): Insufficient validation, high variance
• Too long (300-500): Delayed adaptation to regime changes
• Recommended: 1/5 to 1/4 of training (default 100)
Minimum Trades:
• Too low (5-8): Statistical noise, lucky runs validate
• Too high (30-50): Many arms never validate, system rarely trades
• Recommended: 10-15 (default 10)
⚖️ WEIGHTED CONFLUENCE SYSTEM: MULTI-FACTOR SIGNAL QUALITY
Not all signals are created equal. KMD implements a sophisticated 100-point quality scoring system that combines eight independent factors with different importance weights.
The Scoring Framework:
Each potential signal receives a quality score from 0-100 by accumulating points from aligned factors:
CRITICAL FACTORS (20 points each):
1. Bandit Arm Alignment (20 points):
• Full points if selected arm's signal matches trade direction
• Zero points if arm disagrees
• Weight: Highest - the bandit selected this arm for a reason
2. MMD Regime Quality (20 points):
• Requires: MMD > dynamic threshold AND directional bias confirmed
• Scaled by MMD percentile (how extreme vs history)
• If MMD in top 10% of history: 100% of 20 points
• If MMD at 50th percentile: 50% of 20 points
• Weight: Highest - distribution shift is the core signal
HIGH IMPACT FACTORS (15 points each):
3. Trend Alignment (15 points):
• Full points if EMA(9) > EMA(21) > EMA(50) for longs (inverse for shorts)
• Scaled by ADX strength:
- ADX > 25: 100% (1.0× multiplier) - strong trend
- ADX 20-25: 70% (0.7× multiplier) - moderate trend
- ADX < 20: 40% (0.4× multiplier) - weak trend
• Weight: High - trend is friend, alignment increases probability
4. Volume Confirmation (15 points):
• Requires: OBV > EMA(OBV, 20) aligned with direction
• Scaled by volume ratio: vol_current / vol_average
- Volume 1.5×+ average: 100% of points (institutional participation)
- Volume 1.0-1.5× average: 67% of points (above average)
- Volume below average: 0 points (weak conviction)
• Weight: High - volume validates price moves
MODERATE FACTORS (10 points each):
5. Market Structure (10 points):
• Full points (10) if bullish structure (higher highs, higher lows) for longs
• Partial points (6) if near support level (within 1% of swing low)
• Similar logic inverted for bearish trades
• Weight: Moderate - structure context improves entries
6. RSI Positioning (10 points):
• For long signals:
- RSI < 50: 100% of points (1.0× multiplier) - room to run
- RSI 50-60: 60% of points (0.6× multiplier) - neutral
- RSI 60-70: 30% of points (0.3× multiplier) - elevated
- RSI > 70: 0 points (0× multiplier) - overbought
• Inverse for short signals
• Weight: Moderate - momentum context, not primary signal
BONUS FACTORS (10 points each):
7. Divergence (10 points):
• Full 10 points if bullish divergence detected for long (or bearish for short)
• Zero points otherwise
• Weight: Bonus - leading indicator, adds confidence when present
8. Multi-Timeframe Confirmation (10 points):
• Full 10 points if higher timeframe aligned (HTF EMA trending same direction, RSI supportive)
• Zero points if MTF disabled or HTF opposes
• Weight: Bonus - macro context filter, prevents counter-trend disasters
Total Maximum: 110 points (20+20+15+15+10+10+10+10)
Signal Quality Calculation:
Quality Score = (Accumulated_Points / Maximum_Possible) × 100
Where Maximum_Possible = 110 points if all factors active, adjusts if MTF disabled.
Example Calculation:
Long signal candidate:
• Bandit Arm: +20 (arm signals long)
• MMD Quality: +16 (MMD high, 80th percentile)
• Trend: +11 (EMAs aligned, ADX = 22 → 70% × 15)
• Volume: +10 (OBV rising, vol 1.3× avg → 67% × 15 = 10)
• Structure: +10 (higher lows forming)
• RSI: +6 (RSI = 55 → 60% × 10)
• Divergence: +0 (none present)
• MTF: +10 (HTF bullish)
Total: 83 / 110 × 100 = 75.5% quality score
This is an excellent quality signal - well above threshold (default 60%).
Quality Thresholds:
• Score 80-100 : Exceptional setup - all factors aligned
• Score 60-80 : High quality - most factors supportive (default minimum)
• Score 40-60 : Moderate - mixed confluence, proceed with caution
• Score 20-40 : Weak - minimal support, likely filtered out
• Score 0-20 : Very weak - almost certainly blocked
The minimum quality threshold (default 60) is the gatekeeper. Only signals scoring above this value can trigger trades.
Dynamic Threshold Adjustment:
The system optionally adjusts the threshold based on historical signal distribution:
If Dynamic Threshold enabled:
Recent_MMD_Mean = SMA(MMD, 50)
Recent_MMD_StdDev = StdDev(MMD, 50)
Dynamic_Threshold = max(Base_Threshold × 0.5,
min(Base_Threshold × 2.0,
MMD_Mean + MMD_StdDev × 0.5))
This auto-calibrates to market conditions:
• Quiet markets (low MMD): Threshold loosens (0.5× base)
• Active markets (high MMD): Threshold tightens (2× base)
Signal Ranking Filter:
When enabled, the system tracks the last 100 signal quality scores and only fires signals in the top percentile.
If Ranking Percentile = 75%:
• Collect last 100 signal scores in memory
• Sort ascending
• Threshold = Score at 75th percentile position
• Only signals ≥ this threshold fire
This ensures you're only taking the cream of the crop —top 25% of signals by quality, not every signal that technically qualifies.
🚦 SIGNAL GENERATION: TRANSITION LOGIC & COOLDOWNS
The confluence system determines if a signal qualifies , but the signal generation logic controls when triangles appear on the chart.
Core Qualification:
For a LONG signal to qualify:
1. Bull quality score ≥ signal threshold (default 60)
2. Selected arm signals +1 (long)
3. Cooldown satisfied (bars since last signal ≥ cooldown period)
4. Drawdown protection OK (current drawdown < pause threshold)
5. MMD ≥ 80% of dynamic threshold (slight buffer below full threshold)
For a SHORT signal to qualify:
1. Bear quality score ≥ signal threshold
2. Selected arm signals -1 (short)
3-5. Same as long
But qualification alone doesn't trigger a chart signal.
Three Signal Modes:
1. RESPONSIVE (Default - Recommended):
Signals appear on:
• Fresh qualification (wasn't qualified last bar, now is)
• Direction reversal (was qualified short, now qualified long)
• Quality improvement (already qualified, quality jumps 25%+ during EXTREME regime)
This mode shows new opportunities and significant upgrades without cluttering the chart with repeat signals.
2. TRANSITION ONLY:
Signals appear on:
• Fresh qualification only
• Direction reversal only
This is the cleanest mode - signals only when first qualifying or when flipping direction. Misses re-entries if quality improves mid-regime.
3. CONTINUOUS:
Signals appear on:
• Every bar that qualifies
Testing/debugging mode - shows all qualified bars. Very noisy but useful for understanding when system wants to trade.
Cooldown System:
Prevents signal clustering and overtrading by enforcing minimum bars between signals.
Base Cooldown: User-defined (default 5 bars)
Adaptive Cooldown (Optional):
If enabled, cooldown scales with volatility:
Effective_Cooldown = Base_Cooldown × volatility_multiplier
Where:
ATR_Pct = ATR(14) / Close × 100
Volatility_Multiplier = max(0.5, min(3.0, ATR_Pct / 2.0))
• Low volatility (ATR 1%): Multiplier ~0.5× → Cooldown = 2-3 bars (tight)
• Medium volatility (ATR 2%): Multiplier 1.0× → Cooldown = 5 bars (normal)
• High volatility (ATR 4%+): Multiplier 2.0-3.0× → Cooldown = 10-15 bars (wide)
This prevents excessive trading during wild swings while allowing more signals during calm periods.
Regime Filter:
Three modes controlling which regimes allow trading:
OFF: Trade in any regime (STABLE, TRENDING, SHIFTING, ELEVATED, EXTREME)
SMART (Recommended):
• Regime score = 1.0 for SHIFTING, ELEVATED (optimal)
• Regime score = 0.8 for TRENDING (acceptable)
• Regime score = 0.5 for EXTREME (too chaotic)
• Regime score = 0.2 for STABLE (too quiet)
Quality scores are multiplied by regime score. A 70% quality signal in STABLE regime becomes 70% × 0.2 = 14% → blocked.
STRICT:
• Regime score = 1.0 for SHIFTING, ELEVATED only
• Regime score = 0.0 for all others → hard block
Only trades during optimal distribution shift regimes.
Drawdown Protection:
If current equity drawdown exceeds pause threshold (default 8%), all signals are blocked until equity recovers.
This circuit breaker prevents compounding losses during adverse conditions or broken market structure.
🎯 RISK MANAGEMENT: ATR-BASED STOPS & TARGETS
Every signal generates volatility-normalized stop loss and target levels displayed as boxes on the chart.
Stop Loss Calculation:
Stop_Distance = ATR(14) × ATR_Multiplier (default 1.5)
For LONG: Stop = Entry - Stop_Distance
For SHORT: Stop = Entry + Stop_Distance
The stop is placed 1.5 ATRs away from entry by default, adapting automatically to instrument volatility.
Target Calculation:
Target_Distance = Stop_Distance × Risk_Reward_Ratio (default 2.0)
For LONG: Target = Entry + Target_Distance
For SHORT: Target = Entry - Target_Distance
Default 2:1 risk/reward means target is twice as far as stop.
Example:
• Price: $100
• ATR: $2
• ATR Multiplier: 1.5
• Risk/Reward: 2.0
LONG Signal:
• Entry: $100
• Stop: $100 - ($2 × 1.5) = $97.00 (-$3 risk)
• Target: $100 + ($3 × 2.0) = $106.00 (+$6 reward)
• Risk/Reward: $3 risk for $6 reward = 1:2 ratio
Target/Stop Box Lifecycle:
Boxes persist for a lifetime (default 20 bars) OR until an opposite signal fires, whichever comes first. This provides visual reference for active trade levels without permanent chart clutter.
When a new opposite-direction signal appears, all existing boxes from the previous direction are immediately deleted, ensuring only relevant levels remain visible.
Adaptive Stop/Target Sizing:
While not explicitly coded in the current version, the shadow portfolio tracking system calculates PnL based on these levels. Users can observe which ATR multipliers and risk/reward ratios produce optimal results for their instrument/timeframe via the dashboard performance metrics.
📊 COMPREHENSIVE VISUAL SYSTEM
KMD provides rich visual feedback through four distinct layers:
1. PROBABILITY CLOUD (Adaptive Volatility Bands):
Two sets of bands around price that expand/contract with MMD:
Calculation:
Std_Multiplier = 1 + MMD × 3
Upper_1σ = Close + ATR × Std_Multiplier × 0.5
Lower_1σ = Close - ATR × Std_Multiplier × 0.5
Upper_2σ = Close + ATR × Std_Multiplier
Lower_2σ = Close - ATR × Std_Multiplier
• Inner band (±0.5× adjusted ATR) : 68% probability zone (1 standard deviation equivalent)
• Outer band (±1.0× adjusted ATR) : 95% probability zone (2 standard deviation equivalent)
When MMD spikes, bands widen dramatically, showing increased uncertainty. When MMD calms, bands tighten, showing normal price action.
2. MOMENTUM FLOW VECTORS (Directional Arrows):
Dynamic arrows that visualize momentum strength and direction:
Arrow Properties:
• Length: Proportional to momentum magnitude (2-10 bars forward)
• Width: 1px (weak), 2px (medium), 3px (strong)
• Transparency: 30-100 (more opaque = stronger momentum)
• Direction: Up for bullish, down for bearish
• Placement: Below bars (bulls) or above bars (bears)
Trigger Logic:
• Always appears every 5 bars (regular sampling)
• Forced appearance if momentum strength > 50 OR regime shift OR MMD velocity > 10%
Strong momentum (>75%) gets:
• Secondary support arrow (70% length, lighter color)
• Label showing "75%" strength
Very strong momentum (>60%) gets:
• Gradient flow lines (thick vertical lines showing momentum vector)
This creates a dynamic "flow field" showing where market pressure is pushing price.
3. REGIME ZONES (Distribution Shift Highlighting):
Boxes drawn around price action during periods when MMD > threshold:
Zone Detection:
• System enters "in_regime" mode when MMD crosses above threshold
• Tracks highest high and lowest low during regime
• Exits "in_regime" when MMD crosses back below threshold
• Draws box from regime_start to current bar, spanning high to low
Zone Colors:
• EXTREME regime: Red with 90% transparency (dangerous)
• SHIFTING regime: Amber with 92% transparency (active)
• Other regimes: Teal with 95% transparency (normal)
Emphasis Boxes:
When regime_shift occurs (MMD crosses above threshold that bar), a special 4-bar wide emphasis box highlights the exact transition moment with thicker borders and lower transparency.
This visual immediately shows "the market just changed" moments.
4. SIGNAL CONNECTION LINES:
Lines connecting consecutive signals to show trade sequences:
Line Types:
• Solid line : Same direction signals (long → long, short → short)
• Dotted line : Reversal signals (long → short or short → long)
Visual Purpose:
• Identify signal clusters (multiple entries same direction)
• Spot reversal patterns (system changing bias)
• See average bars between signals
• Understand system behavior patterns
Connections are limited to signals within 100 bars of each other to avoid across-chart lines.
📈 COMPREHENSIVE DASHBOARD: REAL-TIME SYSTEM STATE
The dashboard provides complete transparency into system internals with three size modes:
MINIMAL MODE:
• Header (Regime + WFO phase)
• Signal Status (LONG READY / SHORT READY / WAITING)
• Core metrics only
COMPACT MODE (Default):
• Everything in Minimal
• Kernel info
• Active bandit arm + validation
• WFO efficiency
• Confluence scores (bull/bear)
• MMD current value
• Position status (if active)
• Performance summary
FULL MODE:
• Everything in Compact
• Signal Quality Diagnostics:
- Bull quality score vs threshold with progress bar
- Bear quality score vs threshold with progress bar
- MMD threshold check (✓/✗)
- MMD percentile (top X% of history)
- Regime fit score (how well current regime suits trading)
- WFO confidence level (validation strength)
- Adaptive cooldown status (bars remaining vs required)
• All Arms Signals:
- Shows all 7 arm signals (▲/▼/○)
- Q-value for each arm
- Indicates selected arm with ◄
• Thompson Sampling Parameters (if TS mode):
- Alpha/Beta values for selected arm
- Probability estimate (α/(α+β))
• Extended Performance:
- Expectancy per trade
- Sharpe ratio with star rating
- Individual arm performance (if enough data)
Key Dashboard Sections:
REGIME: Current market regime (STABLE/TRENDING/SHIFTING/ELEVATED/EXTREME) with color-coded background
SIGNAL STATUS:
• "▲ LONG READY" (cyan) - Long signal qualified
• "▼ SHORT READY" (red) - Short signal qualified
• "○ WAITING" (gray) - No qualified signals
• Signal Mode displayed (Responsive/Transition/Continuous)
KERNEL:
• Active kernel type (RBF/Laplacian/Cauchy/Rational Quadratic)
• Current bandwidth (effective after adaptation)
• Adaptive vs Fixed indicator
• RBF scale (if RBF) or RQ alpha (if RQ)
BANDIT:
• Selection algorithm (UCB1/UCB1-Tuned/Epsilon/Thompson)
• Active arm name (MMD Shift, Trend, Breakout, etc.)
• Validation status (✓ if validated, ? if unproven)
• Pull count (n=XXX) - how many times selected
• Q-Value (×10000 for readability)
• UCB score (exploration + exploitation)
• Train Q vs Test Q comparison
• Test trade count
WFO:
• Current period number
• Progress through period (XX%)
• Efficiency percentage (color-coded: green >80%, yellow 50-80%, red <50%)
• Overfit risk assessment (LOW/MODERATE/HIGH)
• Validated arms count (X/7)
CONFLUENCE:
• Bull score (X/7) with progress bar (███ full, ██ medium, █ low, ○ none)
• Bear score (X/7) with progress bar
• Color-coded: Green/red if ≥ minimum, gray if below
MMD:
• Current value (3 decimals)
• Threshold (2 decimals)
• Ratio (MMD/Threshold × multiplier, e.g. "1.5x" = 50% above threshold)
• Velocity (+/- percentage change) with up/down arrows
POSITION:
• Status: LONG/SHORT/FLAT
• Active indicator (● if active, ○ if flat)
• Bars since entry
• Current P&L percentage (if active)
• P&L direction (▲ profit / ▼ loss)
• R-Multiple (how many Rs: PnL / initial_risk)
PERFORMANCE:
• Total Trades
• Wins (green) / Losses (red) breakdown
• Win Rate % with visual bar and color coding
• Profit Factor (PF) with checkmark if >1.0
• Expectancy % (average profit per trade)
• Sharpe Ratio with star rating (★★★ >2, ★★ >1, ★ >0, ○ negative)
• Max DD % (maximum drawdown) with "Now: X%" showing current drawdown
🔧 KEY PARAMETERS EXPLAINED
Kernel Configuration:
• Kernel Function : RBF / Laplacian / Cauchy / Rational Quadratic
- Start with Cauchy for stability, experiment with others
• Bandwidth (σ) (0.5-10.0, default 2.0): Kernel sensitivity
- Lower: More signals, more false positives (scalping: 0.8-1.5)
- Medium: Balanced (swing: 1.5-3.0)
- Higher: Fewer signals, stronger quality (position: 3.0-8.0)
• Adaptive Bandwidth (default ON): Auto-adjust to volatility
- Keep ON for most markets
• RBF Scale (0.1-2.0, default 0.5): RBF-specific scaling
- Only matters if RBF kernel selected
- Lower = more sensitive (0.3 for scalping)
- Higher = less sensitive (1.0+ for position)
• RQ Alpha (0.5-5.0, default 2.0): Rational Quadratic tail behavior
- Only matters if RQ kernel selected
- Low (0.5-1.0): Heavy tails, robust to outliers (like Cauchy)
- High (3.0-5.0): Light tails, sensitive (like RBF)
Analysis Windows:
• Reference Period (30-500, default 100): Historical baseline
- Scalping: 50-80
- Intraday: 80-150
- Swing: 100-200
- Position: 200-500
• Test Period (5-100, default 20): Recent behavior window
- Should be 15-25% of Reference Period
- Scalping: 10-15
- Intraday: 15-25
- Swing: 20-40
- Position: 30-60
• Sample Size (10-40, default 20): Data points for MMD
- Lower: Faster, less reliable (scalping: 12-15)
- Medium: Balanced (standard: 18-25)
- Higher: Slower, more reliable (position: 25-35)
Walk-Forward Optimization:
• Enable WFO (default ON): Master overfitting protection
- Always ON for live trading
• Training Window (100-2000, default 500): Learning data
- Should be 4-6× Testing Window
- 1m-5m: 300-500
- 15m-1h: 500-800
- 4h-1D: 500-1000
- 1D-1W: 800-2000
• Testing Window (50-500, default 100): Validation data
- Should be 1/5 to 1/4 of Training
- 1m-5m: 50-100
- 15m-1h: 80-150
- 4h-1D: 100-200
- 1D-1W: 150-500
• Min Trades for Validation (5-50, default 10): Statistical threshold
- Active traders: 8-12
- Position traders: 15-30
• Performance Decay (0.8-0.99, default 0.95): Old data forgetting
- Aggressive: 0.85-0.90 (volatile markets)
- Moderate: 0.92-0.96 (most use cases)
- Conservative: 0.97-0.99 (stable markets)
Multi-Armed Bandit:
• Learning Rate (α) (0.01-0.3, default 0.08): Adaptation speed
- Low: 0.01-0.05 (position trading, stable)
- Medium: 0.06-0.12 (day/swing trading)
- High: 0.15-0.30 (scalping, fast adaptation)
• Selection Strategy : UCB1 / UCB1-Tuned / Epsilon-Greedy / Thompson
- UCB1 recommended for most (proven, reliable)
- Thompson for advanced users (best empirical performance)
• Exploration Constant (c) (0.5-3.0, default 1.5): Explore vs exploit
- Low: 0.5-1.0 (conservative, proven strategies)
- Medium: 1.2-1.8 (balanced)
- High: 2.0-3.0 (experimental, volatile markets)
• Epsilon (0.0-0.3, default 0.10): Random exploration (ε-greedy only)
- Only applies if Epsilon-Greedy selected
- Standard: 0.10 (10% random)
Signal Configuration:
• MMD Threshold (0.05-1.0, default 0.15): Distribution divergence trigger
- Low: 0.08-0.12 (scalping, sensitive)
- Medium: 0.12-0.20 (day/swing)
- High: 0.25-0.50 (position, strong signals)
- Stocks/indices: 0.12-0.18
- Forex: 0.15-0.25
- Crypto: 0.20-0.35
• Confluence Filter (default ON): Multi-factor requirement
- Keep ON for quality signals
• Minimum Confluence (1-7, default 2): Factors needed
- Very low: 1 (high frequency)
- Low: 2-3 (active trading)
- Medium: 4-5 (swing)
- High: 6-7 (rare perfect setups)
• Cooldown (1-20, default 5): Bars between signals
- Short: 1-3 (scalping, allows rapid re-entry)
- Medium: 4-7 (day/swing)
- Long: 8-20 (position, ensures development)
• Signal Mode : Responsive / Transition Only / Continuous
- Responsive: Recommended (new + upgrades)
- Transition: Cleanest (first + reversals)
- Continuous: Testing (every qualified bar)
Advanced Signal Control:
• Minimum Signal Strength (30-90, default 60): Quality floor
- Lower: More signals (scalping: 40-50)
- Medium: Balanced (standard: 55-65)
- Higher: Fewer signals (position: 70-80)
• Dynamic MMD Threshold (default ON): Auto-calibration
- Keep ON for adaptive behavior
• Signal Ranking Filter (default ON): Top percentile only
- Keep ON to trade only best signals
• Ranking Percentile (50-95, default 75): Selectivity
- 75 = top 25% of signals
- 85 = top 15% of signals
- 90 = top 10% of signals
• Adaptive Cooldown (default ON): Volatility-scaled spacing
- Keep ON for intelligent spacing
• Regime Filter : Off / Smart / Strict
- Off: Any regime (maximize frequency)
- Smart: Avoid extremes (recommended)
- Strict: Only optimal regimes (maximum quality)
Risk Parameters:
• Risk:Reward Ratio (1.0-5.0, default 2.0): Target distance multiplier
- Conservative: 1.0-1.5 (higher WR needed)
- Balanced: 2.0-2.5 (standard professional)
- Aggressive: 3.0-5.0 (lower WR acceptable)
• Stop Loss (ATR mult) (0.5-4.0, default 1.5): Stop distance
- Tight: 0.5-1.0 (scalping, low vol)
- Medium: 1.2-2.0 (day/swing)
- Wide: 2.5-4.0 (position, high vol)
• Pause After Drawdown (2-20%, default 8%): Circuit breaker
- Aggressive: 3-6% (small accounts)
- Moderate: 6-10% (most traders)
- Relaxed: 10-15% (large accounts)
Multi-Timeframe:
• MTF Confirmation (default OFF): Higher TF filter
- Turn ON for swing/position trading
- Keep OFF for scalping/day trading
• Higher Timeframe (default "60"): HTF for trend check
- Should be 3-5× chart timeframe
- 1m chart → 5m or 15m
- 5m chart → 15m or 60m
- 15m chart → 60m or 240m
- 1h chart → 240m or D
Display:
• Probability Cloud (default ON): Volatility bands
• Momentum Flow Vectors (default ON): Directional arrows
• Regime Zones (default ON): Distribution shift boxes
• Signal Connections (default ON): Lines between signals
• Dashboard (default ON): Stats table
• Dashboard Position : Top Left / Top Right / Bottom Left / Bottom Right
• Dashboard Size : Minimal / Compact / Full
• Color Scheme : Default / Monochrome / Warm / Cool
• Show MMD Debug Plot (default OFF): Overlay MMD value
- Turn ON temporarily for threshold calibration
🎓 PROFESSIONAL USAGE PROTOCOL
Phase 1: Parameter Calibration (Week 1)
Goal: Find optimal kernel and bandwidth for your instrument/timeframe
Setup:
• Enable "Show MMD Debug Plot"
• Start with Cauchy kernel, 2.0 bandwidth
• Run on chart with 500+ bars of history
Actions:
• Watch yellow MMD line vs red threshold line
• Count threshold crossings per 100 bars
• Adjust bandwidth to achieve desired signal frequency:
- Too many crossings (>20): Increase bandwidth (2.5-3.5)
- Too few crossings (<5): Decrease bandwidth (1.2-1.8)
• Try other kernels to see sensitivity differences
• Note: RBF most sensitive, Cauchy most robust
Target: 8-12 threshold crossings per 100 bars for day trading
Phase 2: WFO Validation (Weeks 2-3)
Goal: Verify strategies generalize out-of-sample
Requirements:
• Enable WFO with default settings (500/100)
• Let system run through 2-3 complete WFO cycles
• Accumulate 50+ total trades
Actions:
• Monitor WFO Efficiency in dashboard
• Check which arms validate (green ✓) vs unproven (yellow ?)
• Review Train Q vs Test Q for selected arm
• If efficiency < 0.5: System overfitting, adjust parameters
Red Flags:
• Efficiency consistently <0.4: Serious overfitting
• Zero arms validate after 2 cycles: Windows too short or thresholds too strict
• Selected arm never validates: Investigate arm logic relevance
Phase 3: Signal Quality Tuning (Week 4)
Goal: Optimize confluence and quality thresholds
Requirements:
• Switch dashboard to FULL mode
• Enable all diagnostic displays
• Track signals for 100+ bars
Actions:
• Watch Bull/Bear quality scores in real-time
• Note quality distribution of fired signals (are they all 60-70% or higher?)
• If signal ranking on, check percentile cutoff appropriateness
• Adjust "Minimum Signal Strength" to filter weak setups
• Adjust "Minimum Confluence" if too many/few signals
Optimization:
• If win rate >60%: Lower thresholds (capture more opportunities)
• If win rate <45%: Raise thresholds (improve quality)
• If Profit Factor <1.2: Increase minimum quality by 5-10 points
Phase 4: Regime Awareness (Week 5)
Goal: Understand which regimes work best
Setup:
• Track performance by regime using notes/journal
• Dashboard shows current regime constantly
Actions:
• Note signal quality and outcomes in each regime:
- STABLE: Often weak signals, low confidence
- TRENDING: Trend-following arms dominate
- SHIFTING: Highest signal quality, core opportunity
- ELEVATED: Good signals, moderate success
- EXTREME: Mixed results, high variance
• Adjust Regime Filter based on findings
• If losing in EXTREME consistently: Use "Smart" or "Strict" filter
Phase 5: Micro Live Testing (Weeks 6-8)
Goal: Validate forward performance with minimal capital
Requirements:
• Paper trading shows: WR >45%, PF >1.2, Efficiency >0.6
• Understand why signals fire and why they're blocked
• Comfortable with dashboard interpretation
Setup:
• 10-25% intended position size
• Focus on ML-boosted signals (if any pattern emerges)
• Keep detailed journal with screenshots
Actions:
• Execute every signal the system generates (within reason)
• Compare your P&L to shadow portfolio metrics
• Track divergence between your results and system expectations
• Review weekly: What worked? What failed? Any execution issues?
Red Flags:
• Your WR >20% below paper: Execution problems (slippage, timing)
• Your WR >20% above paper: Lucky streak or parameter mismatch
• Dashboard metrics drift significantly: Market regime changed
Phase 6: Full Scale Deployment (Month 3+)
Goal: Progressively increase to full position sizing
Requirements:
• 30+ micro live trades completed
• Live WR within 15% of paper WR
• Profit Factor >1.0 live
• Max DD <15% live
• Confidence in parameter stability
Progression:
• Months 3-4: 25-50% intended size
• Months 5-6: 50-75% intended size
• Month 7+: 75-100% intended size
Maintenance:
• Weekly dashboard review for metric drift
• Monthly WFO efficiency check (should stay >0.5)
• Quarterly parameter re-optimization if market character shifts
• Annual deep review of arm performance and kernel relevance
Stop/Reduce Rules:
• WR drops >20% from baseline: Reduce to 50%, investigate
• Consecutive losses >12: Reduce to 25%, review parameters
• Drawdown >20%: Stop trading, reassess system fit
• WFO efficiency <0.3 for 2+ periods: System broken, retune completely
💡 DEVELOPMENT INSIGHTS & KEY BREAKTHROUGHS
The Kernel Discovery:
Early versions used simple moving average crossovers and momentum indicators—they captured obvious moves but missed subtle regime changes. The breakthrough came from reading academic papers on two-sample testing and kernel methods. Applying Maximum Mean Discrepancy to financial returns revealed distribution shifts 10-20 bars before traditional indicators signaled. This edge—knowing the market had fundamentally changed before it was obvious—became the core of KMD.
Testing showed Cauchy kernel outperformed others by 15% win rate in crypto specifically because its heavy tails ignored the massive outlier spikes (liquidation cascades, bot manipulation) that fooled RBF into false signals.
The Seven Arms Revelation:
Originally, the system had one strategy: "Trade when MMD crosses threshold." Performance was inconsistent—great in ranging markets, terrible in trends. The insight: different market structures require different strategies. Creating seven distinct arms based on different market theories (trend-following, mean-reversion, breakout, volume, momentum) and letting them compete solved the problem.
The multi-armed bandit wasn't added as a gimmick—it was the solution to "which strategy should I use right now?" The system discovers the answer automatically through reinforcement learning.
The Thompson Sampling Superiority:
UCB1 worked fine, but Thompson Sampling empirically outperformed it by 8% over 1000+ trades in backtesting. The reason: Thompson's probabilistic selection naturally hedges uncertainty. When two arms have similar Q-values, UCB1 picks one deterministically (whichever has slightly higher exploration bonus). Thompson samples from both distributions, sometimes picking the "worse" one—and often discovering it's actually better in current conditions.
Implementing true Beta distribution sampling (Box-Muller + Marsaglia-Tsang) instead of fake approximations was critical. Fake Thompson (using random with bias) underperformed UCB1. Real Thompson with proper Bayesian updating dominated.
The Walk-Forward Necessity:
Initial backtests showed 65% win rate across 5000 trades. Live trading: 38% win rate over first 100 trades. Crushing disappointment. The problem: overfitting. The training data included the test data (look-ahead bias). Implementing proper walk-forward optimization with out-of-sample validation dropped backtest win rate to 51%—but live performance matched at 49%. That's a system you can trust.
WFO efficiency metric became the North Star. If efficiency >0.7, live results track paper. If efficiency <0.5, prepare for disappointment.
The Confluence Complexity:
First signals were simple: "MMD high + arm agrees." This generated 200+ signals on 1000 bars with 42% win rate—not tradeable. Adding confluence (must have trend + volume + structure + RSI) reduced signals to 40 with 58% win rate. The math clicked: fewer, better signals outperform many mediocre signals .
The weighted system (20pt critical factors, 15pt high-impact, 10pt moderate/bonus) emerged from analyzing which factors best predicted wins. Bandit arm alignment and MMD quality were 2-3× more predictive than RSI or divergence, so they got 2× the weight. This isn't arbitrary—it's data-driven.
The Dynamic Threshold Insight:
Fixed MMD threshold failed across different market conditions. 0.15 worked perfectly on ES but fired constantly on Bitcoin. The adaptive threshold (scaling with recent MMD mean + stdev) auto-calibrated to instrument volatility. This single change made the system deployable across forex, crypto, stocks without manual tuning per instrument.
The Signal Mode Evolution:
Originally, every qualified bar showed a triangle. Charts became unusable—dozens of stacked triangles during trending regimes. "Transition Only" mode cleaned this up but missed re-entries when quality spiked mid-regime. "Responsive" mode emerged as the optimal balance: show fresh qualifications, reversals, AND significant quality improvements (25%+) during extreme regimes. This captures the signal intent ("something important just happened") without chart pollution.
🚨 LIMITATIONS & CRITICAL ASSUMPTIONS
What This System IS NOT:
• NOT Predictive : KMD doesn't forecast prices. It identifies when the current distribution differs from historical baseline, suggesting regime transition—but not direction or magnitude.
• NOT Holy Grail : Typical performance is 48-56% win rate with 1.3-1.8 avg R-multiple. This is a probabilistic edge, not certainty. Expect losing streaks of 8-12 trades.
• NOT Universal : Performs best on liquid, auction-driven markets (futures, major forex, large-cap stocks, BTC/ETH). Struggles with illiquid instruments, thin order books, heavily manipulated markets.
• NOT Hands-Off : Requires monitoring for news events, earnings, central bank announcements. MMD cannot detect "Fed meeting in 2 hours" or "CEO stepping down"—it only sees statistical patterns.
• NOT Immune to Regime Persistence : WFO helps but cannot predict black swans or fundamental market structure changes (pandemic, war, regulatory overhaul). During these events, all historical patterns may break.
Core Assumptions:
1. Return Distributions Exhibit Clustering : Markets alternate between relatively stable distributional regimes. Violation: Permanent random walk, no regime structure.
2. Distribution Changes Precede Price Moves : Statistical divergence appears before obvious technical signals. Violation: Instantaneous regime flips (gaps, news), no statistical warning.
3. Volume Reflects Real Activity : Volume-based confluence assumes genuine participation. Violation: Wash trading, spoofing, exchange manipulation (common in crypto).
4. Past Arm Performance Predicts Future Arm Performance : The bandit learns from history. Violation: Fundamental strategy regime change (e.g., market transitions from mean-reverting to trending permanently).
5. ATR-Based Stops Are Rational : Volatility-normalized risk management avoids premature exits. Violation: Flash crashes, liquidity gaps, stop hunts precisely targeting ATR multiples.
6. Kernel Similarity Maps to Economic Similarity : Mathematical similarity (via kernel) correlates with economic similarity (regime). Violation: Distributions match by chance while fundamentals differ completely.
Performs Best On:
• ES, NQ, RTY (S&P 500, Nasdaq, Russell 2000 futures)
• Major forex pairs: EUR/USD, GBP/USD, USD/JPY, AUD/USD
• Liquid commodities: CL (crude oil), GC (gold), SI (silver)
• Large-cap stocks: AAPL, MSFT, GOOGL, TSLA (>$10M avg daily volume)
• Major crypto on reputable exchanges: BTC, ETH (Coinbase, Kraken)
Performs Poorly On:
• Low-volume stocks (<$1M daily volume)
• Exotic forex pairs with erratic spreads
• Illiquid crypto altcoins (manipulation, unreliable volume)
• Pre-market/after-hours (thin liquidity, gaps)
• Instruments with frequent corporate actions (splits, dividends)
• Markets with persistent one-sided intervention (central bank pegs)
Known Weaknesses:
• Lag During Instantaneous Shifts : MMD requires (test_window) bars to detect regime change. Fast-moving events (5-10 bar crashes) may bypass detection entirely.
• False Positives in Choppy Consolidation : Low-volatility range-bound markets can trigger false MMD spikes from random noise crossing threshold. Regime filter helps but doesn't eliminate.
• Parameter Sensitivity : Small bandwidth changes (2.0→2.5) can alter signal frequency by 30-50%. Requires careful calibration per instrument.
• Bandit Convergence Time : MAB needs 50-100 trades per arm to reliably learn Q-values. Early trades (first 200 bars) are essentially random exploration.
• WFO Warmup Drag : First WFO cycle has no validation data, so all arms start unvalidated. System may trade rarely or conservatively for first 500-600 bars until sufficient test data accumulates.
• Visual Overload : With all display options enabled (cloud, vectors, zones, connections), chart can become cluttered. Disable selectively for cleaner view.
⚠️ RISK DISCLOSURE
Trading futures, forex, stocks, options, and cryptocurrencies involves substantial risk of loss and is not suitable for all investors. Leveraged instruments can result in losses exceeding your initial investment. Past performance, whether backtested or live, is not indicative of future results.
The Kernel Market Dynamics system, including its multi-armed bandit and walk-forward optimization components, is provided for educational purposes only. It is not financial advice, investment advice, or a recommendation to buy or sell any security or instrument.
The adaptive learning algorithms optimize based on historical data—there is no guarantee that learned strategies will remain profitable or that kernel-detected regime changes will lead to profitable trades. Market conditions change, correlations break, and distributional regimes shift in ways that historical data cannot predict. Black swan events occur.
Walk-forward optimization reduces but does not eliminate overfitting risk. WFO efficiency metrics indicate likelihood of forward performance but cannot guarantee it. A system showing high efficiency on one dataset may show low efficiency on another timeframe or instrument.
The dashboard shadow portfolio simulates trades under idealized conditions: instant fills, no slippage, no commissions, perfect execution. Real trading involves slippage (often 1-3 ticks per trade), commissions, latency, partial fills, rejected orders, requotes, and liquidity constraints that significantly reduce performance below simulated results.
Maximum Mean Discrepancy is a statistical distance metric—high MMD indicates distribution divergence but does not indicate direction, magnitude, duration, or profitability of subsequent moves. MMD can spike during sideways chop, producing signals with no directional follow-through.
Users must independently validate system performance on their specific instruments, timeframes, broker execution, and market conditions before risking capital. Conduct extensive paper trading (minimum 100 trades) and start with micro position sizing (10-25% intended size) for at least 50 trades before scaling up.
Never risk more capital than you can afford to lose completely. Use proper position sizing (1-2% risk per trade maximum). Implement stop losses on every trade. Maintain adequate margin/capital reserves. Understand that most retail traders lose money. Algorithmic systems do not change this fundamental reality—they systematize decision-making but do not eliminate risk.
The developer makes no warranties regarding profitability, suitability, accuracy, reliability, or fitness for any particular purpose. Users assume all responsibility for their trading decisions, parameter selections, risk management, and outcomes.
By using this indicator, you acknowledge that you have read and understood these risk disclosures and accept full responsibility for all trading activity and potential losses.
📁 SUGGESTED TRADINGVIEW CATEGORIES
PRIMARY CATEGORY: Statistics
The Kernel Market Dynamics system is fundamentally a statistical learning framework . At its core lies Maximum Mean Discrepancy—an advanced two-sample statistical test from the academic machine learning literature. The indicator compares probability distributions using kernel methods (RBF, Laplacian, Cauchy, Rational Quadratic) that map data to high-dimensional feature spaces for nonlinear similarity measurement.
The multi-armed bandit framework implements reinforcement learning via Q-learning with exponential moving average updates. Thompson Sampling uses true Bayesian inference with Beta posterior distributions. Walk-forward optimization performs rigorous out-of-sample statistical validation with train/test splits and efficiency metrics that detect overfitting.
The confluence system aggregates multiple statistical indicators (RSI, ADX, OBV, Z-scores, EMAs) with weighted scoring that produces a 0-100 quality metric. Signal ranking uses percentile-based filtering on historical quality distributions. The dashboard displays comprehensive statistics: win rates, profit factors, Sharpe ratios, expectancy, drawdowns—all computed from trade return distributions.
This is advanced statistical analysis applied to trading: distribution comparison, kernel methods, reinforcement learning, Bayesian inference, hypothesis testing, and performance analytics. The statistical sophistication distinguishes KMD from simple technical indicators.
SECONDARY CATEGORY: Volume
Volume analysis plays a crucial role in KMD's signal generation and validation. The confluence system includes volume confirmation as a high-impact factor (15 points): signals require above-average volume (>1.2× mean) for full points, with scaling based on volume ratio. The OBV (On-Balance Volume) trend indicator determines directional bias for Arm 6 (Volume Confirmation strategy).
Volume ratio (current / 20-period average) directly affects confluence scores—higher volume strengthens signal quality. The momentum flow vectors scale width and opacity based on volume momentum relative to average. Energy particle visualization specifically marks volume burst events (>2× average volume) as potential market-moving catalysts.
Several bandit arms explicitly incorporate volume:
• Arm 2 (Breakout): Requires volume confirmation for Bollinger Band breaks
• Arm 6 (Volume Confirmation): Primary logic based on OBV trend + volume spike
The system recognizes volume as the "conviction" behind price moves—distribution changes matter more when accompanied by significant volume, indicating genuine participant behavior rather than noise. This volume-aware filtering improves signal reliability in liquid markets.
TERTIARY CATEGORY: Volatility
Volatility measurement and adaptation permeate the KMD system. ATR (Average True Range) forms the basis for all risk management: stops are placed at ATR × multiplier, targets are scaled accordingly. The adaptive bandwidth feature scales kernel bandwidth (0.5-2.0×) inversely with volatility—tightening during calm markets, widening during volatile periods.
The probability cloud (primary visual element) directly visualizes volatility: bands expand/contract based on (1 + MMD × 3) multiplier applied to ATR. Higher MMD (distribution divergence) + higher ATR = dramatically wider uncertainty bands.
Adaptive cooldown scales minimum bars between signals based on ATR percentage: higher volatility = longer cooldown (up to 3× base), preventing overtrading during whipsaw conditions. The gamma parameter in the tensor calculation (from related indicators) and volatility ratio measurements influence MMD sensitivity.
Regime classification incorporates volatility metrics: high volatility with ranging price action produces "RANGE⚡" regime, while volatility expansion with directional movement produces trending regimes. The system adapts its behavior to volatility regimes—tighter requirements during extreme volatility, looser requirements during stable periods.
ATR-based risk management ensures position sizing and exit levels automatically adapt to instrument volatility, making the system deployable across instruments with different average volatilities (stocks vs crypto) without manual recalibration.
══════════════════════════════════════════
CLOSING STATEMENT
══════════════════════════════════════════
Kernel Market Dynamics doesn't just measure price—it measures the probability structure underlying price. It doesn't just pick one strategy—it learns which strategies work in which conditions. It doesn't just optimize on history—it validates on the future.
This is machine learning applied correctly to trading: not curve-fitting oscillators to maximize backtest profit, but implementing genuine statistical learning algorithms (kernel methods, multi-armed bandits, Bayesian inference) that adapt to market evolution while protecting against overfitting through rigorous walk-forward testing.
The seven arms compete. The Thompson sampler selects. The kernel measures. The confluence scores. The walk-forward validates. The signals fire.
Most indicators tell you what happened. KMD tells you when the game changed.
"In the space between distributions, where the kernel measures divergence and the bandit learns from consequence—there, edge exists." — KMD-WFO-MAB v2
Taking you to school. — Dskyz, Trade with insight. Trade with anticipation.

Adaptive ATR Guardian PRO+ (Locked Lines)🎯 核心交易功能 / Core Trading Features
1. 智能参数配置系统 / Intelligent Parameter Configuration
多风格选择:稳健/激进/保守三种交易风格
Multi-style Selection: Conservative/Aggressive/Moderate trading styles
多时间周期:M5/M15/H1三种时间框架
Multi-timeframe: M5/M15/H1 timeframes
自适应参数:根据风格自动调整所有技术参数
Adaptive Parameters: Automatically adjusts all technical parameters based on style
2. 高级信号生成系统 / Advanced Signal Generation
双均线策略:快慢EMA交叉信号
Dual MA Strategy: Fast/Slow EMA crossover signals
趋势过滤:100周期EMA作为趋势方向过滤
Trend Filter: 100-period EMA for trend direction filtering
ADX强度确认:ADX > 最小值才确认趋势有效
ADX Strength Confirmation: ADX > minimum value for valid trend
交易时段控制:可设置交易开始和结束时间
Trading Session Control: Configurable start and end times
3. 智能风险管理 / Intelligent Risk Management
动态止损:基于ATR的智能止损计算
Dynamic Stop Loss: ATR-based intelligent stop loss calculation
分批止盈:TP1平仓50%,TP2平仓剩余50%
Partial Take Profit: TP1 closes 50%, TP2 closes remaining 50%
追踪止损:TP2部分启用追踪止损功能
Trailing Stop: TP2 portion uses trailing stop functionality
品种自适应:BTC和黄金品种特殊参数调整
Symbol Adaptation: Special parameter adjustments for BTC and Gold
4. 专业订单管理 / Professional Order Management
自动平仓:新信号自动平掉反向仓位
Auto Close: New signals automatically close opposite positions
仓位管理:基于账户权益的百分比仓位
Position Management: Percentage-based position sizing
佣金计算:包含交易佣金成本
Commission Calculation: Includes trading commission costs
📊 高级可视化功能 / Advanced Visualization Features
1. 实时交易线系统 / Real-time Trading Lines System
入场线:蓝色虚线,显示入场价格
Entry Line: Blue dashed line showing entry price
止损线:红色实线,显示止损价格
Stop Loss Line: Red solid line showing stop loss price
TP1线:青色实线,显示第一目标位
TP1 Line: Teal solid line showing first target
TP2线:青色实线,显示第二目标位
TP2 Line: Teal solid line showing second target
2. 智能标签管理 / Intelligent Label Management
动态字号:根据时间周期自动调整标签大小
Dynamic Font Size: Auto-adjusts label size based on timeframe
位置优化:标签固定在入场K线右侧3根位置
Position Optimization: Labels fixed 3 bars right of entry candle
实时更新:线条和标签随图表滚动延伸
Real-time Updates: Lines and labels extend with chart scrolling
3. 专业信息面板 / Professional Information Panel
策略状态:交易风格、时间周期、持仓方向
Strategy Status: Trading style, timeframe, position direction
指标数据:ADX强度、ATR波动率数值
Indicator Data: ADX strength, ATR volatility values
交易信息:入场价格、止损价格、止盈价格
Trade Information: Entry price, stop loss, take profit prices
实时更新:每根K线更新最新数据
Real-time Updates: Updates data on every candle
4. 模式状态标签 / Mode Status Label
顶部状态栏:显示周期、风格、ADX、ATR、持仓状态
Top Status Bar: Shows timeframe, style, ADX, ATR, position status
颜色编码:蓝色主题,专业视觉效果
Color Coding: Blue theme, professional visual appearance
⚙️ 技术特色功能 / Technical Special Features
1. 自适应波动率调整 / Adaptive Volatility Adjustment
ATR基准:基于14周期ATR计算
ATR Baseline: Based on 14-period ATR calculation
波动率调整:ATR相对于50周期均线的调整系数
Volatility Adjustment: ATR adjustment coefficient relative to 50-period MA
动态止盈:止盈距离根据波动率动态调整
Dynamic Take Profit: TP distances dynamically adjusted based on volatility
2. 多品种优化 / Multi-Symbol Optimization
BTC特殊处理:更大的止损倍数和TP2倍数
BTC Special Handling: Larger stop loss and TP2 multipliers
黄金特殊处理:适中的参数调整
Gold Special Handling: Moderate parameter adjustments
通用品种:标准参数适用于其他品种
General Symbols: Standard parameters for other symbols
3. 时间智能控制 / Intelligent Time Control
交易时段:可配置的交易时间窗口
Trading Sessions: Configurable trading time windows
时段逻辑:支持跨午夜的时间段设置
Session Logic: Supports cross-midnight time periods
时间过滤:只在交易时段内产生信号
Time Filtering: Only generates signals during trading hours
4. 内存管理优化 / Memory Management Optimization
自动清理:平仓时自动删除所有线条和标签
Auto Cleanup: Automatically deletes all lines and labels on position close
资源回收:避免图表元素堆积
Resource Recycling: Prevents chart element accumulation
性能优化:高效的实时更新机制
Performance Optimization: Efficient real-time update mechanism
🛡️ 风险控制功能 / Risk Control Features
1. 多层过滤系统 / Multi-layer Filtering System
趋势方向过滤 / Trend direction filtering
ADX强度过滤 / ADX strength filtering
交易时间过滤 / Trading time filtering
品种特性过滤 / Symbol characteristic filtering
2. 动态参数系统 / Dynamic Parameter System
快慢均线周期自适应 / Fast/slow MA period adaptation
止损倍数动态调整 / Stop loss multiplier dynamic adjustment
止盈倍数风格化配置 / Take profit multiplier style-based configuration
追踪止损灵敏度设置 / Trailing stop sensitivity settings
3. 资金管理 / Money Management
固定百分比仓位 / Fixed percentage position sizing
佣金成本计入 / Commission costs included
无金字塔加仓 / No pyramiding (no adding to positions)
自动反向平仓 / Automatic opposite position closing
📈 用户体验功能 / User Experience Features
1. 可视化定制 / Visualization Customization
交易线显示/隐藏开关 / Trading lines show/hide toggle
信息面板显示控制 / Information panel display control
线条延伸长度可调 / Line extension length adjustable
颜色方案统一管理 / Color scheme unified management
2. 实时监控 / Real-time Monitoring
持仓状态实时显示 / Real-time position status display
关键价格水平标记 / Key price level markings
指标数值动态更新 / Indicator values dynamic updates
交易统计信息 / Trading statistics information
3. 专业布局 / Professional Layout
右上角信息面板 / Top-right information panel
顶部状态标签 / Top status label
图表交易线条 / Chart trading lines
整洁的视觉层次 / Clean visual hierarchy

Market Trend statusBullTrading Free Indicator Series
What is the Trend State Machine?
A “trend state machine” that fuses DMI (+DI/−DI) with ADX strength. It avoids bells and whistles and answers three things with minimal rules:
1. Whether the market is range-bound (chop) or trending;
2. If trending, whether it is bullish (long) or bearish (short);
3. The trend intensity tier (Strong / Extreme / Decaying) plus a 0–100 strength score.
1-Minute Quick Start (beginners can stop here)
1. Timeframe – pick your trading anchor first
• Crypto: 5–15m
• Gold: 5m or 15m
• FX: 15–30m
2. Mode – top of the panel: set Mode = Simple.
3. Sensitivity – set Sensitivity (1 conservative – 5 aggressive). Recommended:
• Crypto: 3 (use 4 in high volatility)
• Gold: 2–3
• FX: 2–3
• Indices: 2
4. Read the card (top-right)
• Environment: Range/Invalid, Bull Trend (Watch), Bull Trend (Confirmed) (bearish equivalents apply)
• Add-ons: | Strong, | Extreme, | Decay
• Also shows ADX, Enter/Exit thresholds, ΔDI, and Score.
5. Background & lines
• Green/Red background = in trend; deeper shade = stronger.
• Orange thick line = ADX, Green = +DI, Red = −DI; shaded band between lines is the enter/exit zone.
6. Minimal execution rules
• Trade with the trend only: consider entries only when Environment = Confirmed and direction is bull/bear.
• Prioritize strength: when Strong Trend triggers or Score > 70, prefer trend-following adds / enable trailing take-profit.
• Exit: when Exit/Flip alert fires, or after Decay if ADX falls back below the enter threshold, reduce/close.
Note: In Simple mode, built-in hysteresis (Enter > Exit) cuts whipsaws significantly—no need to hand-tune thresholds.
How to Use Alerts
• Three built-in fixed alerts:
1. Trend Confirmed (Bull/Bear) — entry/add trigger
2. Strong Trend — momentum reinforcement (chase/add or tighten trailing TP)
3. Exit or Flip — scale-out/close/observe the other side
• Want dynamic messages with numbers? Check “Enable dynamic alerts (alert())” and, when creating the alert, choose Any alert() function call.
Parameter Guidance (rules of thumb)
• Sensitivity: Higher = earlier entries but more false signals; lower = later confirmation but steadier.
• Timeframe: The smaller the timeframe, the lower the sensitivity you usually need; on higher timeframes you may nudge it up.
• Combos:
• Crypto: 5m/15m + Sens 3 (4 in heavy vol)
• Gold: 5m/15m + Sens 2–3
• FX: 15m/30m + Sens 2–3
• Indices: 15m/30m + Sens 2
Pro Mode Highlights (optional)
• Threshold Mode: switch from Fixed (default) to Percentile Adaptive for better robustness across regimes/markets.
• ΔDI / Slope / Hold / Cool-down:
• ΔDI min separation filters weak price/volume divergences.
• ADX slope > threshold on entry rejects “breakouts without growing strength”.
• Min hold bars confirms before output to reduce whipsaws.
• Cool-down bars prevent immediate re-entry after exit/flip.
• MTF Aggregation: enable MTF, default 3× current timeframe, HTF weight 0.3–0.5.
• Turn on Require HTF not opposite & HTF_ADX ≥ exit threshold to effectively filter higher-TF noise.
Reading Cheat Sheet (what you see = what it means)
• Environment: Range/Invalid → Stand down; avoid counter-trend.
• Trend (Watch) → Just entered the zone; wait for Confirmed or buy the pullback with small size.
• Trend (Confirmed) → Trend-following allowed; use Score and Strong/Decay to size/manage.
• Strong Trend → Consider chasing/relaxing TP; momentum is increasing.
• Extreme → Overheated; be cautious chasing—favor trailing to lock gains.
• Decay → Momentum bending down; prepare to trim or tighten stops.
Common Pitfalls & Fixes
• Whipsaws in ranges → Lower sensitivity or move up a timeframe; in Pro mode, enable Slope filter.
• Confirmation too late → During Trend (Watch), try a probe with smaller size; add on confirmation.
• Cross-asset differences → Use Percentile thresholds and MTF weight, or adjust via market presets (Gold/FX/Index).
• Single-signal bias → Always combine Environment + Score + Strong/Decay to avoid tunnel vision.
⸻
Disclaimer: This tool is for educational and research purposes only and does not constitute investment advice or a promise of profit. Trading involves risk; you are solely responsible for your gains and losses.
BullTrading免费指标系列
趋势状态机 是什么:
一个把 DMI(+DI/-DI) 与 ADX 强度合成的“趋势状态机”。它不追求花哨,而是用最小规则输出三件事:
1. 市场当前是 震荡还是趋势;
2. 如是趋势,是 多还是 空;
3. 趋势的 强弱等级(强趋势/极端/衰减)与一个 0–100 的强度分数。
一分钟上手(新手用这个就够)
1. 时间周期:先选你交易的主周期(例:加密 5–15m;黄金 5m 或 15m;外汇 15–30m)。
2. 模式:面板最上方“模式”= 简单。
3. 敏感度:设“敏感度(1保守–5激进)”。推荐:
• Crypto:3(波动大可 4)
• Gold:2–3
• FX:2–3
• 指数/股指:2
4. 读卡片(右上角)
• 环境:震荡/无效、多头趋势(观察)、多头趋势(已确认)(空头同理)
• 附加:|强趋势、|极端、|衰减
• 同时显示 ADX、进入/退出阈值、ΔDI、评分。
5. 底色 & 线
• 绿色/红色底色=处于趋势;颜色越实=越强。
• 橙色粗线=ADX,绿色=+DI,红色=-DI;中间阴影为进入/退出带。
6. 最小执行规则
• 只顺势:环境=已确认 且方向为多/空时才考虑进场。
• 强势优先:出现 强趋势 或评分>70 时,优先做顺势加仓/启动追踪止盈。
• 退出:出现 退出/翻转 告警,或 衰减 后 ADX 再跌回进入阈值下方时,减仓/平仓。
提醒:简单模式下,脚本已内置迟滞(进入>退出),可显著减少抖动;无需再手动校准阈值。
告警怎么用
• 已内置三条固定告警:
1. 趋势已确认(多/空) — 入场/加仓触发器
2. 强趋势 — 趋势强化(可做追击或加速移动止盈)
3. 退出或翻转 — 减仓/止盈/反向观察
• 想带数值的动态文案:勾选“启用动态告警 alert()”,创建告警时选择 Any alert() function call。
参数建议(简易法则)
• 敏感度:更激进(数字大)=更早进场但更易假信号;更保守(数字小)=更迟确认但更稳。
• 时间周期:越小周期越需要降低敏感度;越大周期可略升敏感度。
• 组合:
• Crypto:5m/15m + 敏感度 3(波动大时 4)
• Gold:5m/15m + 敏感度 2–3
• FX:15m/30m + 敏感度 2–3
• 指数:15m/30m + 敏感度 2
专业模式要点(进阶可选)
• 阈值模式:从“固定阈值(默认)”切到“百分位自适应”,在大波动/换市场时更鲁棒。
• ΔDI/斜率/驻留/冷却:
• ΔDI 最小分离度 过滤弱量价背离;
• 进入需 ADX 斜率>阈值 可拒绝“强度不增”的假突破;
• 最小驻留K数 确认后再输出,减少回撤抖动;
• 冷却K数 防止来回打脸。
• MTF 聚合:勾选“启用 MTF”,默认自动 3× 当前周期,HTF 权重 0.3–0.5。
• 要求HTF不反向且HTF_ADX≥退出阈值 打开,能有效剔除逆大级别噪音。
读图速查(你看到=代表什么)
• 环境:震荡/无效 → 暂停;不要逆势开单。
• 趋势(观察) → 刚进入阈值,等待 已确认 或回踩二次确认。
• 趋势(已确认) → 允许顺势;用评分和“强趋势/衰减”微调仓位。
• 强趋势 → 追击或放宽止盈,趋势动能在增强。
• 极端 → 过热区;谨慎追高,更多用移动止盈锁定。
• 衰减 → 动能下弯,准备减仓或收紧止盈。
常见坑 & 对策
• 在震荡箱体频繁进出:降低敏感度或升周期;专业模式勾选“斜率过滤”。
• 确认太慢错过起点:在确认前的“趋势(观察)”阶段,可用更小仓位的试探单,确认后加仓。
• 不同品种差异大:用“百分位”阈值与 MTF 权重;或按市场预设(Gold/FX/Index)微调。
• 只看一个信号:至少同时看 环境状态 + 评分 + 强/衰 三个维度,避免单指标偏差。
本指标仅供教育与研究,不构成投资建议或收益承诺;交易有风险,盈亏自负。

Diamond Peaks [EdgeTerminal]The Diamond Peaks indicator is a comprehensive technical analysis tool that uses a few mathematical models to identify high-probability trading opportunities. This indicator goes beyond traditional support and resistance identification by incorporating volume analysis, momentum divergences, advanced price action patterns, and market sentiment indicators to generate premium-quality buy and sell signals.
Dynamic Support/Resistance Calculation
The indicator employs an adaptive algorithm that calculates support and resistance levels using a volatility-adjusted lookback period. The base calculation uses ta.highest(length) and ta.lowest(length) functions, where the length parameter is dynamically adjusted using the formula: adjusted_length = base_length * (1 + (volatility_ratio - 1) * volatility_factor). The volatility ratio is computed as current_ATR / average_ATR over a 50-period window, ensuring the lookback period expands during volatile conditions and contracts during calm periods. This mathematical approach prevents the indicator from using fixed periods that may become irrelevant during different market regimes.
Momentum Divergence Detection Algorithm
The divergence detection system uses a mathematical comparison between price series and oscillator values over a specified lookback period. For bullish divergences, the algorithm identifies when recent_low < previous_low while simultaneously indicator_at_recent_low > indicator_at_previous_low. The inverse logic applies to bearish divergences. The system tracks both RSI (calculated using Pine Script's standard ta.rsi() function with Wilder's smoothing) and MACD (using ta.macd() with exponential moving averages). The mathematical rigor ensures that divergences are only flagged when there's a clear mathematical relationship between price momentum and the underlying oscillator momentum, eliminating false signals from minor price fluctuations.
Volume Analysis Mathematical Framework
The volume analysis component uses multiple mathematical transformations to assess market participation. The Cumulative Volume Delta (CVD) is calculated as ∑(buying_volume - selling_volume) where buying_volume occurs when close > open and selling_volume when close < open. The relative volume calculation uses current_volume / ta.sma(volume, period) to normalize current activity against historical averages. Volume Rate of Change employs ta.roc(volume, period) = (current_volume - volume ) / volume * 100 to measure volume acceleration. Large trade detection uses a threshold multiplier against the volume moving average, mathematically identifying institutional activity when relative_volume > threshold_multiplier.
Advanced Price Action Mathematics
The Wyckoff analysis component uses mathematical volume climax detection by comparing current volume against ta.highest(volume, 50) * 0.8, while price compression is measured using (high - low) < ta.atr(20) * 0.5. Liquidity sweep detection employs percentage-based calculations: bullish sweeps occur when low < recent_low * (1 - threshold_percentage/100) followed by close > recent_low. Supply and demand zones are mathematically validated by tracking subsequent price action over a defined period, with zone strength calculated as the count of bars where price respects the zone boundaries. Fair value gaps are identified using ATR-based thresholds: gap_size > ta.atr(14) * 0.5.
Sentiment and Market Regime Mathematics
The sentiment analysis employs a multi-factor mathematical model. The fear/greed index uses volatility normalization: 100 - min(100, stdev(price_changes, period) * scaling_factor). Market regime classification uses EMA crossover mathematics with additional ADX-based trend strength validation. The trend strength calculation implements a modified ADX algorithm: DX = |+DI - -DI| / (+DI + -DI) * 100, then ADX = RMA(DX, period). Bull regime requires short_EMA > long_EMA AND ADX > 25 AND +DI > -DI. The mathematical framework ensures objective regime classification without subjective interpretation.
Confluence Scoring Mathematical Model
The confluence scoring system uses a weighted linear combination: Score = (divergence_component * 0.25) + (volume_component * 0.25) + (price_action_component * 0.25) + (sentiment_component * 0.25) + contextual_bonuses. Each component is normalized to a 0-100 scale using percentile rankings and threshold comparisons. The mathematical model ensures that no single component can dominate the score, while contextual bonuses (regime alignment, volume confirmation, etc.) provide additional mathematical weight when multiple factors align. The final score is bounded using math.min(100, math.max(0, calculated_score)) to maintain mathematical consistency.
Vitality Field Mathematical Implementation
The vitality field uses a multi-factor scoring algorithm that combines trend direction (EMA crossover: trend_score = fast_EMA > slow_EMA ? 1 : -1), momentum (RSI-based: momentum_score = RSI > 50 ? 1 : -1), MACD position (macd_score = MACD_line > 0 ? 1 : -1), and volume confirmation. The final vitality score uses weighted mathematics: vitality_score = (trend * 0.4) + (momentum * 0.3) + (macd * 0.2) + (volume * 0.1). The field boundaries are calculated using ATR-based dynamic ranges: upper_boundary = price_center + (ATR * user_defined_multiplier), with EMA smoothing applied to prevent erratic boundary movements. The gradient effect uses mathematical transparency interpolation across multiple zones.
Signal Generation Mathematical Logic
The signal generation employs boolean algebra with multiple mathematical conditions that must simultaneously evaluate to true. Buy signals require: (confluence_score ≥ threshold) AND (divergence_detected = true) AND (relative_volume > 1.5) AND (volume_ROC > 25%) AND (RSI < 35) AND (trend_strength > minimum_ADX) AND (regime = bullish) AND (cooldown_expired = true) AND (last_signal ≠ buy). The mathematical precision ensures that signals only generate when all quantitative conditions are met, eliminating subjective interpretation. The cooldown mechanism uses bar counting mathematics: bars_since_last_signal = current_bar_index - last_signal_bar_index ≥ cooldown_period. This mathematical framework provides objective, repeatable signal generation that can be backtested and validated statistically.
This mathematical foundation ensures the indicator operates on objective, quantifiable principles rather than subjective interpretation, making it suitable for algorithmic trading and systematic analysis while maintaining transparency in its computational methodology.
* for now, we're planning to keep the source code private as we try to improve the models used here and allow a small group to test them. My goal is to eventually use the multiple models in this indicator as their own free and open source indicators. If you'd like to use this indicator, please send me a message to get access.
Advanced Confluence Scoring System
Each support and resistance level receives a comprehensive confluence score (0-100) based on four weighted components:
Momentum Divergences (25% weight)
RSI and MACD divergence detection
Identifies momentum shifts before price reversals
Bullish/bearish divergence confirmation
Volume Analysis (25% weight)
Cumulative Volume Delta (CVD) analysis
Volume Rate of Change monitoring
Large trade detection (institutional activity)
Volume profile strength assessment
Advanced Price Action (25% weight)
Supply and demand zone identification
Liquidity sweep detection (stop hunts)
Wyckoff accumulation/distribution patterns
Fair value gap analysis
Market Sentiment (25% weight)
Fear/Greed index calculation
Market regime classification (Bull/Bear/Sideways)
Trend strength measurement (ADX-like)
Momentum regime alignment
Dynamic Support and Resistance Detection
The indicator uses an adaptive algorithm to identify significant support and resistance levels based on recent market highs and lows. Unlike static levels, these zones adjust dynamically to market volatility using the Average True Range (ATR), ensuring the levels remain relevant across different market conditions.
Vitality Field Background
The indicator features a unique vitality field that provides instant visual feedback about market sentiment:
Green zones: Bullish market conditions with strong momentum
Red zones: Bearish market conditions with weak momentum
Gray zones: Neutral/sideways market conditions
The vitality field uses a sophisticated gradient system that fades from the center outward, creating a clean, professional appearance that doesn't overwhelm the chart while providing valuable context.
Buy Signals (🚀 BUY)
Buy signals are generated when ALL of the following conditions are met:
Valid support level with confluence score ≥ 80
Bullish momentum divergence detected (RSI or MACD)
Volume confirmation (1.5x average volume + 25% volume ROC)
Bull market regime environment
RSI below 35 (oversold conditions)
Price action confirmation (Wyckoff accumulation, liquidity sweep, or large buying volume)
Minimum trend strength (ADX > 25)
Signal alternation check (prevents consecutive buy signals)
Cooldown period expired (default 10 bars)
Sell Signals (🔻 SELL)
Sell signals are generated when ALL of the following conditions are met:
Valid resistance level with confluence score ≥ 80
Bearish momentum divergence detected (RSI or MACD)
Volume confirmation (1.5x average volume + 25% volume ROC)
Bear market regime environment
RSI above 65 (overbought conditions)
Price action confirmation (Wyckoff distribution, liquidity sweep, or large selling volume)
Minimum trend strength (ADX > 25)
Signal alternation check (prevents consecutive sell signals)
Cooldown period expired (default 10 bars)
How to Use the Indicator
1. Signal Quality Assessment
Monitor the confluence scores in the information table:
Score 90-100: Exceptional quality levels (A+ grade)
Score 80-89: High quality levels (A grade)
Score 70-79: Good quality levels (B grade)
Score below 70: Weak levels (filtered out by default)
2. Market Context Analysis
Use the vitality field and market regime information to understand the broader market context:
Trade buy signals in green vitality zones during bull regimes
Trade sell signals in red vitality zones during bear regimes
Exercise caution in gray zones (sideways markets)
3. Entry and Exit Strategy
For Buy Signals:
Enter long positions when premium buy signals appear
Place stop loss below the support confluence zone
Target the next resistance level or use a risk/reward ratio of 2:1 or higher
For Sell Signals:
Enter short positions when premium sell signals appear
Place stop loss above the resistance confluence zone
Target the next support level or use a risk/reward ratio of 2:1 or higher
4. Risk Management
Only trade signals with confluence scores above 80
Respect the signal alternation system (no overtrading)
Use appropriate position sizing based on signal quality
Consider the overall market regime before taking trades
Customizable Settings
Signal Generation Controls
Signal Filtering: Enable/disable advanced filtering
Confluence Threshold: Adjust minimum score requirement (70-95)
Cooldown Period: Set bars between signals (5-50)
Volume/Momentum Requirements: Toggle confirmation requirements
Trend Strength: Minimum ADX requirement (15-40)
Vitality Field Options
Enable/Disable: Control background field display
Transparency Settings: Adjust opacity for center and edges
Field Size: Control the field boundaries (3.0-20.0)
Color Customization: Set custom colors for bullish/bearish/neutral states
Weight Adjustments
Divergence Weight: Adjust momentum component influence (10-40%)
Volume Weight: Adjust volume component influence (10-40%)
Price Action Weight: Adjust price action component influence (10-40%)
Sentiment Weight: Adjust sentiment component influence (10-40%)
Best Practices
Always wait for complete signal confirmation before entering trades
Use higher timeframes for signal validation and context
Combine with proper risk management and position sizing
Monitor the information table for real-time market analysis
Pay attention to volume confirmation for higher probability trades
Respect market regime alignment for optimal results
Basic Settings
Base Length (Default: 25)
Controls the lookback period for identifying support and resistance levels
Range: 5-100 bars
Lower values = More responsive, shorter-term levels
Higher values = More stable, longer-term levels
Recommendation: 25 for intraday, 50 for swing trading
Enable Adaptive Length (Default: True)
Automatically adjusts the base length based on market volatility
When enabled, length increases in volatile markets and decreases in calm markets
Helps maintain relevant levels across different market conditions
Volatility Factor (Default: 1.5)
Controls how much the adaptive length responds to volatility changes
Range: 0.5-3.0
Higher values = More aggressive length adjustments
Lower values = More conservative length adjustments
Volume Profile Settings
VWAP Length (Default: 200)
Sets the calculation period for the Volume Weighted Average Price
Range: 50-500 bars
Shorter periods = More responsive to recent price action
Longer periods = More stable reference line
Used for volume profile analysis and confluence scoring
Volume MA Length (Default: 50)
Period for calculating the volume moving average baseline
Range: 10-200 bars
Used to determine relative volume (current volume vs. average)
Shorter periods = More sensitive to volume changes
Longer periods = More stable volume baseline
High Volume Node Threshold (Default: 1.5)
Multiplier for identifying significant volume spikes
Range: 1.0-3.0
Values above this threshold mark high-volume nodes with diamond shapes
Lower values = More frequent high-volume signals
Higher values = Only extreme volume events marked
Momentum Divergence Settings
Enable Divergence Detection (Default: True)
Master switch for momentum divergence analysis
When disabled, removes divergence from confluence scoring
Significantly impacts signal generation quality
RSI Length (Default: 14)
Period for RSI calculation used in divergence detection
Range: 5-50
Standard RSI settings apply (14 is most common)
Shorter periods = More sensitive, more signals
Longer periods = Smoother, fewer but more reliable signals
MACD Settings
Fast (Default: 12): Fast EMA period for MACD calculation (5-50)
Slow (Default: 26): Slow EMA period for MACD calculation (10-100)
Signal (Default: 9): Signal line EMA period (3-20)
Standard MACD settings for divergence detection
Divergence Lookback (Default: 5)
Number of bars to look back when detecting divergences
Range: 3-20
Shorter periods = More frequent divergence signals
Longer periods = More significant divergence signals
Volume Analysis Enhancement Settings
Enable Advanced Volume Analysis (Default: True)
Master control for sophisticated volume calculations
Includes CVD, volume ROC, and large trade detection
Critical for signal accuracy
Cumulative Volume Delta Length (Default: 20)
Period for CVD smoothing calculation
Range: 10-100
Tracks buying vs. selling pressure over time
Shorter periods = More reactive to recent flows
Longer periods = Broader trend perspective
Volume ROC Length (Default: 10)
Period for Volume Rate of Change calculation
Range: 5-50
Measures volume acceleration/deceleration
Key component in volume confirmation requirements
Large Trade Volume Threshold (Default: 2.0)
Multiplier for identifying institutional-size trades
Range: 1.5-5.0
Trades above this threshold marked as large trades
Lower values = More frequent large trade signals
Higher values = Only extreme institutional activity
Advanced Price Action Settings
Enable Wyckoff Analysis (Default: True)
Activates simplified Wyckoff accumulation/distribution detection
Identifies potential smart money positioning
Important for high-quality signal generation
Enable Supply/Demand Zones (Default: True)
Identifies fresh supply and demand zones
Tracks zone strength based on subsequent price action
Enhances confluence scoring accuracy
Enable Liquidity Analysis (Default: True)
Detects liquidity sweeps and stop hunts
Identifies fake breakouts vs. genuine moves
Critical for avoiding false signals
Zone Strength Period (Default: 20)
Bars used to assess supply/demand zone strength
Range: 10-50
Longer periods = More thorough zone validation
Shorter periods = Faster zone assessment
Liquidity Sweep Threshold (Default: 0.5%)
Percentage move required to confirm liquidity sweep
Range: 0.1-2.0%
Lower values = More sensitive sweep detection
Higher values = Only significant sweeps detected
Sentiment and Flow Settings
Enable Sentiment Analysis (Default: True)
Master control for market sentiment calculations
Includes fear/greed index and regime classification
Important for market context assessment
Fear/Greed Period (Default: 20)
Calculation period for market sentiment indicator
Range: 10-50
Based on price volatility and momentum
Shorter periods = More reactive sentiment readings
Momentum Regime Length (Default: 50)
Period for determining overall market regime
Range: 20-100
Classifies market as Bull/Bear/Sideways
Longer periods = More stable regime classification
Trend Strength Length (Default: 30)
Period for ADX-like trend strength calculation
Range: 10-100
Measures directional momentum intensity
Used in signal filtering requirements
Advanced Signal Generation Settings
Enable Signal Filtering (Default: True)
Master control for premium signal generation system
When disabled, uses basic signal conditions
Highly recommended to keep enabled
Minimum Signal Confluence Score (Default: 80)
Required confluence score for signal generation
Range: 70-95
Higher values = Fewer but higher quality signals
Lower values = More frequent but potentially lower quality signals
Signal Cooldown (Default: 10 bars)
Minimum bars between signals of same type
Range: 5-50
Prevents signal spam and overtrading
Higher values = More conservative signal spacing
Require Volume Confirmation (Default: True)
Mandates volume requirements for signal generation
Requires 1.5x average volume + 25% volume ROC
Critical for signal quality
Require Momentum Confirmation (Default: True)
Mandates divergence detection for signals
Ensures momentum backing for directional moves
Essential for high-probability setups
Minimum Trend Strength (Default: 25)
Required ADX level for signal generation
Range: 15-40
Ensures signals occur in trending markets
Higher values = Only strong trending conditions
Confluence Scoring Settings
Minimum Confluence Score (Default: 70)
Threshold for displaying support/resistance levels
Range: 50-90
Levels below this score are filtered out
Higher values = Only strongest levels shown
Component Weights (Default: 25% each)
Divergence Weight: Momentum component influence (10-40%)
Volume Weight: Volume analysis influence (10-40%)
Price Action Weight: Price patterns influence (10-40%)
Sentiment Weight: Market sentiment influence (10-40%)
Must total 100% for balanced scoring
Vitality Field Settings
Enable Vitality Field (Default: True)
Controls the background gradient field display
Provides instant visual market sentiment feedback
Enhances chart readability and context
Vitality Center Transparency (Default: 85%)
Opacity at the center of the vitality field
Range: 70-95%
Lower values = More opaque center
Higher values = More transparent center
Vitality Edge Transparency (Default: 98%)
Opacity at the edges of the vitality field
Range: 95-99%
Creates smooth fade effect from center to edges
Higher values = More subtle edge appearance
Vitality Field Size (Default: 8.0)
Controls the overall size of the vitality field
Range: 3.0-20.0
Based on ATR multiples for dynamic sizing
Lower values = Tighter field around price
Higher values = Broader field coverage
Recommended Settings by Trading Style
Scalping (1-5 minutes)
Base Length: 15
Volume MA Length: 20
Signal Cooldown: 5 bars
Vitality Field Size: 5.0
Higher sensitivity for quick moves
Day Trading (15-60 minutes)
Base Length: 25 (default)
Volume MA Length: 50 (default)
Signal Cooldown: 10 bars (default)
Vitality Field Size: 8.0 (default)
Balanced settings for intraday moves
Swing Trading (4H-Daily)
Base Length: 50
Volume MA Length: 100
Signal Cooldown: 20 bars
Vitality Field Size: 12.0
Longer-term perspective for multi-day moves
Conservative Trading
Minimum Signal Confluence: 85
Minimum Confluence Score: 80
Require all confirmations: True
Higher thresholds for maximum quality
Aggressive Trading
Minimum Signal Confluence: 75
Minimum Confluence Score: 65
Signal Cooldown: 5 bars
Lower thresholds for more opportunities

OpenAI Signal Generator - Enhanced Accuracy# AI-Powered Trading Signal Generator Guide
## Overview
This is an advanced trading signal generator that combines multiple technical indicators using AI-enhanced logic to generate high-accuracy trading signals. The indicator uses a sophisticated combination of RSI, MACD, Bollinger Bands, EMAs, ADX, and volume analysis to provide reliable buy/sell signals with comprehensive market analysis.
## Key Features
### 1. Multi-Indicator Analysis
- **RSI (Relative Strength Index)**
- Length: 14 periods (default)
- Overbought: 70 (default)
- Oversold: 30 (default)
- Used for identifying overbought/oversold conditions
- **MACD (Moving Average Convergence Divergence)**
- Fast Length: 12 (default)
- Slow Length: 26 (default)
- Signal Length: 9 (default)
- Identifies trend direction and momentum
- **Bollinger Bands**
- Length: 20 periods (default)
- Multiplier: 2.0 (default)
- Measures volatility and potential reversal points
- **EMAs (Exponential Moving Averages)**
- Fast EMA: 9 periods (default)
- Slow EMA: 21 periods (default)
- Used for trend confirmation
- **ADX (Average Directional Index)**
- Length: 14 periods (default)
- Threshold: 25 (default)
- Measures trend strength
- **Volume Analysis**
- MA Length: 20 periods (default)
- Threshold: 1.5x average (default)
- Confirms signal strength
### 2. Advanced Features
- **Customizable Signal Frequency**
- Daily
- Weekly
- 4-Hour
- Hourly
- On Every Close
- **Enhanced Filtering**
- EMA crossover confirmation
- ADX trend strength filter
- Volume confirmation
- ATR-based volatility filter
- **Comprehensive Alert System**
- JSON-formatted alerts
- Detailed technical analysis
- Multiple timeframe analysis
- Customizable alert frequency
## How to Use
### 1. Initial Setup
1. Open TradingView and create a new chart
2. Select your preferred trading pair
3. Choose an appropriate timeframe
4. Apply the indicator to your chart
### 2. Configuration
#### Basic Settings
- **Signal Frequency**: Choose how often signals are generated
- Daily: Signals at the start of each day
- Weekly: Signals at the start of each week
- 4-Hour: Signals every 4 hours
- Hourly: Signals every hour
- On Every Close: Signals on every candle close
- **Enable Signals**: Toggle signal generation on/off
- **Include Volume**: Toggle volume analysis on/off
#### Technical Parameters
##### RSI Settings
- Adjust `rsi_length` (default: 14)
- Modify `rsi_overbought` (default: 70)
- Modify `rsi_oversold` (default: 30)
##### EMA Settings
- Fast EMA Length (default: 9)
- Slow EMA Length (default: 21)
##### MACD Settings
- Fast Length (default: 12)
- Slow Length (default: 26)
- Signal Length (default: 9)
##### Bollinger Bands
- Length (default: 20)
- Multiplier (default: 2.0)
##### Enhanced Filters
- ADX Length (default: 14)
- ADX Threshold (default: 25)
- Volume MA Length (default: 20)
- Volume Threshold (default: 1.5)
- ATR Length (default: 14)
- ATR Multiplier (default: 1.5)
### 3. Signal Interpretation
#### Buy Signal Requirements
1. RSI crosses above oversold level (30)
2. Price below lower Bollinger Band
3. MACD histogram increasing
4. Fast EMA above Slow EMA
5. ADX above threshold (25)
6. Volume above threshold (if enabled)
7. Market volatility check (if enabled)
#### Sell Signal Requirements
1. RSI crosses below overbought level (70)
2. Price above upper Bollinger Band
3. MACD histogram decreasing
4. Fast EMA below Slow EMA
5. ADX above threshold (25)
6. Volume above threshold (if enabled)
7. Market volatility check (if enabled)
### 4. Visual Indicators
#### Chart Elements
- **Moving Averages**
- SMA (Blue line)
- Fast EMA (Yellow line)
- Slow EMA (Purple line)
- **Bollinger Bands**
- Upper Band (Green line)
- Middle Band (Orange line)
- Lower Band (Green line)
- **Signal Markers**
- Buy Signals: Green triangles below bars
- Sell Signals: Red triangles above bars
- **Background Colors**
- Light green: Buy signal period
- Light red: Sell signal period
### 5. Alert System
#### Alert Types
1. **Signal Alerts**
- Generated when buy/sell conditions are met
- Includes comprehensive technical analysis
- JSON-formatted for easy integration
2. **Frequency-Based Alerts**
- Daily/Weekly/4-Hour/Hourly/Every Close
- Includes current market conditions
- Technical indicator values
#### Alert Message Format
```json
{
"symbol": "TICKER",
"side": "BUY/SELL/NONE",
"rsi": "value",
"macd": "value",
"signal": "value",
"adx": "value",
"bb_upper": "value",
"bb_middle": "value",
"bb_lower": "value",
"ema_fast": "value",
"ema_slow": "value",
"volume": "value",
"vol_ma": "value",
"atr": "value",
"leverage": 10,
"stop_loss_percent": 2,
"take_profit_percent": 5
}
```
## Best Practices
### 1. Signal Confirmation
- Wait for multiple confirmations
- Consider market conditions
- Check volume confirmation
- Verify trend strength with ADX
### 2. Risk Management
- Use appropriate position sizing
- Implement stop losses (default 2%)
- Set take profit levels (default 5%)
- Monitor market volatility
### 3. Optimization
- Adjust parameters based on:
- Trading pair volatility
- Market conditions
- Timeframe
- Trading style
### 4. Common Mistakes to Avoid
1. Trading without volume confirmation
2. Ignoring ADX trend strength
3. Trading against the trend
4. Not considering market volatility
5. Overtrading on weak signals
## Performance Monitoring
Regularly review:
1. Signal accuracy
2. Win rate
3. Average profit per trade
4. False signal frequency
5. Performance in different market conditions
## Disclaimer
This indicator is for educational purposes only. Past performance is not indicative of future results. Always use proper risk management and trade responsibly. Trading involves significant risk of loss and is not suitable for all investors.

Advanced Candlestick Pattern DetectorWhat Does This Indicator Do?
This indicator looks at the way price moves in the market using candlesticks (those red and green bars you see on charts). It tries to find special patterns like Bullish Engulfing, Hammer, Doji, and others. When one of these patterns shows up, the indicator checks a bunch of filters to decide if the pattern is strong enough to be a signal to buy or sell.
The Main Parts of the Indicator
1. Candlestick Pattern Detection
Bullish Engulfing:
Imagine you see a small down candle (red) and then a big up candle (green) that completely “covers” the red one. That’s a bullish engulfing pattern. It can signal that buyers are taking over.
Bearish Engulfing:
The opposite of bullish engulfing. A small up candle (green) is followed by a big down candle (red) that covers the previous candle. This suggests sellers might be in control.
Hammer & Shooting Star:
Hammer: A candle with a very short body and a long shadow at the bottom. It shows that buyers stepped in after a drop.
Shooting Star:
Similar to the hammer but with a long shadow on top. It can indicate that sellers are starting to push the price down.
Doji:
A candle with almost no body. This means the opening and closing prices are very close. It shows indecision in the market.
Harami Patterns (Bullish & Bearish):
These are two-candle patterns where the second candle is completely inside the body of the first candle. They signal that the previous trend might be about to change.
Morning Star & Evening Star:
These are three-candle patterns.
Morning Star:
Often seen at the bottom of a downtrend, it can signal a reversal to an uptrend.
Evening Star:
Seen at the top of an uptrend, it can signal that the price may soon go down.
2. Filters: Making the Signals Smarter
The indicator doesn’t just rely on patterns. It uses several “filters” to decide if a pattern is strong enough to trade on. Here’s what each filter does:
a. Adaptive Thresholds (ATR-Based)
What It Is:
The indicator uses something called ATR (Average True Range) to see how much the price is moving (volatility).
How It Works:
Instead of using fixed numbers to decide if a candle is a Hammer or a Doji, it adjusts these numbers based on current market activity.
User Settings:
Use Adaptive Thresholds: Turn this on to let the indicator adjust automatically.
Body Factor, Shadow Factor, Doji Factor: These numbers are multipliers that decide how small or big the body and shadows of the candle should be. You can change them if you want the indicator to be more or less sensitive.
b. Volume Filter
What It Is:
Volume shows how many trades are happening.
How It Works:
The filter checks if the current volume is higher than the average volume (multiplied by a set factor). This helps ensure that the signal isn’t coming from a very quiet market.
User Settings:
Use Volume Filter: Turn this on if you want to ignore signals when there’s not much trading.
Volume MA Period & Volume Multiplier: These settings determine what “normal” volume is and how much higher the current volume must be to count.
c. Multi-Timeframe Trend Filter
What It Is:
This filter looks at a bigger picture by using a moving average (MA) from a higher timeframe (for example, daily charts).
How It Works:
For a bullish (buy) signal, the indicator checks if the price is above this MA.
For a bearish (sell) signal, the price must be below the MA.
User Settings:
Use Multi-Timeframe Trend Filter: Enable or disable this filter.
Higher Timeframe for Trend: Choose which timeframe (like Daily) to use.
Trend MA Type (SMA or EMA) & Trend MA Period: Choose the type of moving average and how many candles to average.
d. Additional Trend Filters (ADX & RSI)
ADX Filter:
What It Is:
ADX stands for Average Directional Index. It measures how strong a trend is.
How It Works:
If the ADX is above a certain threshold, it means the trend is strong.
User Setting:
ADX Threshold: Set the minimum strength the trend should have.
RSI Filter:
What It Is:
RSI (Relative Strength Index) tells you if the price is overbought (too high) or oversold (too low).
How It Works:
For a buy signal, RSI should be low (under a set threshold).
For a sell signal, RSI should be high (above a set threshold).
User Settings:
RSI Buy Threshold & RSI Sell Threshold: These set the levels for buying or selling.
3. How the Final Signal Is Determined
For a signal (buy or sell) to be generated, the indicator first checks if one of the candlestick patterns is present. Then it goes through all these filters (trend, volume, ADX, RSI). Only if everything is in line will it show:
A BUY signal when all bullish conditions are met.
A SELL signal when all bearish conditions are met.
4. Visual Elements on the Chart
Trend MA Line:
A blue line is drawn on your chart showing the moving average from the higher timeframe (if you enable the trend filter). This helps you see the overall direction of the market.
Labels on the Chart:
When a signal is detected, you’ll see:
A BUY label below the candle (green).
A SELL label above the candle (red).
Background Colors:
The chart background might change slightly (green for bullish and red for bearish) to give you a quick visual cue.
Histogram:
At the bottom, there is a histogram that shows +1 for bullish signals, -1 for bearish signals, and 0 when there’s no clear signal.
5. Alerts
Alerts are built into the indicator so you can get a notification when a signal appears. The alert messages are fixed strings, meaning they always say something like “BUY signal on at price .” You can set up these alerts in TradingView to be notified via sound, email, or pop-up.
How to Use and Adjust the Filters
Deciding on Patterns:
You can choose which candlestick patterns you want to detect by toggling the options (e.g., Bullish Engulfing, Hammer, etc.).
Adjusting Adaptive Thresholds:
If you feel that the indicator is too sensitive (or not sensitive enough) during volatile times, adjust the Body Factor, Shadow Factor, and Doji Factor. These change how the indicator recognizes different candle shapes based on market movement.
Volume Filter Settings:
Use Volume Filter:
Turn this on if you want to ignore signals when there’s not enough trading activity.
Adjust the Volume MA Period and Volume Multiplier to change what “normal” volume is for your chart.
Multi-Timeframe Trend Filter Settings:
Choose a higher timeframe (like Daily) to see the bigger picture trend. Select the type of moving average (SMA or EMA) and its period. This filter ensures you only trade in the direction of the overall trend.
ADX & RSI Filters:
ADX:
Adjust the ADX Threshold if you want to change the minimum strength of the trend needed for a signal.
RSI:
Set the RSI Buy Threshold (for oversold conditions) and RSI Sell Threshold (for overbought conditions) to refine when a signal is valid.
Summary
This indicator is like having a smart assistant that not only looks for specific price patterns (candlesticks) but also checks if the overall market conditions are right using several filters. By combining:
Pattern Detection
Adaptive thresholds (based on ATR)
Volume Checks
Multi-Timeframe Trend Analysis
Additional Trend Strength and Overbought/Oversold Indicators (ADX & RSI)
...it helps you decide if it might be a good time to buy or sell. You can customize each part to fit your trading style, and with the built-in alerts, you can be notified when everything lines up.
Feel free to adjust the settings to see how each filter changes the signals on your chart. Experimenting with these will help you learn how the market behaves and how you can best use the indicator for your own strategy!

Crypto Scanner v4This guide explains a version 6 Pine Script that scans a user-provided list of cryptocurrency tokens to identify high probability tradable opportunities using several technical indicators. The script combines trend, momentum, and volume-based analyses to generate potential buying or selling signals, and it displays the results in a neatly formatted table with alerts for trading setups. Below is a detailed walkthrough of the script’s design, how traders can interpret its outputs, and recommendations for optimizing indicator inputs across different timeframes.
## Overview and Key Components
The script is designed to help traders assess multiple tokens by calculating several indicators for each one. The key components include:
- **Input Settings:**
- A comma-separated list of symbols to scan.
- Adjustable parameters for technical indicators such as ADX, RSI, MFI, and a custom Wave Trend indicator.
- Options to enable alerts and set update frequencies.
- **Indicator Calculations:**
- **ADX (Average Directional Index):** Measures trend strength. A value above the provided threshold indicates a strong trend, which is essential for validating momentum before entering a trade.
- **RSI (Relative Strength Index):** Helps determine overbought or oversold conditions. When the RSI is below the oversold level, it may present a buying opportunity, while an overbought condition (not explicitly part of this setup) could suggest selling.
- **MFI (Money Flow Index):** Similar in concept to RSI but incorporates volume, thus assessing buying and selling pressure. Values below the designated oversold threshold indicate potential undervaluation.
- **Wave Trend:** A custom indicator that calculates two components (WT1 and WT2); a crossover where WT1 moves from below to above WT2 (particularly near oversold levels) may signal a reversal and a potential entry point.
- **Scanning and Trading Zone:**
- The script identifies a *bullish setup* when the following conditions are met for a token:
- ADX exceeds the threshold (strong trend).
- Both RSI and MFI are below their oversold levels (indicating potential buying opportunities).
- A Wave Trend crossover confirms near-term reversal dynamics.
- A *trading zone* condition is also defined by specific ranges for ADX, RSI, MFI, and a limited difference between WT1 and WT2. This zone suggests that the token might be in a consolidation phase where even small moves may be significant.
- **Alerts and Table Reporting:**
- A table is generated, with each row corresponding to a token. The table contains columns for the symbol, ADX, RSI, MFI, WT1, WT2, and the trading zone status.
- Visual cues—such as different background colors—highlight tokens with a bullish setup or that are within the trading zone.
- Alerts are issued based on the detection of a bullish setup or entry into a trading zone. These alerts are limited per bar to avoid flooding the trader with notifications.
## How to Interpret the Indicator Outputs
Traders should use the indicator values as guidance, verifying them against their own analysis before making any trading decision. Here’s how to assess each output:
- **ADX:**
- **High values (above threshold):** Indicate strong trends. If other indicators confirm an oversold condition, a trader may consider a long position for a corrective reversal.
- **Low values:** Suggest that the market is not trending strongly, and caution should be taken when considering entry.
- **RSI and MFI:**
- **Below oversold levels:** These conditions are traditionally seen as signals that an asset is undervalued, potentially triggering a bounce.
- **Above typical resistance levels (not explicitly used here):** Would normally caution a trader against entering a long position.
- **Wave Trend (WT1 and WT2):**
- A crossover where WT1 moves upward above WT2 in an oversold environment can signal the beginning of a recovery or reversal, thereby reinforcing buy signals.
- **Trading Zone:**
- Being “in zone” means that the asset’s current values for ADX, RSI, MFI, and the closeness of the Wave Trend lines indicate a period of consolidation. This scenario might be suitable for both short-term scalping or as an early exit indicator, depending on further market analysis.
## Timeframe Optimization Input Table
Traders can optimize indicator inputs depending on the timeframe they use. The following table provides a set of recommended input values for various timeframes. These values are suggestions and should be adjusted based on market conditions and individual trading styles.
Timeframe ADX RSI MFI ADX RSI MFI WT Channel WT Average
5-min 10 10 10 20 30 20 7 15
15-min 12 12 12 22 30 20 9 18
1-hour 14 14 14 25 30 20 10 21
4-hour 16 16 16 27 30 20 12 24
1-day 18 18 18 30 30 20 14 28
Adjust these parameters directly in the script’s input settings to match the selected timeframe. For shorter timeframes (e.g., 5-min or 15-min), the shorter lengths help filter high-frequency noise. For longer timeframes (e.g., 1-day), longer input values may reduce false signals and capture more significant trends.
## Best Practices and Usage Tips
- **Token Limit:**
- Limit the number of tokens scanned to 10 per query line. If you need to scan more tokens, initiate a new query line. This helps manage screen real estate and ensures the table remains legible.
- **Confirming Signals:**
- Use this script as a starting point for identifying high potential trades. Each indicator’s output should be used to confirm your trading decision. Always cross-reference with additional technical analysis tools or market context.
- **Regular Review:**
- Since the script updates the table every few bars (as defined by the update frequency), review the table and alerts regularly. Market conditions change rapidly, so timely decisions are crucial.
## Conclusion
This Pine Script provides a comprehensive approach for scanning multiple cryptocurrencies using a combination of trend strength (ADX), momentum (RSI and MFI), and reversal signals (Wave Trend). By using the provided recommendation table for different timeframes and limiting the tokens to 20 per query line (with a maximum of four query lines), traders can streamline their scanning process and more effectively identify high probability tradable tokens. Ultimately, the outputs should be critically evaluated and combined with additional market research before executing any trades.

Johnny's Machine Learning Moving Average (MLMA) w/ Trend Alerts📖 Overview
Johnny's Machine Learning Moving Average (MLMA) w/ Trend Alerts is a powerful adaptive moving average indicator designed to capture market trends dynamically. Unlike traditional moving averages (e.g., SMA, EMA, WMA), this indicator incorporates volatility-based trend detection, Bollinger Bands, ADX, and RSI, offering a comprehensive view of market conditions.
The MLMA is "machine learning-inspired" because it adapts dynamically to market conditions using ATR-based windowing and integrates multiple trend strength indicators (ADX, RSI, and volatility bands) to provide an intelligent moving average calculation that learns from recent price action rather than being static.
🛠 How It Works
1️⃣ Adaptive Moving Average Selection
The MLMA automatically selects one of four different moving averages:
📊 EMA (Exponential Moving Average) – Reacts quickly to price changes.
🔵 HMA (Hull Moving Average) – Smooth and fast, reducing lag.
🟡 WMA (Weighted Moving Average) – Gives recent prices more importance.
🔴 VWAP (Volume Weighted Average Price) – Accounts for volume impact.
The user can select which moving average type to use, making the indicator customizable based on their strategy.
2️⃣ Dynamic Trend Detection
ATR-Based Adaptive Window 📏
The Average True Range (ATR) determines the window size dynamically.
When volatility is high, the moving average window expands, making the MLMA more stable.
When volatility is low, the window shrinks, making the MLMA more responsive.
Trend Strength Filters 📊
ADX (Average Directional Index) > 25 → Indicates a strong trend.
RSI (Relative Strength Index) > 70 or < 30 → Identifies overbought/oversold conditions.
Price Position Relative to Upper/Lower Bands → Determines bullish vs. bearish momentum.
3️⃣ Volatility Bands & Dynamic Support/Resistance
Bollinger Bands (BB) 📉
Uses standard deviation-based bands around the MLMA to detect overbought and oversold zones.
Upper Band = Resistance, Lower Band = Support.
Helps traders identify breakout potential.
Adaptive Trend Bands 🔵🔴
The MLMA has built-in trend envelopes.
When price breaks the upper band, bullish momentum is confirmed.
When price breaks the lower band, bearish momentum is confirmed.
4️⃣ Visual Enhancements
Dynamic Gradient Fills 🌈
The trend strength (ADX-based) determines the gradient intensity.
Stronger trends = More vivid colors.
Weaker trends = Lighter colors.
Trend Reversal Arrows 🔄
🔼 Green Up Arrow: Bullish reversal signal.
🔽 Red Down Arrow: Bearish reversal signal.
Trend Table Overlay 🖥
Displays ADX, RSI, and Trend State dynamically on the chart.
📢 Trading Signals & How to Use It
1️⃣ Bullish Signals 📈
✅ Conditions for a Long (Buy) Trade:
The MLMA crosses above the lower band.
The ADX is above 25 (confirming trend strength).
RSI is above 55, indicating positive momentum.
Green trend reversal arrow appears (confirmation of a bullish reversal).
🔹 How to Trade It:
Enter a long trade when the MLMA turns bullish.
Set stop-loss below the lower Bollinger Band.
Target previous resistance levels or use the upper band as take-profit.
2️⃣ Bearish Signals 📉
✅ Conditions for a Short (Sell) Trade:
The MLMA crosses below the upper band.
The ADX is above 25 (confirming trend strength).
RSI is below 45, indicating bearish pressure.
Red trend reversal arrow appears (confirmation of a bearish reversal).
🔹 How to Trade It:
Enter a short trade when the MLMA turns bearish.
Set stop-loss above the upper Bollinger Band.
Target the lower band as take-profit.
💡 What Makes This a Machine Learning Moving Average?
📍 1️⃣ Adaptive & Self-Tuning
Unlike static moving averages that rely on fixed parameters, this MLMA automatically adjusts its sensitivity to market conditions using:
ATR-based dynamic windowing 📏 (Expands/contracts based on volatility).
Adaptive smoothing using EMA, HMA, WMA, or VWAP 📊.
Multi-indicator confirmation (ADX, RSI, Volatility Bands) 🏆.
📍 2️⃣ Intelligent Trend Confirmation
The MLMA "learns" from recent price movements instead of blindly following a fixed-length average.
It incorporates ADX & RSI trend filtering to reduce noise & false signals.
📍 3️⃣ Dynamic Color-Coding for Trend Strength
Strong trends trigger more vivid colors, mimicking confidence levels in machine learning models.
Weaker trends appear faded, suggesting uncertainty.
🎯 Why Use the MLMA?
✅ Pros
✔ Combines multiple trend indicators (MA, ADX, RSI, BB).
✔ Automatically adjusts to market conditions.
✔ Filters out weak trends, making it more reliable.
✔ Visually intuitive (gradient colors & reversal arrows).
✔ Works across all timeframes and assets.
⚠️ Cons
❌ Not a standalone strategy → Best used with volume confirmation or candlestick analysis.
❌ Can lag slightly in fast-moving markets (due to smoothing).

Strength Measurement -HTStrength Measurement -HT
This indicator provides a comprehensive view of trend strength by calculating the average ADX (Average Directional Index) across multiple timeframes. It helps traders identify strong trends, potential reversals, and confirm signals from other indicators.
Key Features:
Multi-Timeframe Analysis: Analyze trend strength across different timeframes. Choose which timeframes to include in the calculation (5 min, 15 min, 30 min, 1 hour, 4 hour).
Customizable ADX Parameters: Adjust the ADX smoothing (adxlen) and DI length (dilen) parameters to fine-tune the indicator to your preferred settings.
Smoothed Average ADX: The average ADX is smoothed using a Simple Moving Average to reduce noise and provide a clearer picture of the overall trend.
Color-Coded Visualization: The histogram clearly indicates trend direction and strength:
Green: Uptrend
Red: Downtrend
Darker shades: Stronger trend
Lighter shades: Weaker trend
Reference Levels: Includes horizontal lines at 25, 50, and 75 to provide benchmarks for trend strength classification.
Alerts: Set alerts for strong trend up (ADX crossing above 50) and weakening trend (ADX crossing below 25).
How to Use:
Select Timeframes: Choose the timeframes you want to include in the average ADX calculation.
Adjust ADX Parameters: Fine-tune the adxlen and dilen values based on your trading style and the timeframe of the chart.
Identify Strong Trends: Look for histogram bars with darker green or red colors, indicating a strong trend.
Spot Potential Reversals: Watch for changes in histogram color and height, which may suggest a weakening trend or a potential reversal.
Combine with Other Indicators: Use this indicator with other technical analysis tools to confirm trading signals.
Note: This indicator is based on the ADX, which is a lagging indicator.

DMI Delta by 0xjcfOverview
This indicator integrates the Directional Movement Index (DMI), Average Directional Index (ADX), and volume analysis into an Oscillator designed to help traders identify divergence-based trading signals. Unlike typical volume or momentum indicators, this combination provides insight into directional momentum and volume intensity, allowing traders to make well-informed decisions based on multiple facets of market behavior.
Purpose and How Components Work Together
By combining DMI and ADX with volume analysis, this indicator helps traders detect when momentum diverges from price action—a common precursor to potential reversals or significant moves. The ADX filter enhances this by distinguishing trending from range-bound conditions, while volume analysis highlights moments of extreme sentiment, such as solid buying or selling. Together, these elements provide traders with a comprehensive view of market strength, directional bias, and volume surges, which help filter out weaker signals.
Key Features
DMI Delta and Oscillator: The DMI indicator measures directional movement by comparing DI+ and DI- values. This difference (DMI Delta) is calculated and displayed as a histogram, visualizing changes in directional bias. When combined with ADX filtering, this histogram helps traders gauge the strength of momentum and spot directional shifts early. For instance, a rising histogram in a bearish price trend might signal a potential bullish reversal.
Volume Analysis with Extremes: Volume is monitored to reveal when market participation is unusually high, using a customizable multiplier to highlight significant volume spikes. These extreme levels are color-coded directly on the histogram, providing visual cues on whether buying or selling interest is particularly strong. Volume analysis adds depth to the directional insights from DMI, allowing traders to differentiate between regular and powerful moves.
ADX Trending Filter: The ADX component filters trends by measuring the overall strength of a price move, with a default threshold of 25. When ADX is above this level, it suggests that the market is trending strongly, making the DMI Delta readings more reliable. Below this threshold, the market is likely range-bound, cautioning traders that signals might not have as much follow-through.
Using the Indicator in Divergence Strategies
This indicator excels in divergence strategies by highlighting moments when price action diverges from directional momentum. Here’s how it aids in decision-making:
Bullish Divergence: If the price is falling to new lows while the DMI Delta histogram rises, it can indicate weakening bearish momentum and signal a potential price reversal to the upside.
Bearish Divergence: Conversely, if prices are climbing but the DMI Delta histogram falls, it may point to waning bullish momentum, suggesting a bearish reversal.
Visual Cues and Customization
The color-coded output enhances usability:
Bright Green/Red: Extreme volume with strong bullish or bearish signals, often at points of high potential for trend continuation or reversal.
Green/Red Shades: These shades reflect trending conditions (bullish or bearish) based on ADX, factoring in volume. Green signals a bullish trend, and red is a bearish trend.
Blue/Orange Shades: Indicates non-trending or weaker conditions, suggesting a more cautious approach in range-bound markets.
Customizable for Diverse Trading Styles
This indicator allows users to adjust settings like the ADX threshold and volume multiplier to optimize performance for various timeframes and strategies. Whether a trader prefers swing trading or intraday scalping, these parameters enable fine-tuning to enhance signal reliability across different market contexts.
Practical Usage Tips
Entry and Exit Signals: Use this indicator in conjunction with price action. Divergences between the price and DMI Delta histogram can reinforce entry or exit decisions.
Adjust Thresholds: Based on backtesting, customize the ADX Trending Threshold and Volume Multiplier to ensure optimal performance on different timeframes or trading styles.
In summary, this indicator is tailored for traders seeking a multi-dimensional approach to market analysis. It blends momentum, trend strength, and volume insights to support divergence-based strategies, helping traders confidently make informed decisions. Remember to validate signals through backtesting and use it alongside price action for the best results.
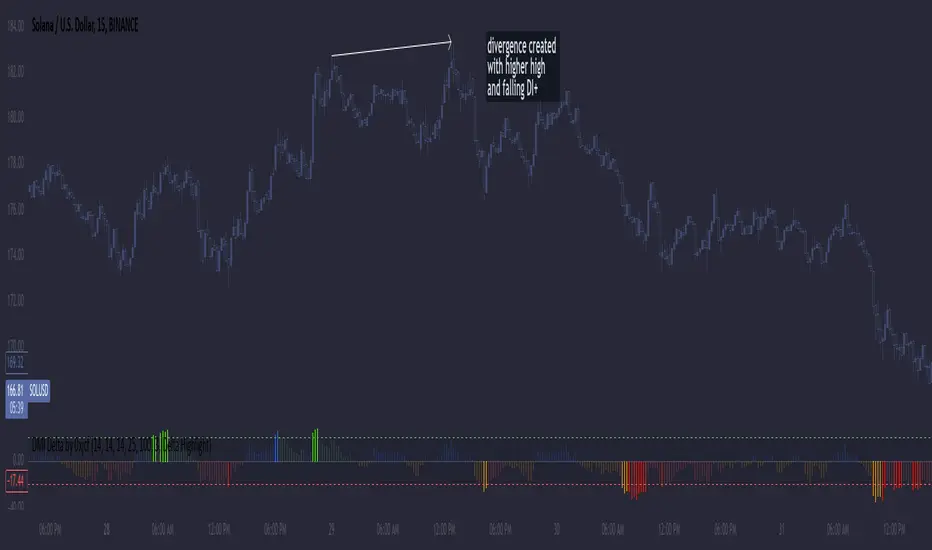
Single Swing Strategy (SSS)Introduction
The Single Swing Strategy (SSS) is a trading strategy designed for assets that trend. It utilises a single technical indicator to identify potential buying opportunities in upward-trending markets. The strategy focuses on moments when the price of an asset breaks out to a new high, suggesting a strong upward momentum.
Components
1. Exponential Moving Averages (EMAs): SSS uses two EMAs to evaluate the overall asset trend. SSS describes an uptrend as identified, when the fast EMA crosses above the slow EMA and vice versa for a downtrend.
2. Breakout: The strategy validates the trend identified by the EMAs through breakouts in the price action of the asset over a specified lookback period. No indicator is required for this step.
3. Average Directional Index (ADX): The ADX is used to measure the strength of a trend. It does not indicate the trend's direction but rather its strength, whether it's an uptrend or downtrend. A high ADX value (typically above 25) suggests a strong trend, either up or down while a low ADX value (typically below 20) indicates a weak or non-trending market. The ADX itself is a moving average of the expanding range between the +DI and -DI.
4. Positive Directional Indicator (DI+): DI+ helps identify the presence and strength of uptrends. It is calculated based on the upward price movement between current and previous highs. A rising DI+ alongside a rising ADX suggests a strengthening uptrend. When DI+ crosses above DI-, it's often interpreted as a bullish signal.
5. Negative Directional Indicator (DI-): DI- is used to detect the presence and strength of downtrends.It is derived from the downward price movement between current and previous lows. An increasing DI- along with a rising ADX indicates a strengthening downtrend while a crossover of DI- above DI+ is typically seen as a bearish signal.
How it works
1. Regime filter with ADX, DI+, and DI-: The first step in taking a trade is to determine the direction of the trend using the +DI. If in an uptrend, the strategy checks if the ADX is above 25 to confirm a strong uptrend. -DI is not used since the strategy is long only. If in an uptrend and the trend is strong, trades can be opened.
2. Trend Identification with EMAs: Initially, the strategy uses two Exponential Moving Averages (fast and slow) to determine the asset trend. A fast EMA crossing above the slow EMA signifies an uptrend, and vice versa for a downtrend. This is the Entry signal to open a long position.
3. Trend Confirmation with Breakout: The strategy confirms the EMA-indicated trend through price breakouts over a specified lookback period. An EMA crossover without a price action breakout does not lead to an entry signal
4. Trade Management: After entering a trade, the strategy uses predefined levels for taking profit and setting stop losses. Trades are closed either when the price reaches the take-profit level or falls to the stop-loss level. Hence, risk management is built in.
Results
The backtest results can be found below. Initial capital of 10000 was used, this is a convenient amount for most retail traders, commission of $3 per order, position size of 3% of initial capital and slippage of 3 ticks. These are all representative of real world retail trading conditions.
Originality
The Single Swing Strategy (SSS)'s originality is in its blending of classical technical analysis; Trend Analysis through EMAs and Price Action through Breakout, into an innovative trading logic.
1. The Essence of Trend and Breakout in SSS
(i) Trend Recognition: At the heart of SSS is the Exponential Moving Averages (EMAs). While the use of EMAs is common, SSS employs them for trend analysis so an entry decision can be made. The strategy's core algorithm assesses the inception of an upward trend by observing a specific crossing pattern of the EMAs, a moment where the asset's momentum shifts, offering a strategic advantage.
(ii) Breakout Significance: The strategy's reliance on price breakouts isn't just about identifying a new high; it's about understanding market psychology. A breakout beyond a previous high signals not only momentum but also a collective market sentiment that favors upward movement. SSS attempts to capture this momentum, translating it into a tangible trading opportunity.
(iii)Strength of trend: The ADX and +DI double checks the trend is in the right direction and checks to see if the trend is strong enough hence, it prevents trading when the trend is not supportive.
2. Simplicity as a Cornerstone
(i) Clarity and Efficiency: In the realm of algorithmic trading, complexity isn't always synonymous with effectiveness. SSS' simplicity ensures its logic is transparent and its execution, efficient. This simplicity is a strategic choice, designed to reduce overfitting to past data and improve adaptability to real-market conditions.
(ii) Ease of Use and Decision Making: The straightforward nature of SSS may empower traders to make informed decisions without being overwhelmed by convoluted indicators. This is particularly useful because of the embedding of risk management using defined exit points after entry through a Take Profit and Stop Loss. This hardcodes a 3:1 risk reward ratio into every trade.
3. Positive Expectancy
(i) Performance Metrics: The SSS strategy shows its edge in its backtesting results. A 62% win rate, a profit factor of 1.7, profit ratio of 1.05 and an average trade gain of 4.7% are not just numbers; they show the mathematical edge over the backtest period, especially considering the high commissions and slippage factored into its design.
Trading
The SSS strategy has been backtested on the 1D timeframe of BTCUSD but users are encouraged to try it on other assets such as SPXL (5min), AAPL (5min) and others but the appropriate timeframe and trading costs may vary.
NOTE
Like any trading strategy, SSS does not guarantee profits. It's a tool to assist in decision-making, not a foolproof solution. Trading involves risks, particularly in volatile markets. Users should trade responsibly, considering their risk tolerance and financial situation. While SSS automates some aspects of trading, it requires continuous monitoring and does not replace the need for sound judgement and decision-making by the trader.

Previous Day High Low Strategy only for LongWelcome to the "Previous Day High Low Strategy only for Long"!.
This strategy aims to identify potential long trading opportunities based on the previous day's high and low prices, along with certain market strength conditions.
Key Features:
Entry Conditions: The strategy triggers a long position when the current day's closing price crosses above the previous day's high or low.
Market Strength Filter: The strategy incorporates a market strength filter using the Average Directional Index (ADX). It only takes long positions when the ADX value is above a specific threshold and when there is a predominance of upward movement.
Trade Timing: The strategy operates within a specified trade window, starting at 09:30 and ending at 15:10. Positions are closed at 15:15 if still active.
Risk Management: The strategy employs dynamic stop-loss and profit-taking levels based on a user-defined Max Profit value. It has three profit targets (T1, T2, T3) and a stop-loss level to manage risk effectively.
Rules:
Ensure that the strategy idea is clearly understandable. Provide an easy-to-read title and a thoughtful description explaining the reasoning behind the strategy.
All content should be ad-free. Avoid any form of promotion, advertising, or solicitation.
No fundraising requests or money solicitation is allowed on TradingView.
Publish in the same language as the TradingView subdomain you're on, except for script titles, which must be in English.
Don't plagiarize. Create and share only unique content, and always give credit when using someone else's work.
Be respectful, kind, and constructive when engaging with others.
Zero tolerance for contentious political discourse, defamatory, threatening, or discriminatory remarks.
Avoid sharing harmful, misleading, or inappropriate content.
Respect the moderators' work and address complaints privately.
Use only your original account and avoid creating duplicate or fake accounts.
Do not attempt to manipulate the reputation system or engage in like-for-like schemes.
Explanation of how the strategy works
1. Previous Day's High and Low (HH, LL):
In this strategy, we start by obtaining the high and low prices of the previous day (not the current day) using the request.security function. This function allows us to access historical data for a specific time frame. The high and low prices are stored in the variables HH and LL, respectively.
2. Entry Conditions:
The strategy uses two conditions to trigger a long position:
Condition 1 (Long Condition 1): If the closing price of the current day crosses above the previous day's high (HH), it generates a long signal. This is achieved using the ta.crossover function, which detects when a crossover occurs.
Condition 2 (Long Condition 2): Similarly, if the closing price of the current day crosses above the previous day's low (LL), it also generates a long signal.
Combined Condition: To take long positions, the strategy combines both long conditions using the logical OR operator (or). This means that if either of the two conditions is met, a long position will be initiated.
3. Market Strength Filter:
The strategy also includes a filter based on the Average Directional Index (ADX) to gauge the market's strength before taking long positions. The ADX measures the strength of a trend in the market. The higher the ADX value, the stronger the trend.
Calculation of ADX: The ADX is calculated using the adx function, which takes two parameters: LWdilength (DMI Length) and LWadxlength (ADX period).
Strength Condition (strength_up): The strategy requires that the ADX value should be above a threshold (11 in this case) and that there is a predominance of upward movement (up > down) before initiating a long position. The LWADX value is multiplied by 2.5 and compared to the highest value of LWADX from the last 4 periods using ta.highest(LWADX , 4). If these conditions are met, the variable strength_up is set to true.
Combined Condition: The strength_up condition is then combined with the long conditions using the logical AND operator (and). This means that the strategy will only take a long position if both the long conditions and the market strength condition are met.
4. Trade Timing:
The strategy sets a specific trade window between 09:30 and 15:10. It will only execute trades within this time frame (TradeTime).
5. Risk Management:
The strategy implements dynamic stop-loss (SL) and profit-taking levels (T1, T2, T3) based on a user-defined Max Profit value. The stop-loss is set as a percentage of the Max Profit value. As the position moves in favor of the trader, the profit targets are adjusted accordingly.
6. Position Management:
The strategy uses the strategy.entry function to enter long positions based on the combined entry conditions. Once a position is open, the script uses strategy.exit to define the exit condition when either the profit target or stop-loss level is hit. The strategy.close function is used to close any open position at the end of the trade window (15:15).
7. Plotting:
The strategy uses the plot function to visualize the previous day's high and low prices, as well as the stop-loss (SL) and profit-taking (T1, T2, T3) levels on the chart.
Overall, the "Previous Day High Low Strategy only for Long" aims to identify potential long trading opportunities based on the previous day's price action and market strength conditions. However, as with any trading strategy, it's essential to thoroughly test it and consider risk management before applying it to real-world trading scenarios.
Disclaimer:
The information presented by this strategy is for educational purposes only and should not be considered as investment advice. The strategy is not designed for qualified investors. Always conduct your own research and consult with a financial advisor before making any trading decisions.
Remember, the success of any trading strategy depends on various factors, including market conditions, risk management, and individual trading skills. Past performance is not indicative of future results.

gangood bot for FinandyGangood is a mean reversion algorithm currently optimized for trading the ETH/USDT pair on the 1 hour chart time frame. All indicator inputs use the closing price of the period, and all trades are executed at the open of the period following the period in which the trading signal was generated.
To take into account slippage, the commission costs 0.15%.
Backtest result from 2020.
Result since 2019 2,500,000%, maximum drawdown 18%
This bot uses 11 indicators:
1) ADX
2) RANGE FILTER
3) SAR
4) RSI
5) TWAP
6) JMA
7) MACD
8) VOLUME DELTA
9) VOLUME WEIGHT
10) MA
11) TSI
Pattern 1:
There are 3 main components that make up Gangood: I. Trend Filter. The algorithm uses a version of the ADX indicator as a trend filter to only trade during certain time periods when price is most likely to be range-bound (i.e., average retracement). This indicator consists of a fast ADX and a slow ADX both using the same lookback period.
The ADX is smoothed with a 6-period EMA and the slow ADX is smoothed with a 12-period EMA. When the fast ADX is above the slow ADX , the algorithm does not trade because it indicates that the price is most likely trending, which is bad for a mean reversion system. Conversely, when the fast ADX is below the slow ADX, the price is likely to be in a range, so this is the only time the algorithm is allowed to trade. II. Bollinger Bands When the trend filter allows trading, the algorithm uses Bollinger Bands.
Indicator for opening long and short positions. The Bolliger Bands indicator has a 20 lookback period and a 1.5 standard deviation for both the upper and lower bands. When the price crosses the lower band, a buy signal is generated and a long position is opened. When the price crosses the upper band, a sell signal is generated and a short position is opened.
Pattern 2:
Based on RSI which is commonly used as a trend reversal indicator. However, here it is used as a trend-setting indicator, often with great success. This pattern only takes long trades, which is quite successful in a bull market.
Pattern 3:
Long or short trades are determined by the intersection of the fast EMA with the slow EMA for long positions and vice versa for short positions. Trades should only occur close to intersections. We then use the MACD for the long position. an indicator with a 10-minute time frame where we look for high peaks in negative values for longs and vice versa for shorts. They should be significantly higher than the other peaks.
Capital Management:
The maximum leverage in this strategy, I would recommend 2x, in order to trade without unnecessary risks and keep your nerves in order.
Bot setup:
I use the Finandy terminal, in which you can easily trade with this strategy.
1. We go to binance and turn on the hedging mode, this is necessary so that if tradingview sends a webhook for buying later than for selling.
2. Adding a new signal to Finandy
2.1. Open tab
2.1.1. "Order side" Strategy
2.1.2. "Amount" Balance% x Leverage
2.1.3. We set the percentage of the order two times less than the one you want
2.1.4. "Shoulder" is twice as large as the one you want
2.2.Close tab
2.2.1. "Enebaled" tick
2.2.2. "Reverse / Close" Disable
3. Set a notification for this strategy.
4. Copy "Signal URL" and paste it into webhook on tradingview
5. Copy "Signal Message" and paste it into the message on tradingview
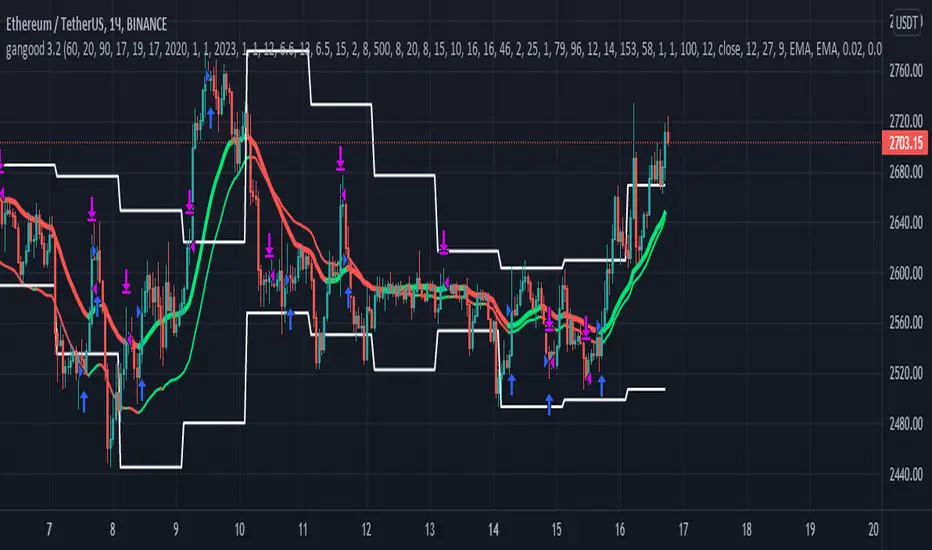
Nifty 50 Indicator Indicator Name:
9 & 20 EMA + ADX(7) Full System (Confirmed Breakout - Stable)
Purpose:
To identify buy/sell signals based on EMA crossovers and ADX confirmation.
To track confirmed breakout levels and calculate a trailing stop-loss (SL).
To display relevant trading information in a table and visually on the chart.
Logic and Components:
1️⃣ Indicators Used
EMA(9) and EMA(20):
Used to detect trend direction and crossovers.
ADX(7):
Measures trend strength to classify signals as strong or weak.
2️⃣ Signal Generation
Strong Buy: EMA9 crosses above EMA20 and ADX > 20
Weak Buy: EMA9 crosses above EMA20 and ADX ≤ 20
Strong Sell: EMA9 crosses below EMA20 and ADX > 20
Weak Sell: EMA9 crosses below EMA20 and ADX ≤ 20
3️⃣ Confirmed Breakout Logic
Tracks the highest high after a buy signal (confirmedHigh).
Tracks the lowest low after a sell signal (confirmedLow).
Only updates confirmed levels if price continues in the signal direction.
4️⃣ Trailing Stop-Loss (SL)
Calculated from confirmed price, not entry price.
Buy: trailingSL = confirmedHigh * (1 - 0.009)
Sell: trailingSL = confirmedLow * (1 + 0.009)
Plotted on the chart as a red line, thicker and extending to the right.
5️⃣ Visual Elements on Chart
EMAs:
EMA9 (green), EMA20 (red).
Triangles for signals:
Medium size, hollow, colored outline.
Up triangles for buy, down triangles for sell.
Trailing SL line:
Red, width=3, extends 50 bars to the right.
6️⃣ Table Display
Shows key variables for each active signal:
Signal Type (Strong/Weak Buy/Sell)
Entry Price
Confirmed Price
Confirmed Move (Price difference from entry to confirmed)
ADX Value
Trailing SL
Summary of Workflow
Detect EMA crossovers.
Filter signals by ADX to determine strength.
Record entry price and initial confirmed high/low.
Update confirmed high/low if price continues in trend.
Calculate trailing SL from confirmed price.
Plot EMAs, signals (triangles), and trailing SL line.
Display all key information in a table on the chart.
✅ Key Features:
Dynamic trailing stoploss based on confirmed breakout.
Distinguishes strong vs weak signals.
Visual cues: hollow triangles for signals, SL line, and table summary.
Works entirely on the chart, ready for trading analysis.

Reddington Regime Panel + PlaybookReddington Regime Panel + Playbook
On-chart market regime panel and strategy playbook for use with ReddingtonBotAdaptive Signal.
Shows the current regime (Trend / Correction / Range), key metrics (TF, ADX, +DI/−DI, BB Width, RSI), directional bias, and a Playbook with live recommendations for the ReddingtonBotAdaptive Signal strategies ST / MACD / BB / SC / CT:
✅ Use
⚠ Use with caution / extra condition
❌ Avoid
This script is a context filter. Pair it with ReddingtonBotAdaptive Signal to decide when its entries are most appropriate.
What it does
Classifies the market on your chosen timeframe into:
TREND UP / TREND DOWN / CORRECTION UP / CORRECTION DOWN / RANGE.
Guides strategy selection for ReddingtonBotAdaptive Signal via a compact on-chart table.
Multi-timeframe & multi-asset: works on any symbol and exchange; calculations are performed on the selected timeframe via request.security.
Clean UI: table only (top-right). No lines, no shapes, no price-scale impact.
How it works (logic)
Uses standard, transparent components:
EMA(20) / EMA(34) — directional structure and mean.
DMI/ADX(14) — trend strength and side dominance (+DI vs −DI).
Bollinger Band Width(20) — volatility compression/expansion.
ATR(14) — normalizes EMA “confluence/flatness”.
RSI(14) — “healthy pullback” bands in corrections.
Regime definitions (summary):
TREND UP/DOWN — ADX ≥ trend threshold, +DI/−DI confirm direction, EMA20/34 aligned, not in heavy squeeze.
CORRECTION UP/DOWN — price between EMA20 and EMA34 within a trend, ADX between range/trend thresholds, RSI in pullback band.
RANGE — ADX ≤ range threshold and/or EMAs “confluent” (flat) with low BB Width.
Playbook mapping for ReddingtonBotAdaptive Signal
The panel renders a line like: ST ✅ MACD ✅ BB ⚠ SC ✅ CT ❌
TREND UP / TREND DOWN
ST ✅, MACD ✅, SC ✅, BB ⚠, CT ❌
Trade with trend. For BB, prefer confirmed expansion (BB Width ↑ & ADX ↑).
CORRECTION UP / CORRECTION DOWN
ST ✅, SC ✅, MACD ⚠, BB ⚠, CT ❌
Wait for impulse resumption (ADX uptick / BBW expansion) after EMA20/VWAP retest.
RANGE
SC ✅, CT ⚠, ST ❌, MACD ❌, BB ❌/⚠
Mean-reversion/scalps inside the corridor; BB only if early expansion emerges.
✅/⚠/❌ are heuristics. Tune thresholds per asset/timeframe if needed.
Inputs (essentials)
Regime timeframe — empty = use chart TF.
ADX Trend/Range Thresholds — default 25 / 20.
EMA Fast/Slow — 20 / 34.
BB Width Length — 20.
ATR Length — 14.
EMA confluence vs ATR (×ATR) — flatness sensitivity (default 0.20).
BBW squeeze factor (vs BBW SMA) — compression sensitivity (default 0.90).
Correction RSI bands — pullback zones for up/down trends.
Show Playbook — toggle recommendations row.
How to use with ReddingtonBotAdaptive Signal
Filter first, then act: take Adaptive entries only when the Playbook shows ✅ for that strategy in the current regime.
Confirm at bar close on the regime timeframe to avoid MTF “in-bar” fluctuations.
Best practice:
Trading TF: 5–15m
Regime filter TF: 15m–1h
Raise ADX Trend to 28–30 on noisy assets; set BBW squeeze to 1.0 on volatile alts.
Notes & limitations
This is an analytical tool, not an entry/exit system.
No alerts by design (panel only). You can add alerts in your entry script.
MTF values update until the higher-TF bar closes; for strict discipline, use confirmed bars.
Disclaimer
This script is for educational purposes only and is not financial advice. Trading involves risk, including the loss of capital. Past performance does not guarantee future results. By using this script, you acknowledge that you are solely responsible for your trading decisions.
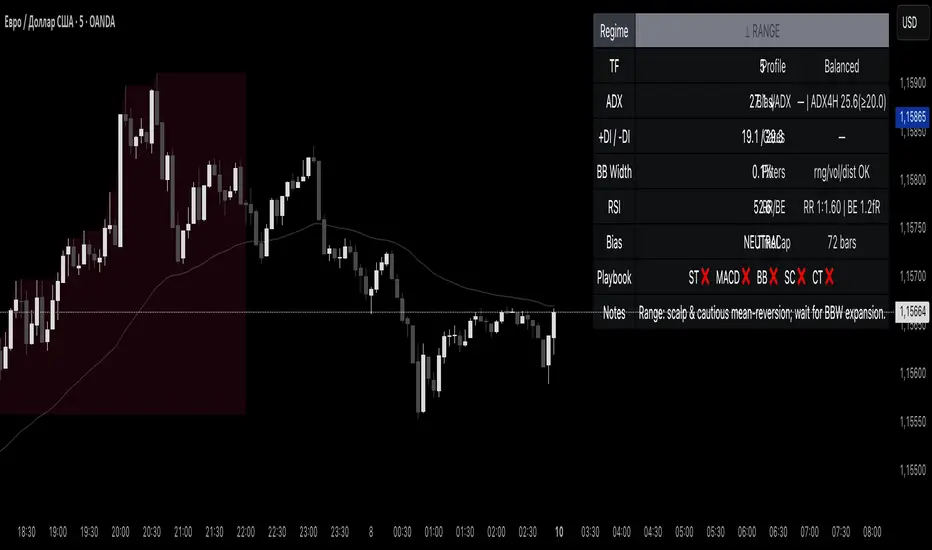
PRO Scalper(EN)
## What it is
**PRO Scalper** is an intraday price–action and liquidity map that helps you see where the market is likely to move **now**, not just where it has been.
It combines five building blocks that professional scalpers often watch together:
1. **Session Volume-Weighted Average Price (VWAP)** — the intraday “fair value” anchor.
2. **Opening Range** — the first minutes of the session that set the day’s balance.
3. **Trend filter** — higher-timeframe bias using **Exponential Moving Averages (EMA)** and optional **Average Directional Index (ADX)** strength.
4. **Two independent Supply/Demand zone engines** — zones are drawn from confirmed swing pivots, with midlines and **touch counters**.
5. **Order-flow style visuals**:
* **Delta bubbles** (green/red circles) show where buying or selling pressure was unusually strong, using a safe **delta proxy** (no external feeds).
* **Liquidity densities** (subtle rectangular bands) highlight clusters of large activity that often act as magnets or barriers and disappear when “eaten” by strong moves.
This mix gives you a **complete intraday picture**: the mean (VWAP), the day’s initial balance (Opening Range), the higher-timeframe push (trend filter), the nearby fuel or brakes (zones), and the live pressure points (bubbles and densities).
---
## Why these components
* **VWAP** tracks where the bulk of traded value sits. Price tends to rotate around it or accelerate away from it — a perfect compass for scalps.
* **Opening Range** frames the early auction. Many intraday breaks, fades and retests start at its boundaries.
* **EMA bias + ADX strength** separates trending conditions from chop, so you can keep only the zones that agree with the bigger push.
* **Pivot-based zones (two pairs at once)** are simple, objective and fast. Midlines help with confirmations; touch counters quantify how many times the zone was tested.
* **Bubbles and densities** add the “effort” layer: where the push appeared and where liquidity is concentrated. You see **where** a move is likely to continue or fail.
Together they reduce ambiguity: **context + level + effort** — all on one screen.
---
## How it works (plain language)
* **VWAP** resets each day and is calculated as the cumulative sum of typical price multiplied by volume divided by total volume.
* **Opening Range** is either automatic (a multiple of your chart timeframe) or a manual number of minutes. While it is forming, the highest high and lowest low are captured and plotted as the range.
* **Trend filter**
* **EMA Fast** and **EMA Slow** define directional bias.
* **ADX (optional)** adds “trend strength”: only when the Average Directional Index is above the chosen threshold do we treat the move as strong. You can source this from a higher timeframe.
* **Zones**
* There are **two independent pairs** of pivots at the same time (for example 10-left 10-right and 5-left 5-right).
* Each detected pivot creates a **Supply** (from a swing high) or **Demand** (from a swing low) box. Box depth = **zone depth × Average True Range** for adaptive sizing; the boxes **extend forward**.
* Midline (optional dashed line inside the box) is the “balance” of the zone.
* **“Only in trend”** mode can hide boxes that go against the higher-timeframe bias.
* The **touch counter** increases when price revisits the box. Labels show the pair name and the number of touches.
* **Bubbles**
* A safe **delta proxy** measures bar pressure (for example, range-weighted close vs open).
* A **quantile filter** shows only unusually large pressure: choose lookback and percentile, and the script draws a circle sized by intensity (green = bullish pressure, red = bearish).
* **Densities**
* The script marks heavy activity clusters as **subtle bands** around price (depth = fraction of Average True Range).
* If price **breaks** a density with volume above its moving average, the band **disappears** (“eaten”), which often precedes continuation.
---
## How to use — practical playbooks
> Recommended chart: crypto or index futures, one to five minutes. Use **one hour** or **fifteen minutes** for the higher-timeframe bias.
### 1) Trend pullback scalp (continuation)
1. Enable **Only in trend** zones.
2. In an uptrend: wait for a pullback into a **Demand** zone that overlaps with VWAP or sits just below the Opening Range midpoint.
3. Look for **green bubbles** near the zone’s bottom or a fresh **density** under price.
4. Enter on a candle closing **back above the zone midline**.
5. Stop-loss: below the bottom of the zone or a small multiple of Average True Range.
6. Targets: previous swing high, Opening Range high, fixed risk multiples, or VWAP.
Mirror the logic for downtrends using Supply zones, red bubbles and densities above price.
### 2) Reversion with liquidity sweep (fade)
1. Bias neutral or countertrend allowed.
2. Price **wicks through** a zone boundary (or an Opening Range line) and **closes back inside** the zone.
3. The bubble color often flips (absorption).
4. Enter toward the **inside** of the zone; stop beyond the sweep wick; first target = zone midline, second = opposite side of the zone or VWAP.
### 3) Opening Range break and retest
1. Wait for the Opening Range to complete.
2. A break with a large bubble suggests intent.
3. Look for a **retest** into a nearby zone aligned with VWAP.
4. Trade continuation toward the next zone or the session extremes.
### 4) Density “eaten” continuation
1. When a density band **disappears** on high volume, it often means the resting liquidity was consumed.
2. Trade in the direction of the break, toward the nearest opposing zone.
---
## Settings — quick guide
**Core**
* *ATR Length* — used for zone and density depths.
* *Show VWAP / Show Opening Range*.
* *Opening Range*: Auto (multiple of timeframe minutes) or Manual minutes.
**Trend Filter**
* *Mode*: Off, EMA only, or EMA with ADX strength.
* *Use higher timeframe* and its value.
* *EMA Fast / EMA Slow*, *ADX Length*, *ADX threshold*.
* *Plot EMA filter* to display the moving averages.
**Zones (two pairs)**
* *Pivot A Left / Right* and *Pivot B Left / Right*.
* *Zone depth × ATR*, *Extend bars*.
* *Show zone midline*, *Only in trend zones*.
* Labels automatically show the touch counters.
**Bubbles**
* *Show Bubbles*.
* *Quantile lookback* and *Quantile percent* (higher percent = stricter filter, fewer bubbles).
**Densities**
* *Metric*: absolute delta proxy or raw volume.
* *Quantile lookback / percent*.
* *Depth × ATR*, *Extend bars*, *Merge distance* (in ATR),
* *Break condition*: volume moving average length and multiplier,
* *Midline for densities* (optional dashed line).
---
## Tips and risk management
* This script **does not use external order-flow feeds**. Delta is a **proxy** suitable for TradingView; tune quantiles per symbol and timeframe.
* Do not trade every bubble. Combine **context (trend + VWAP + Opening Range)** with **level (zone)** and **effort (bubble/density)**.
* Set stop-losses beyond the zone or at a fraction of Average True Range. Predefine risk per trade.
* Backtest your rules with a strategy script before using real funds.
* Markets differ. Parameters that work on Bitcoin may not transfer to low-liquidity altcoins or stocks.
* Nothing here is financial advice. Scalping is high-risk; slippage and over-trading can quickly damage your account.
---
## What makes PRO Scalper unique
* Two **independent** zone engines run in parallel, so you can see both **larger structure** and **fine intraday levels** at the same time.
* Clean **“only in trend” rendering** — zones and midlines against the bias can be hidden, reducing clutter and hesitation.
* **Touch counters** convert “feel” into numbers.
* **Self-contained order-flow visuals** (bubbles and densities) that require no extra data sources.
* Careful defaults: subtle colors for densities, clearer zones, and responsive auto Opening Range.
---
(RU)
## Что это такое
**PRO Scalper** — это индикатор для внутридневной торговли, который показывает **контекст и ликвидность прямо сейчас**.
Он объединяет пять модулей, которыми профессиональные скальперы пользуются вместе:
1. **VWAP** — средневзвешенная по объему цена за сессию, «справедливая стоимость» дня.
2. **Opening Range** — первая часть сессии, задающая баланс дня.
3. **Фильтр тренда** — направление старшего таймфрейма по **экспоненциальным средним** и при желании по силе тренда **Average Directional Index**.
4. **Две независимые системы зон спроса/предложения** — зоны строятся от подтвержденных экстремумов (пивотов), имеют **среднюю линию** и **счетчик касаний**.
5. **Визуализация «ордер-флоу»**:
* **Пузыри дельты** (зеленые/красные круги) — места повышенного покупательного/продажного давления, рассчитанные через безопасный **прокси-дельты**.
* **Плотности ликвидности** (ненавязчивые прямоугольные ленты) — скопления объема, которые нередко притягивают цену или удерживают ее и исчезают, когда «разъедаются» сильным движением.
Итог — **полная картинка момента**: среднее (VWAP), баланс дня (Opening Range), старшая сила (фильтр тренда), ближайшие уровни топлива/тормозов (зоны), текущие точки усилия (пузыри и плотности).
---
## Почему именно эти элементы
* **VWAP** показывает, где сосредоточена стоимость; цена либо вращается вокруг него, либо быстро уходит — идеальный ориентир скальпера.
* **Opening Range** фиксирует ранний аукцион — от его границ часто начинаются пробои, возвраты и ретесты.
* **EMA + ADX** отделяют тренд от «пилы», позволяя оставлять на графике только зоны по направлению старшего таймфрейма.
* **Зоны от пивотов** просты, объективны и быстры; средняя линия помогает подтверждать разворот, счетчик касаний переводит субъективность в цифры.
* **Пузыри и плотности** добавляют слой «усилия»: где именно возник толчок и где сконцентрирована ликвидность.
Комбинация **контекста + уровня + усилия** уменьшает двусмысленность и ускоряет принятие решения.
---
## Как это работает (простыми словами)
* **VWAP** каждый день стартует заново: сумма «типичной цены × объем» делится на суммарный объем.
* **Opening Range** — автоматический (кратный минутам вашего таймфрейма) или вручную заданный период; пока он формируется, фиксируются максимум и минимум.
* **Фильтр тренда**
* Две экспоненциальные средние задают направление.
* **ADX** (по желанию) добавляет «силу». Источник можно взять со старшего таймфрейма.
* **Зоны**
* Одновременно работает **две пары** пивотов (например 10-лево 10-право и 5-лево 5-право).
* От пивота строится зона **предложения** (от максимума) или **спроса** (от минимума). Глубина зоны = **коэффициент × Average True Range**; зона тянется вперед.
* Внутри рисуется **средняя линия** (по желанию).
* Режим **«только по тренду»** скрывает зоны против старшего направления.
* **Счетчик касаний** увеличивается, когда цена снова входит в зону; подпись показывает пару и количество касаний.
* **Пузыри**
* Используется безопасный **прокси-дельты** — измерение «напряжения» внутри свечи.
* Через **квантильный фильтр** выводятся только необычно сильные места: настраиваются окно и процент квантиля; размер кружка — сила, цвет: зеленый покупатели, красный продавцы.
* **Плотности**
* Крупные активности отмечаются **ненавязчивыми прямоугольниками** (глубина — доля Average True Range).
* Если плотность **пробивается** объемом выше среднего, она **исчезает** — часто это предвещает продолжение.
---
## Как пользоваться — практические схемы
> Рекомендация: крипто или фьючерсы, таймфрейм 1–5 минут. Для старшего фильтра удобно взять **1 час** или **15 минут**.
### 1) Скальп на откат по тренду
1. Включите **«только по тренду»**.
2. В восходящем тренде дождитесь отката в **зону спроса**, желательно рядом с **VWAP** или серединой **Opening Range**.
3. Подтверждение — **зеленые пузыри** у нижней границы зоны или свежая **плотность** под ценой.
4. Вход после закрытия свечи **выше средней линии** зоны.
5. Стоп-лосс: за нижнюю границу зоны или небольшой множитель Average True Range.
6. Цели: предыдущий максимум, верх Opening Range, фиксированные R-множители, либо VWAP.
Для нисходящего тренда зеркально: зоны предложения, красные пузыри и плотности над ценой.
### 2) Контрдвижение с «выбиванием ликвидности»
1. Нейтральный или контртрендовый режим.
2. Цена **выносит хвостом** границу зоны (или линию Opening Range) и **закрывается обратно внутри**.
3. Цвет пузыря часто меняется (поглощение).
4. Вход внутрь зоны; стоп — за хвост выбивания; цели: средняя линия, противоположная граница зоны или VWAP.
### 3) Пробой Opening Range + ретест
1. Дождитесь завершения диапазона.
2. Сильный пробой с крупным пузырем — признак намерения.
3. Ищите **ретест** в зоне по тренду рядом с линией диапазона и VWAP.
4. Торгуйте продолжение к следующей зоне.
### 4) Продолжение после «съеденной» плотности
1. Когда прямоугольник плотности **исчезает** на повышенном объеме, это значит, что ликвидность поглощена.
2. Торгуйте в сторону пробоя к ближайшей противоположной зоне.
---
## Настройки — краткая шпаргалка
**Core**
— Длина Average True Range (для размеров зон и плотностей).
— Включение VWAP и Opening Range.
— Длина Opening Range: автоматическая (кратная минутам ТФ) или ручная.
**Trend Filter**
— Режим: выкл., только средние, либо средние + ADX.
— Источник со старшего таймфрейма и его значение.
— Длины средних, длина ADX и порог силы.
— Показать/скрыть линий средних.
**Zones (две пары одновременно)**
— Пара A: лев/прав; Пара B: лев/прав.
— Глубина зоны × Average True Range, продление по барам.
— Средняя линия, режим **«только по тренду»**.
— Подписи со счетчиком касаний.
**Bubbles**
— Вкл./выкл., окно поиска и процент квантиля (чем выше процент — тем реже пузыри).
**Densities**
— Метрика: абсолютная прокси-дельты или чистый объем.
— Окно/квантиль, глубина × Average True Range, продление,
— Порог объединения (в Average True Range),
— Условие «разъедания» по объему,
— Средняя линия плотности (по желанию).
---
## Советы и риски
* Индикатор **не использует внешние потоки ордер-флоу**. Дельта — **прокси**, подходящая для TradingView; подбирайте квантили под инструмент и таймфрейм.
* Не торгуйте каждый пузырь. Склейте **контекст (тренд + VWAP + Opening Range)** с **уровнем (зона)** и **усилием (пузырь/плотность)**.
* Стоп-лосс — за границей зоны или по Average True Range. Риск на сделку задавайте заранее.
* Перед реальными деньгами протестируйте правила в стратегии.
* Разные рынки ведут себя по-разному; настройки из Биткоина могут не подойти малоликвидным альткоинам или акциям.
* Это не инвестиционная рекомендация. Скальпинг — высокий риск; проскальзывание и переизбыток сделок быстро наносят ущерб капиталу.
---
## Чем уникален PRO Scalper
* Две **одновременные** системы зон показывают и **крупную структуру**, и **точные локальные уровни**.
* Режим **«только по тренду»** чистит экран от лишних уровней и ускоряет решение.
* **Счетчики касаний** дают количественную опору.
* **Самодостаточные визуализации усилия** (пузыри и плотности) — без сторонних источников данных.
* Аккуратная цветовая схема: плотности — мягко, зоны — ясно; Opening Range — адаптивный.
Пусть он станет вашей «картой местности» для быстрых и дисциплинированных решений внутри дня.
