RePaNoCHa [Backtest]This is a very long script and adjusting the settings can be a bit slow so I share some settings. (these may be even better)
It has no security() and no Heikin Ashi so no repaint and Backtest is real.
It's important to adjust correctly the tics/pips correction.
All timeframes but good results at 2H
Default settings for ETHUSD (BITMEX) 2H
Alerts version coming soon...
Enjoy!!!
"Este script es la repanocha"
XBTUSD (BITMEX)
Timeframe = 2H
Position Side = BOTH
Source = hlc3
T3 == true
T3 Length = 8
T3 Volume Factor = 0.9
Range Filter+ADX == true
Sampling Period = 16
Range Multiplier = 1.3
Flat Market Trades == true
ADX lenght = 10
ADX Threshold = 20
Parabolic SAR == true
SAR start = 0.03
SAR inc = 0.02
SAR max = 0.3
Pyramiding = 15
Trailing Stop Activation % = 0.5
Trailing Stop Offset % (when profit=0.5 %) = 0.2
Trailing Stop Offset % (when profit=10 %) = 1.2
Stop Loss = 3.2
Tics/Pips Correction = 10
Initial Capital = 1000
Quantity = 100 %
Commission value = 0.075 %
ETHUSD (BITMEX)
Timeframe = 2H
Position Side = BOTH
Source = hlc3
T3 == true
T3 Length = 6
T3 Volume Factor = 0.7
Range Filter+ADX == true
Sampling Period = 10
Range Multiplier = 0.9
Flat Market Trades == true
ADX lenght = 11
ADX Threshold = 19
Parabolic SAR == true
SAR start = 0.06
SAR inc = 0.07
SAR max = 0.15
Pyramiding = 15
Trailing Stop Activation % = 0.5
Trailing Stop Offset % (when profit=0.5 %) = 0.25
Trailing Stop Offset % (when profit=10 %) = 1.5
Stop Loss = 3.2
Tics/Pips Correction = 100
Initial Capital = 1000
Quantity = 100 %
Commission value = 0.075 %
BNBUSDT (BINANCE)
Timeframe = 2H
Position Side = LONG
Source = hlc3
T3 == true
T3 Length = 6
T3 Volume Factor = 0.7
Range Filter+ADX == true
Sampling Period = 17
Range Multiplier = 1.3
Flat Market Trades == true
ADX lenght = 5
ADX Threshold = 18
Parabolic SAR == true
SAR start = 0.04
SAR inc = 0.03
SAR max = 0.25
Pyramiding = 15
Trailing Stop Activation % = 0.5
Trailing Stop Offset % (when profit=0.5 %) = 0.25
Trailing Stop Offset % (when profit=10 %) = 1.5
Stop Loss == false
Tics/Pips Correction = 10000
Initial Capital = 1000
Quantity = 100 %
Commission value = 0.075 %
LTCUSDT (BINANCE)
Timeframe = 2H
Position Side = LONG
Source = hlc3
T3 == true
T3 Length = 3
T3 Volume Factor = 1
Range Filter+ADX == true
Sampling Period = 11
Range Multiplier = 1.1
Flat Market Trades == true
ADX lenght = 6
ADX Threshold = 22
Parabolic SAR == true
SAR start = 0.07
SAR inc = 0.04
SAR max = 0.15
Pyramiding = 15
Trailing Stop Activation % = 0.5
Trailing Stop Offset % (when profit=0.5 %) = 0.25
Trailing Stop Offset % (when profit=10 %) = 1.5
Stop Loss == false
Tics/Pips Correction = 100
Initial Capital = 1000
Quantity = 100 %
Commission value = 0.075 %
TRXUSDT (BINANCE)
Timeframe = 2H
Position Side = LONG
Source = hlc3
T3 == true
T3 Length = 7
T3 Volume Factor = 1
Range Filter+ADX == true
Sampling Period = 8
Range Multiplier = 1.1
Flat Market Trades == true
ADX lenght = 4
ADX Threshold = 22
Parabolic SAR == true
SAR start = 0.07
SAR inc = 0.04
SAR max = 0.15
Pyramiding = 15
Trailing Stop Activation % = 0.5
Trailing Stop Offset % (when profit=0.5 %) = 0.25
Trailing Stop Offset % (when profit=10 %) = 1.5
Stop Loss == false
Tics/Pips Correction = 100000
Initial Capital = 1000
Quantity = 100 %
Commission value = 0.075 %
NAS100 (OANDA)
Timeframe = 2H
Position Side = BOTH
Source = hlc3
T3 == true
T3 Length = 3
T3 Volume Factor = 1
Range Filter+ADX == true
Sampling Period = 12
Range Multiplier = 1.3
Flat Market Trades == true
ADX lenght = 18
ADX Threshold = 21
Parabolic SAR == true
SAR start = 0.08
SAR inc = 0.06
SAR max = 0.25
Pyramiding = 15
Trailing Stop Activation % = 0.2
Trailing Stop Offset % (when profit=0.5 %) = 0.15
Trailing Stop Offset % (when profit=10 %) = 1
Stop Loss == false
Tics/Pips Correction = 10
Initial Capital = 1000
Quantity = 3 contracts
Commission value = 0.2 USD per contract
NATGAS(OANDA)
Timeframe = 2H
Position Side = BOTH
Source = hlc3
T3 == true
T3 Length = 3
T3 Volume Factor = 1
Range Filter+ADX == true
Sampling Period = 15
Range Multiplier = 1.3
Flat Market Trades == true
ADX lenght = 12
ADX Threshold = 21
Parabolic SAR == true
SAR start = 0.08
SAR inc = 0.06
SAR max = 0.4
Pyramiding = 15
Trailing Stop Activation % = 0.2
Trailing Stop Offset % (when profit=0.5 %) = 0.15
Trailing Stop Offset % (when profit=10 %) = 1
Stop Loss == false
Tics/Pips Correction = 1000
Initial Capital = 1000
Quantity = 4500 contracts
Commission value = 0.002 USD per contract
SPX500 (OANDA)
Timeframe = 2H
Position Side = BOTH
Source = hlc3
T3 == true
T3 Length = 4
T3 Volume Factor = 0.8
Range Filter+ADX == true
Sampling Period = 14
Range Multiplier = 1.3
Flat Market Trades == true
ADX lenght = 12
ADX Threshold = 17
Parabolic SAR == true
SAR start = 0.09
SAR inc = 0.04
SAR max = 0.2
Pyramiding = 15
Trailing Stop Activation % = 0.15
Trailing Stop Offset % (when profit=0.5 %) = 0.1
Trailing Stop Offset % (when profit=10 %) = 0.5
Stop Loss = 1.5
Tics/Pips Correction = 10
Initial Capital = 1000
Quantity = 8 contracts
Commission value = 0.2 USD per contract
US30 (OANDA)
Timeframe = 2H
Position Side = BOTH
Source = hlc3
T3 == true
T3 Length = 4
T3 Volume Factor = 0.9
Range Filter+ADX == true
Sampling Period = 11
Range Multiplier = 1.1
Flat Market Trades == true
ADX lenght = 16
ADX Threshold = 24
Parabolic SAR == true
SAR start = 0.08
SAR inc = 0.03
SAR max = 0.05
Pyramiding = 15
Trailing Stop Activation % = 0.15
Trailing Stop Offset % (when profit=0.5 %) = 0.075
Trailing Stop Offset % (when profit=10 %) = 0.5
Stop Loss = 1.5
Tics/Pips Correction = 10
Initial Capital = 1000
Quantity = 1 contracts
Commission value = 1.5 USD per contract
WHEAT (OANDA)
Timeframe = 2H
Position Side = BOTH
Source = hlc3
T3 == true
T3 Length = 3
T3 Volume Factor = 1.1
Range Filter+ADX == true
Sampling Period = 12
Range Multiplier = 0.9
Flat Market Trades == true
ADX lenght = 13
ADX Threshold = 21
Parabolic SAR == true
SAR start = 0.1
SAR inc = 0.05
SAR max = 0.15
Pyramiding = 15
Trailing Stop Activation % = 0.2
Trailing Stop Offset % (when profit=0.5 %) = 0.1
Trailing Stop Offset % (when profit=10 %) = 1
Stop Loss = 2.5
Tics/Pips Correction = 1000
Initial Capital = 1000
Quantity = 2500 contracts
Commission value = 0.003 USD per contract
ค้นหาในสคริปต์สำหรับ "adx"

Donchian ForecastDonchian Forecast – multi-timeframe Donchian/ATR bias with ADX regime blending
Donchian Forecast is a multi-timeframe bias tool that turns classic Donchian channels into a normalized trend/mean-reversion “forecast” and a single bias value in .
It projects a short polyline path from the current price and shows how that path adapts when the market shifts from ranging to trending (via ADX).
---
Concept
1. Donchian position → direction
For each timeframe, the script measures where price sits inside its Donchian channel:
-1 = near channel low
0 = middle
+1 = near channel high
This Donchian position is multiplied by ATR to create a **price delta** (how far the forecast moves from current price).
2. Local behavior: trend vs mean-reversion around Donchian
The indicator treats the edges vs middle of the Donchian channel differently:
* By default, edges behave more “trend-like”, middle more “mean-reverting”.
* If you enable the reversed option, this logic flips (edges = mean-reverting, middle = trend-
like).
* This “local” behavior is controlled smoothly by the absolute Donchian position |pos| (not by hard zone switches).
3. Global ADX modulation (regime aware)
ADX is mapped from your chosen low → high thresholds into a signed factor in :
* ADX ≤ low → -1 (fully reversed behavior, more range/mean-reversion oriented)
* ADX ≥ high → +1 (fully normal behavior, more trend oriented)
* Values in between create a **smooth transition**.
* This global factor can:
* Keep the local behavior as is (trending regime),
* Flip it (range regime), or
* Neutralize it (indecisive regime).
4. Multi-timeframe aggregation (1x–12x chart timeframe)
* The script repeats the same logic across 12 horizons:
* 1x = chart timeframe
* 2x..12x = multiples of the chart timeframe (e.g., 5m → 10m, 15m, …; 1h → 2h, 3h, …).
* For each horizon it builds:
* Donchian position
* ATR-scaled delta (in price units)
* Locally + globally blended delta (after Donchian + ADX logic).
* These blended deltas are ATR-weighted and summed into a single bias in , which is then shown as Bias % in the on-chart table.
---
### What you see on the chart
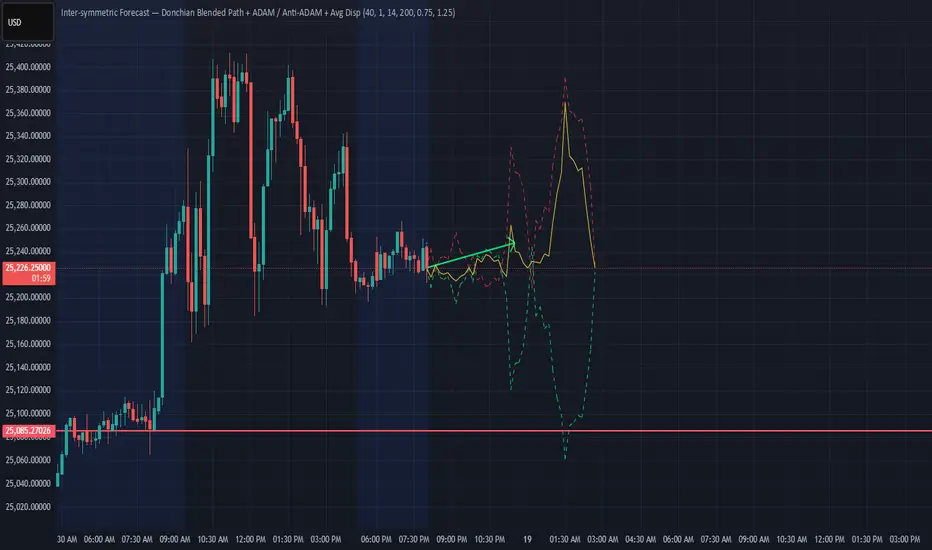
* Forecast polyline
* Starting at the current close, the indicator draws a short chain of **up to 12 segments**:
* Segment 1: from current price → 1x projection
* Segment 2: 1x → 2x projection
* … up to 12x.
* Each segment is:
* Green when its blended delta is ≥ 0 (upward bias)
* Red when its blended delta is < 0 (downward bias)
* This is not future price, but a synthetic path showing how the Donchian/ATR/ADX model “expects” price to drift across multiple horizons.
* Bias table (top-center)
* `Bias: X.Y%`
* > 0% (green) → net upward bias across horizons
* < 0% (red) → net downward bias
* Magnitude (e.g., ±70–100%) ≈ strength of the directional skew.
* `ADX:` current ADX value (from your DMI settings).
* `ADXBlend:` the signed ADX factor in :
* +1 ≈ fully “trend-interpretation” of Donchian behavior
* 0 ≈ neutral / mixed regime
* -1 ≈ fully “reversed/mean-reversion interpretation”
---
Inputs & settings
Core Donchian / ATR
* Donchian Length – lookback for Donchian high/low on each horizon.
* Price Source – input series used for position inside the Donchian channel (default: close).
* ATR Length – ATR lookback for all horizons.
* ATR Multiplier – scales the size of each forecast step in price units (higher = longer segments / more aggressive forecast).
*Local behavior at high ADX
* Reversed local blend at high ADX?
* Off (default) – edges behave more trend-like, middle more mean-reverting.
* On – flips that logic (edges more mean-reverting, middle more trend-like).
* The actual effect is always modulated by the global ADX factor, so you can experiment with how the regime logic feels in different markets.
Global ADX blending
* DMI DI Length – period for the DI+ and DI- components.
* ADX Smoothing – smoothing length for ADX.
* ADX low (mean-rev zone) – below this level, the global factor pushes behavior toward reversal/range logic .
* ADX high (trend zone) – above this level, the global factor pushes behavior toward **trend logic**.
* Values between low and high create a smooth blend rather than a hard on/off switch.
---
How to use it (examples)
* Directional bias dashboard
* Use the Bias % as a compact summary of multi-horizon Donchian/ATR/ADX conditions:
* Consider only trades aligned with the sign of Bias (e.g., longs only when Bias > 0).
* Use the magnitude to filter for **strong vs weak** directional contexts.
* Regime-aware context
* Watch ADX and ADXBlend:
* High ADX & ADXBlend ≈ +1 → favor trend-continuation ideas.
* Low ADX & ADXBlend ≈ -1 → favor range/mean-reversion ideas.
* Around 0 → mixed/transition regimes; forecasts will be more muted.
* Visual sanity check for systems
* Overlay Donchian Forecast on your usual entries/exits to see:
* When your system trades **with** the multi-TF Donchian bias.
* When it trades **against** it (possible fade setups or no-trade zones).
This script does not generate entry or exit signals by itself. It is a contextual/forecast tool meant to sit on top of your own trading logic.
---
Notes
* Works on most symbols and timeframes; higher-timeframe multiples are built from the chart timeframe.
* The forecast line is a model-based projection, not a prediction or guarantee of future price.
* Always combine this with your own risk management, testing, and judgement. This is for educational and analytical purposes only and is not financial advice.
Trend Gauge [BullByte]Trend Gauge
Summary
A multi-factor trend detection indicator that aggregates EMA alignment, VWMA momentum scaling, volume spikes, ATR breakout strength, higher-timeframe confirmation, ADX-based regime filtering, and RSI pivot-divergence penalty into one normalized trend score. It also provides a confidence meter, a Δ Score momentum histogram, divergence highlights, and a compact, scalable dashboard for at-a-glance status.
________________________________________
## 1. Purpose of the Indicator
Why this was built
Traders often monitor several indicators in parallel - EMAs, volume signals, volatility breakouts, higher-timeframe trends, ADX readings, divergence alerts, etc., which can be cumbersome and sometimes contradictory. The “Trend Gauge” indicator was created to consolidate these complementary checks into a single, normalized score that reflects the prevailing market bias (bullish, bearish, or neutral) and its strength. By combining multiple inputs with an adaptive regime filter, scaling contributions by magnitude, and penalizing weakening signals (divergence), this tool aims to reduce noise, highlight genuine trend opportunities, and warn when momentum fades.
Key Design Goals
Signal Aggregation
Merged trend-following signals (EMA crossover, ATR breakout, higher-timeframe confirmation) and momentum signals (VWMA thrust, volume spikes) into a unified score that reflects directional bias more holistically.
Market Regime Awareness
Implemented an ADX-style filter to distinguish between trending and ranging markets, reducing the influence of trend signals during sideways phases to avoid false breakouts.
Magnitude-Based Scaling
Replaced binary contributions with scaled inputs: VWMA thrust and ATR breakout are weighted relative to recent averages, allowing for more nuanced score adjustments based on signal strength.
Momentum Divergence Penalty
Integrated pivot-based RSI divergence detection to slightly reduce the overall score when early signs of momentum weakening are detected, improving risk-awareness in entries.
Confidence Transparency
Added a live confidence metric that shows what percentage of enabled sub-indicators currently agree with the overall bias, making the scoring system more interpretable.
Momentum Acceleration Visualization
Plotted the change in score (Δ Score) as a histogram bar-to-bar, highlighting whether momentum is increasing, flattening, or reversing, aiding in more timely decision-making.
Compact Informational Dashboard
Presented a clean, scalable dashboard that displays each component’s status, the final score, confidence %, detected regime (Trending/Ranging), and a labeled strength gauge for quick visual assessment.
________________________________________
## 2. Why a Trader Should Use It
Main benefits and use cases
1. Unified View: Rather than juggling multiple windows or panels, this indicator delivers a single score synthesizing diverse signals.
2. Regime Filtering: In ranging markets, trend signals often generate false entries. The ADX-based regime filter automatically down-weights trend-following components, helping you avoid chasing false breakouts.
3. Nuanced Momentum & Volatility: VWMA and ATR breakout contributions are normalized by recent averages, so strong moves register strongly while smaller fluctuations are de-emphasized.
4. Early Warning of Weakening: Pivot-based RSI divergence is detected and used to slightly reduce the score when price/momentum diverges, giving a cautionary signal before a full reversal.
5. Confidence Meter: See at a glance how many sub-indicators align with the aggregated bias (e.g., “80% confidence” means 4 out of 5 components agree ). This transparency avoids black-box decisions.
6. Trend Acceleration/Deceleration View: The Δ Score histogram visualizes whether the aggregated score is rising (accelerating trend) or falling (momentum fading), supplementing the main oscillator.
7. Compact Dashboard: A corner table lists each check’s status (“Bull”, “Bear”, “Flat” or “Disabled”), plus overall Score, Confidence %, Regime, Trend Strength label, and a gauge bar. Users can scale text size (Normal, Small, Tiny) without removing elements, so the full picture remains visible even in compact layouts.
8. Customizable & Transparent: All components can be enabled/disabled and parameterized (lengths, thresholds, weights). The full Pine code is open and well-commented, letting users inspect or adapt the logic.
9. Alert-ready: Built-in alert conditions fire when the score crosses weak thresholds to bullish/bearish or returns to neutral, enabling timely notifications.
________________________________________
## 3. Component Rationale (“Why These Specific Indicators?”)
Each sub-component was chosen because it adds complementary information about trend or momentum:
1. EMA Cross
o Basic trend measure: compares a faster EMA vs. a slower EMA. Quickly reflects trend shifts but by itself can whipsaw in sideways markets.
2. VWMA Momentum
o Volume-weighted moving average change indicates momentum with volume context. By normalizing (dividing by a recent average absolute change), we capture the strength of momentum relative to recent history. This scaling prevents tiny moves from dominating and highlights genuinely strong momentum.
3. Volume Spikes
o Sudden jumps in volume combined with price movement often accompany stronger moves or reversals. A binary detection (+1 for bullish spike, -1 for bearish spike) flags high-conviction bars.
4. ATR Breakout
o Detects price breaking beyond recent highs/lows by a multiple of ATR. Measures breakout strength by how far beyond the threshold price moves relative to ATR, capped to avoid extreme outliers. This gives a volatility-contextual trend signal.
5. Higher-Timeframe EMA Alignment
o Confirms whether the shorter-term trend aligns with a higher timeframe trend. Uses request.security with lookahead_off to avoid future data. When multiple timeframes agree, confidence in direction increases.
6. ADX Regime Filter (Manual Calculation)
o Computes directional movement (+DM/–DM), smoothes via RMA, computes DI+ and DI–, then a DX and ADX-like value. If ADX ≥ threshold, market is “Trending” and trend components carry full weight; if ADX < threshold, “Ranging” mode applies a configurable weight multiplier (e.g., 0.5) to trend-based contributions, reducing false signals in sideways conditions. Volume spikes remain binary (optional behavior; can be adjusted if desired).
7. RSI Pivot-Divergence Penalty
o Uses ta.pivothigh / ta.pivotlow with a lookback to detect pivot highs/lows on price and corresponding RSI values. When price makes a higher high but RSI makes a lower high (bearish divergence), or price makes a lower low but RSI makes a higher low (bullish divergence), a divergence signal is set. Rather than flipping the trend outright, the indicator subtracts (or adds) a small penalty (configurable) from the aggregated score if it would weaken the current bias. This subtle adjustment warns of weakening momentum without overreacting to noise.
8. Confidence Meter
o Counts how many enabled components currently agree in direction with the aggregated score (i.e., component sign × score sign > 0). Displays this as a percentage. A high percentage indicates strong corroboration; a low percentage warns of mixed signals.
9. Δ Score Momentum View
o Plots the bar-to-bar change in the aggregated score (delta_score = score - score ) as a histogram. When positive, bars are drawn in green above zero; when negative, bars are drawn in red below zero. This reveals acceleration (rising Δ) or deceleration (falling Δ), supplementing the main oscillator.
10. Dashboard
• A table in the indicator pane’s top-right with 11 rows:
1. EMA Cross status
2. VWMA Momentum status
3. Volume Spike status
4. ATR Breakout status
5. Higher-Timeframe Trend status
6. Score (numeric)
7. Confidence %
8. Regime (“Trending” or “Ranging”)
9. Trend Strength label (e.g., “Weak Bullish Trend”, “Strong Bearish Trend”)
10. Gauge bar visually representing score magnitude
• All rows always present; size_opt (Normal, Small, Tiny) only changes text size via text_size, not which elements appear. This ensures full transparency.
________________________________________
## 4. What Makes This Indicator Stand Out
• Regime-Weighted Multi-Factor Score: Trend and momentum signals are adaptively weighted by market regime (trending vs. ranging) , reducing false signals.
• Magnitude Scaling: VWMA and ATR breakout contributions are normalized by recent average momentum or ATR, giving finer gradation compared to simple ±1.
• Integrated Divergence Penalty: Divergence directly adjusts the aggregated score rather than appearing as a separate subplot; this influences alerts and trend labeling in real time.
• Confidence Meter: Shows the percentage of sub-signals in agreement, providing transparency and preventing blind trust in a single metric.
• Δ Score Histogram Momentum View: A histogram highlights acceleration or deceleration of the aggregated trend score, helping detect shifts early.
• Flexible Dashboard: Always-visible component statuses and summary metrics in one place; text size scaling keeps the full picture available in cramped layouts.
• Lookahead-Safe HTF Confirmation: Uses lookahead_off so no future data is accessed from higher timeframes, avoiding repaint bias.
• Repaint Transparency: Divergence detection uses pivot functions that inherently confirm only after lookback bars; description documents this lag so users understand how and when divergence labels appear.
• Open-Source & Educational: Full, well-commented Pine v6 code is provided; users can learn from its structure: manual ADX computation, conditional plotting with series = show ? value : na, efficient use of table.new in barstate.islast, and grouped inputs with tooltips.
• Compliance-Conscious: All plots have descriptive titles; inputs use clear names; no unnamed generic “Plot” entries; manual ADX uses RMA; all request.security calls use lookahead_off. Code comments mention repaint behavior and limitations.
________________________________________
## 5. Recommended Timeframes & Tuning
• Any Timeframe: The indicator works on small (e.g., 1m) to large (daily, weekly) timeframes. However:
o On very low timeframes (<1m or tick charts), noise may produce frequent whipsaws. Consider increasing smoothing lengths, disabling certain components (e.g., volume spike if volume data noisy), or using a larger pivot lookback for divergence.
o On higher timeframes (daily, weekly), consider longer lookbacks for ATR breakout or divergence, and set Higher-Timeframe trend appropriately (e.g., 4H HTF when on 5 Min chart).
• Defaults & Experimentation: Default input values are chosen to be balanced for many liquid markets. Users should test with replay or historical analysis on their symbol/timeframe and adjust:
o ADX threshold (e.g., 20–30) based on instrument volatility.
o VWMA and ATR scaling lengths to match average volatility cycles.
o Pivot lookback for divergence: shorter for faster markets, longer for slower ones.
• Combining with Other Analysis: Use in conjunction with price action, support/resistance, candlestick patterns, order flow, or other tools as desired. The aggregated score and alerts can guide attention but should not be the sole decision-factor.
________________________________________
## 6. How Scoring and Logic Works (Step-by-Step)
1. Compute Sub-Scores
o EMA Cross: Evaluate fast EMA > slow EMA ? +1 : fast EMA < slow EMA ? -1 : 0.
o VWMA Momentum: Calculate vwma = ta.vwma(close, length), then vwma_mom = vwma - vwma . Normalize: divide by recent average absolute momentum (e.g., ta.sma(abs(vwma_mom), lookback)), clip to .
o Volume Spike: Compute vol_SMA = ta.sma(volume, len). If volume > vol_SMA * multiplier AND price moved up ≥ threshold%, assign +1; if moved down ≥ threshold%, assign -1; else 0.
o ATR Breakout: Determine recent high/low over lookback. If close > high + ATR*mult, compute distance = close - (high + ATR*mult), normalize by ATR, cap at a configured maximum. Assign positive contribution. Similarly for bearish breakout below low.
o Higher-Timeframe Trend: Use request.security(..., lookahead=barmerge.lookahead_off) to fetch HTF EMAs; assign +1 or -1 based on alignment.
2. ADX Regime Weighting
o Compute manual ADX: directional movements (+DM, –DM), smoothed via RMA, DI+ and DI–, then DX and ADX via RMA. If ADX ≥ threshold, market is considered “Trending”; otherwise “Ranging.”
o If trending, trend-based contributions (EMA, VWMA, ATR, HTF) use full weight = 1.0. If ranging, use weight = ranging_weight (e.g., 0.5) to down-weight them. Volume spike stays binary ±1 (optional to change if desired).
3. Aggregate Raw Score
o Sum weighted contributions of all enabled components. Count the number of enabled components; if zero, default count = 1 to avoid division by zero.
4. Divergence Penalty
o Detect pivot highs/lows on price and corresponding RSI values, using a lookback. When price and RSI diverge (bearish or bullish divergence), check if current raw score is in the opposing direction:
If bearish divergence (price higher high, RSI lower high) and raw score currently positive, subtract a penalty (e.g., 0.5).
If bullish divergence (price lower low, RSI higher low) and raw score currently negative, add a penalty.
o This reduces score magnitude to reflect weakening momentum, without flipping the trend outright.
5. Normalize and Smooth
o Normalized score = (raw_score / number_of_enabled_components) * 100. This yields a roughly range.
o Optional EMA smoothing of this normalized score to reduce noise.
6. Interpretation
o Sign: >0 = net bullish bias; <0 = net bearish bias; near zero = neutral.
o Magnitude Zones: Compare |score| to thresholds (Weak, Medium, Strong) to label trend strength (e.g., “Weak Bullish Trend”, “Medium Bearish Trend”, “Strong Bullish Trend”).
o Δ Score Histogram: The histogram bars from zero show change from previous bar’s score; positive bars indicate acceleration, negative bars indicate deceleration.
o Confidence: Percentage of sub-indicators aligned with the score’s sign.
o Regime: Indicates whether trend-based signals are fully weighted or down-weighted.
________________________________________
## 7. Oscillator Plot & Visualization: How to Read It
Main Score Line & Area
The oscillator plots the aggregated score as a line, with colored fill: green above zero for bullish area, red below zero for bearish area. Horizontal reference lines at ±Weak, ±Medium, and ±Strong thresholds mark zones: crossing above +Weak suggests beginning of bullish bias, above +Medium for moderate strength, above +Strong for strong trend; similarly for bearish below negative thresholds.
Δ Score Histogram
If enabled, a histogram shows score - score . When positive, bars appear in green above zero, indicating accelerating bullish momentum; when negative, bars appear in red below zero, indicating decelerating or reversing momentum. The height of each bar reflects the magnitude of change in the aggregated score from the prior bar.
Divergence Highlight Fill
If enabled, when a pivot-based divergence is confirmed:
• Bullish Divergence : fill the area below zero down to –Weak threshold in green, signaling potential reversal from bearish to bullish.
• Bearish Divergence : fill the area above zero up to +Weak threshold in red, signaling potential reversal from bullish to bearish.
These fills appear with a lag equal to pivot lookback (the number of bars needed to confirm the pivot). They do not repaint after confirmation, but users must understand this lag.
Trend Direction Label
When score crosses above or below the Weak threshold, a small label appears near the score line reading “Bullish” or “Bearish.” If the score returns within ±Weak, the label “Neutral” appears. This helps quickly identify shifts at the moment they occur.
Dashboard Panel
In the indicator pane’s top-right, a table shows:
1. EMA Cross status: “Bull”, “Bear”, “Flat”, or “Disabled”
2. VWMA Momentum status: similarly
3. Volume Spike status: “Bull”, “Bear”, “No”, or “Disabled”
4. ATR Breakout status: “Bull”, “Bear”, “No”, or “Disabled”
5. Higher-Timeframe Trend status: “Bull”, “Bear”, “Flat”, or “Disabled”
6. Score: numeric value (rounded)
7. Confidence: e.g., “80%” (colored: green for high, amber for medium, red for low)
8. Regime: “Trending” or “Ranging” (colored accordingly)
9. Trend Strength: textual label based on magnitude (e.g., “Medium Bullish Trend”)
10. Gauge: a bar of blocks representing |score|/100
All rows remain visible at all times; changing Dashboard Size only scales text size (Normal, Small, Tiny).
________________________________________
## 8. Example Usage (Illustrative Scenario)
Example: BTCUSD 5 Min
1. Setup: Add “Trend Gauge ” to your BTCUSD 5 Min chart. Defaults: EMAs (8/21), VWMA 14 with lookback 3, volume spike settings, ATR breakout 14/5, HTF = 5m (or adjust to 4H if preferred), ADX threshold 25, ranging weight 0.5, divergence RSI length 14 pivot lookback 5, penalty 0.5, smoothing length 3, thresholds Weak=20, Medium=50, Strong=80. Dashboard Size = Small.
2. Trend Onset: At some point, price breaks above recent high by ATR multiple, volume spikes upward, faster EMA crosses above slower EMA, HTF EMA also bullish, and ADX (manual) ≥ threshold → aggregated score rises above +20 (Weak threshold) into +Medium zone. Dashboard shows “Bull” for EMA, VWMA, Vol Spike, ATR, HTF; Score ~+60–+70; Confidence ~100%; Regime “Trending”; Trend Strength “Medium Bullish Trend”; Gauge ~6–7 blocks. Δ Score histogram bars are green and rising, indicating accelerating bullish momentum. Trader notes the alignment.
3. Divergence Warning: Later, price makes a slightly higher high but RSI fails to confirm (lower RSI high). Pivot lookback completes; the indicator highlights a bearish divergence fill above zero and subtracts a small penalty from the score, causing score to stall or retrace slightly. Dashboard still bullish but score dips toward +Weak. This warns the trader to tighten stops or take partial profits.
4. Trend Weakens: Score eventually crosses below +Weak back into neutral; a “Neutral” label appears, and a “Neutral Trend” alert fires if enabled. Trader exits or avoids new long entries. If score subsequently crosses below –Weak, a “Bearish” label and alert occur.
5. Customization: If the trader finds VWMA noise too frequent on this instrument, they may disable VWMA or increase lookback. If ATR breakouts are too rare, adjust ATR length or multiplier. If ADX threshold seems off, tune threshold. All these adjustments are explained in Inputs section.
6. Visualization: The screenshot shows the main score oscillator with colored areas, reference lines at ±20/50/80, Δ Score histogram bars below/above zero, divergence fill highlighting potential reversal, and the dashboard table in the top-right.
________________________________________
## 9. Inputs Explanation
A concise yet clear summary of inputs helps users understand and adjust:
1. General Settings
• Theme (Dark/Light): Choose background-appropriate colors for the indicator pane.
• Dashboard Size (Normal/Small/Tiny): Scales text size only; all dashboard elements remain visible.
2. Indicator Settings
• Enable EMA Cross: Toggle on/off basic EMA alignment check.
o Fast EMA Length and Slow EMA Length: Periods for EMAs.
• Enable VWMA Momentum: Toggle VWMA momentum check.
o VWMA Length: Period for VWMA.
o VWMA Momentum Lookback: Bars to compare VWMA to measure momentum.
• Enable Volume Spike: Toggle volume spike detection.
o Volume SMA Length: Period to compute average volume.
o Volume Spike Multiplier: How many times above average volume qualifies as spike.
o Min Price Move (%): Minimum percent change in price during spike to qualify as bullish or bearish.
• Enable ATR Breakout: Toggle ATR breakout detection.
o ATR Length: Period for ATR.
o Breakout Lookback: Bars to look back for recent highs/lows.
o ATR Multiplier: Multiplier for breakout threshold.
• Enable Higher Timeframe Trend: Toggle HTF EMA alignment.
o Higher Timeframe: E.g., “5” for 5-minute when on 1-minute chart, or “60” for 5 Min when on 15m, etc. Uses lookahead_off.
• Enable ADX Regime Filter: Toggles regime-based weighting.
o ADX Length: Period for manual ADX calculation.
o ADX Threshold: Value above which market considered trending.
o Ranging Weight Multiplier: Weight applied to trend components when ADX < threshold (e.g., 0.5).
• Scale VWMA Momentum: Toggle normalization of VWMA momentum magnitude.
o VWMA Mom Scale Lookback: Period for average absolute VWMA momentum.
• Scale ATR Breakout Strength: Toggle normalization of breakout distance by ATR.
o ATR Scale Cap: Maximum multiple of ATR used for breakout strength.
• Enable Price-RSI Divergence: Toggle divergence detection.
o RSI Length for Divergence: Period for RSI.
o Pivot Lookback for Divergence: Bars on each side to identify pivot high/low.
o Divergence Penalty: Amount to subtract/add to score when divergence detected (e.g., 0.5).
3. Score Settings
• Smooth Score: Toggle EMA smoothing of normalized score.
• Score Smoothing Length: Period for smoothing EMA.
• Weak Threshold: Absolute score value under which trend is considered weak or neutral.
• Medium Threshold: Score above Weak but below Medium is moderate.
• Strong Threshold: Score above this indicates strong trend.
4. Visualization Settings
• Show Δ Score Histogram: Toggle display of the bar-to-bar change in score as a histogram. Default true.
• Show Divergence Fill: Toggle background fill highlighting confirmed divergences. Default true.
Each input has a tooltip in the code.
________________________________________
## 10. Limitations, Repaint Notes, and Disclaimers
10.1. Repaint & Lag Considerations
• Pivot-Based Divergence Lag: The divergence detection uses ta.pivothigh / ta.pivotlow with a specified lookback. By design, a pivot is only confirmed after the lookback number of bars. As a result:
o Divergence labels or fills appear with a delay equal to the pivot lookback.
o Once the pivot is confirmed and the divergence is detected, the fill/label does not repaint thereafter, but you must understand and accept this lag.
o Users should not treat divergence highlights as predictive signals without additional confirmation, because they appear after the pivot has fully formed.
• Higher-Timeframe EMA Alignment: Uses request.security(..., lookahead=barmerge.lookahead_off), so no future data from the higher timeframe is used. This avoids lookahead bias and ensures signals are based only on completed higher-timeframe bars.
• No Future Data: All calculations are designed to avoid using future information. For example, manual ADX uses RMA on past data; security calls use lookahead_off.
10.2. Market & Noise Considerations
• In very choppy or low-liquidity markets, some components (e.g., volume spikes or VWMA momentum) may be noisy. Users can disable or adjust those components’ parameters.
• On extremely low timeframes, noise may dominate; consider smoothing lengths or disabling certain features.
• On very high timeframes, pivots and breakouts occur less frequently; adjust lookbacks accordingly to avoid sparse signals.
10.3. Not a Standalone Trading System
• This is an indicator, not a complete trading strategy. It provides signals and context but does not manage entries, exits, position sizing, or risk management.
• Users must combine it with their own analysis, money management, and confirmations (e.g., price patterns, support/resistance, fundamental context).
• No guarantees: past behavior does not guarantee future performance.
10.4. Disclaimers
• Educational Purposes Only: The script is provided as-is for educational and informational purposes. It does not constitute financial, investment, or trading advice.
• Use at Your Own Risk: Trading involves risk of loss. Users should thoroughly test and use proper risk management.
• No Guarantees: The author is not responsible for trading outcomes based on this indicator.
• License: Published under Mozilla Public License 2.0; code is open for viewing and modification under MPL terms.
________________________________________
## 11. Alerts
• The indicator defines three alert conditions:
1. Bullish Trend: when the aggregated score crosses above the Weak threshold.
2. Bearish Trend: when the score crosses below the negative Weak threshold.
3. Neutral Trend: when the score returns within ±Weak after being outside.
Good luck
– BullByte

Trend Strength & Direction📌 Assumptions of the "Trend Strength & Direction" Model
This model is designed to measure both trend strength and trend direction, using a modified version of the ADX (Average Directional Index) while also identifying ranging markets. Below is a detailed breakdown of all key assumptions.
1️⃣ Using ADX as the Basis for Trend Strength
Why ADX?
The ADX (Average Directional Index) is one of the most commonly used indicators for measuring trend strength, regardless of direction.
How is it calculated?
ATR (Average True Range) is used to normalize volatility.
Directional movement (+DM and -DM) is smoothed with an Exponential Moving Average (EMA) to obtain the +DI (Positive Directional Indicator) and -DI (Negative Directional Indicator).
Trend strength is derived by normalizing the absolute difference between +DI and -DI, divided by the sum of both.
🔹 Assumption: A high ADX means the trend is strong (whether bullish or bearish).
2️⃣ 50-Period Moving Average for Trend Strength
Why add a moving average?
ADX can be very volatile in the short term.
A 50-period SMA (Simple Moving Average) is used to smooth out trend strength and identify sustained trends.
🔹 Assumption: The SMA reduces false signals caused by short-term ADX spikes.
3️⃣ Identifying a Ranging Market (ADX Below 35)
How is a ranging market defined?
If the trend strength (ADX) is below 35, the market is considered "ranging".
The 35-level threshold is chosen empirically since ADX values below this level often indicate a lack of strong price direction.
When the market is ranging, the background color turns yellow.
🔹 Assumption: ADX < 35 indicates a sideways market, so the indicator colors the background yellow.
4️⃣ Determining Trend Direction Using +DI and -DI
How is direction determined?
If +DI > -DI, the trend is bullish (green).
If -DI > +DI, the trend is bearish (red).
If ADX is below 35, the market is ranging and turns yellow.
🔹 Assumption: Trend direction is determined by the relationship between +DI and -DI, not ADX values.
5️⃣ Background Color to Highlight Market Conditions
Yellow background if ADX < 35 → Ranging market.
Green background if ADX ≥ 35 and bullish.
Red background if ADX ≥ 35 and bearish.
🔹 Assumption: The background color visually differentiates trending vs. ranging phases.
6️⃣ Reference Levels for ADX
Lateral Threshold (35) → Below this, the trend is weak or ranging.
Neutral Threshold (50) → Intermediate level indicating moderate trend strength.
Strong Trend Threshold (75) → Above this, the trend is very strong and possibly overextended.
🔹 Assumption: ADX above 75 indicates a very strong trend, potentially near exhaustion.
🔹 Summary of Key Assumptions
1️⃣ ADX is the core strength metric → Strong trends when ADX > 35, weak below 35.
2️⃣ The 50-period SMA smooths out volatility → Prevents false signals.
3️⃣ Ranging markets are defined as ADX < 35 → Yellow background color.
4️⃣ Trend direction is based on +DI vs. -DI → Green = bullish, Red = bearish.
5️⃣ Background colors enhance readability → Helps distinguish different market phases.
6️⃣ ADX reference levels (35, 50, 75) indicate increasing trend strength.
Conclusion
This model combines ADX with a moving average and color-based logic to highlight trend strength, trend direction, and sideways markets. It helps traders quickly identify the best conditions for entering or exiting trades. 🚀

Strength Measurement -HTThe Strength Measurement -HT indicator is a tool designed to measure the strength and trend of a security using the Average Directional Index (ADX) across multiple time frames. This script averages the ADX values from five different time frames to provide a comprehensive view of the trend's strength, helping traders make more informed decisions.
Key Features:
Multi-Time Frame Analysis: The indicator calculates ADX values from five different time frames (5 minutes, 15 minutes, 30 minutes, 1 hour, and 4 hours) to offer a more holistic view of the market trend.
Trend Strength Visualization: The average ADX value is plotted as a histogram, with colors indicating the trend strength and direction, making it easy to visualize and interpret.
Reference Levels: The script includes horizontal lines at ADX levels 25, 50, and 75 to signify weak, strong, and very strong trends, respectively.
How It Works
Directional Movement Calculation: The script calculates the positive and negative directional movements (DI+) and (DI-) using the true range over a specified period (default is 14 periods).
ADX Calculation: The ADX value is derived from the smoothed moving average of the absolute difference between DI+ and DI-, normalized by their sum.
Multi-Time Frame ADX: ADX values are computed for the 5-minute, 15-minute, 30-minute, 1-hour, and 4-hour time frames.
Average ADX: The script averages the ADX values from the different time frames to generate a single, comprehensive ADX value.
Trend Visualization: The average ADX value is plotted as a histogram with colors indicating:
Gray for weak trends (ADX < 25)
Green for strengthening trends (25 ≤ ADX < 50)
Dark Green for strong trends (ADX ≥ 50)
Light Red for weakening trends (ADX < 25)
Red for strong trends turning weak (ADX ≥ 25)
Usage
Trend Detection: Use the color-coded histogram to quickly identify the trend strength and direction. Green indicates a strengthening trend, while red signifies a weakening trend.
Reference Levels: Utilize the horizontal lines at ADX levels 25, 50, and 75 as reference points to gauge the trend's strength.
ADX < 25 suggests a weak trend.
ADX between 25 and 50 indicates a moderate to strong trend.
ADX > 50 points to a very strong trend.
Multi-Time Frame Insight: Leverage the averaged ADX value to gain insights from multiple time frames, helping you make more informed trading decisions based on a broader market perspective.
Feel free to explore and integrate this indicator into your trading strategy to enhance your market analysis and decision-making process. Happy trading!

Meta-LR ForecastThis indicator builds a forward-looking projection from the current bar by combining twelve time-compressed “mini forecasts.” Each forecast is a linear-regression-based outlook whose contribution is adaptively scaled by trend strength (via ADX) and normalized to each timeframe’s own volatility (via that timeframe’s ATR). The result is a 12-segment polyline that starts at the current price and extends one bar at a time into the future (1× through 12× the chart’s timeframe). Alongside the plotted path, the script computes two summary measures:
* Per-TF Bias% — a directional efficiency × R² score for each micro-forecast, expressed as a percent.
* Meta Bias% — the same score, but applied to the final, accumulated 12-step path. It summarizes how coherent and directional the combined projection is.
This tool is an indicator, not a strategy. It does not place orders. Nothing here is trade advice; it is a visual, quantitative framework to help you assess directional bias and trend context across a ladder of timeframe multiples.
The core engine fits a simple least-squares line on a normalized price series for each small forecast horizon and extrapolates one bar forward. That “trend” forecast is paired with its mirror, an “anti-trend” forecast, constructed around the current normalized price. The model then blends between these two wings according to current trend strength as measured by ADX.
ADX is transformed into a weight (w) in using an adaptive band centered on the rolling mean (μ) with width derived from the standard deviation (σ) of ADX over a configurable lookback. When ADX is deeply below the lower band, the weight approaches -1, favoring anti-trend behavior. Inside the flat band, the weight is near zero, producing neutral behavior. Clearly above the upper band, the weight approaches +1, favoring a trend-following stance. The transitions between these regions are linear so the regime shift is smooth rather than abrupt.
You can shape how quickly the model commits to either wing using two exponents. One exponent controls how aggressively positive weights lean into the trend forecast; the other controls how aggressively negative weights lean into the anti-trend forecast. Raising these exponents makes the response more gradual; lowering them makes the shift more decisive. An optional switch can force full anti-trend behavior when ADX registers a deep-low condition far below the lower tail, if you prefer a categorical stance in very flat markets.
A key design choice is volatility normalization. Every micro-forecast is computed in ATR units of its own timeframe. The script fetches that timeframe’s ATR inside each security call and converts normalized outputs back to price with that exact ATR. This avoids scaling higher-timeframe effects by the chart ATR or by square-root time approximations. Using “ATR-true” for each timeframe keeps the cross-timeframe accumulation consistent and dimensionally correct.
Bias% is defined as directional efficiency multiplied by R², expressed as a percent. Directional efficiency captures how much net progress occurred relative to the total path length; R² captures how well the path aligns with a straight line. If price meanders without net progress, efficiency drops; if the variation is well-explained by a line, R² rises. Multiplying the two penalizes choppy, low-signal paths and rewards sustained, coherent motion.
The forward path is built by converting each per-timeframe Bias% into a small ATR-sized delta, then cumulatively adding those deltas to form a 12-step projection. This produces a polyline anchored at the current close and stepping forward one bar per timeframe multiple. Segment color flips by slope, allowing a quick read of the path’s direction and inflection.
Inputs you can tune include:
* Max Regression Length. Upper bound for each micro-forecast’s regression window. Larger values smooth the trend estimate at the cost of responsiveness; smaller values react faster but can add noise.
* Price Source. The price series analyzed (for example, close or typical price).
* ADX Length. Period used for the DMI/ADX calculation.
* ATR Length (normalization). Window used for ATR; this is applied per timeframe inside each security call.
* Band Lookback (for μ, σ). Lookback used to compute the adaptive ADX band statistics. Larger values stabilize the band; smaller values react more quickly.
* Flat half-width (σ). Width of the neutral band on both sides of μ. Wider flats spend more time neutral; narrower flats switch regimes more readily.
* Tail width beyond flat (σ). Distance from the flat band edge to the extreme trend/anti-trend zone. Larger tails create a longer ramp; smaller tails reach extremes sooner.
* Polyline Width. Visual thickness of the plotted segments.
* Negative Wing Aggression (anti-trend). Exponent shaping for negative weights; higher values soften the tilt into mean reversion.
* Positive Wing Aggression (trend). Exponent shaping for positive weights; lower values make trend commitment stronger and sooner.
* Force FULL Anti-Trend at Deep-Low ADX. Optional hard switch for extremely low ADX conditions.
On the chart you will see:
* A 12-segment forward polyline starting from the current close to bar\_index + 1 … +12, with green segments for up-steps and red for down-steps.
* A small label at the latest bar showing Meta Bias% when available, or “n/a” when insufficient data exists.
Interpreting the readouts:
* Trend-following contexts are characterized by ADX above the adaptive upper band, pushing w toward +1. The blended forecast leans toward the regression extrapolation. A strongly positive Meta Bias% in this environment suggests directional alignment across the ladder of timeframes.
* Mean-reversion contexts occur when ADX is well below the lower tail, pushing w toward -1 (or forcing anti-trend if enabled). After a sharp advance, a negative Meta Bias% may indicate the model projects pullback tendencies.
* Neutral contexts occur when ADX sits inside the flat band; w is near zero, the blended forecast remains close to current price, and Meta Bias% tends to hover near zero.
These are analytical cues, not rules. Always corroborate with your broader process, including market structure, time-of-day behavior, liquidity conditions, and risk limits.
Practical usage patterns include:
* Momentum confirmation. Combine a rising Meta Bias% with higher-timeframe structure (such as higher highs and higher lows) to validate continuation setups. Treat the 12th step’s distance as a coarse sense of potential room rather than as a target.
* Fade filtering. If you prefer fading extremes, require ADX to be near or below the lower ramp before acting on counter-moves, and avoid fades when ADX is decisively above the upper band.
* Position planning. Because per-step deltas are ATR-scaled, the path’s vertical extent can be mentally mapped to typical noise for the instrument, informing stop distance choices. The script itself does not compute orders or size.
* Multi-timeframe alignment. Each step corresponds to a clean multiple of your chart timeframe, so the polyline visualizes how successively larger windows bias price, all referenced to the current bar.
House-rules and repainting disclosures:
* Indicator, not strategy. The script does not execute, manage, or suggest orders. It displays computed paths and bias scores for analysis only.
* No performance claims. Past behavior of any measure, including Meta Bias%, does not guarantee future results. There are no assurances of profitability.
* Higher-timeframe updates. Values obtained via security for higher-timeframe series can update intrabar until the higher-timeframe bar closes. The forward path and Meta Bias% may change during formation of a higher-timeframe candle. If you need confirmed higher-timeframe inputs, consider reading the prior higher-timeframe value or acting only after the higher-timeframe close.
* Data sufficiency. The model requires enough history to compute ATR, ADX statistics, and regression windows. On very young charts or illiquid symbols, parts of the readout can be unavailable until sufficient data accumulates.
* Volatility regimes. ATR normalization helps compare across timeframes, but unusual volatility regimes can make the path look deceptively flat or exaggerated. Judge the vertical scale relative to your instrument’s typical ATR.
Tuning tips:
* Stability versus responsiveness. Increase Max Regression Length to steady the micro-forecasts but accept slower response. If you lower it, consider slightly increasing Band Lookback so regime boundaries are not too jumpy.
* Regime bands. Widen the flat half-width to spend more time neutral, which can reduce over-trading tendencies in chop. Shrink the tail width if you want the model to commit to extremes sooner, at the cost of more false swings.
* Wing shaping. If anti-trend behavior feels too abrupt at low ADX, raise the negative wing exponent. If you want trend bias to kick in more decisively at high ADX, lower the positive wing exponent. Small changes have large effects.
* Forced anti-trend. Enable the deep-low option only if you explicitly want a categorical “markets are flat, fade moves” policy. Many users prefer leaving it off to keep regime decisions continuous.
Troubleshooting:
* Nothing plots or the label shows “n/a.” Ensure the chart has enough history for the ADX band statistics, ATR, and the regression windows. Exotic or illiquid symbols with missing data may starve the higher-timeframe computations. Try a more liquid market or a higher timeframe.
* Path flickers or shifts during the bar. This is expected when any higher-timeframe input is still forming. Wait for the higher-timeframe close for fully confirmed behavior, or modify the code to read prior values from the higher timeframe.
* Polyline looks too flat or too steep. Check the chart’s vertical scale and recent ATR regime. Adjust Max Regression Length, the wing exponents, or the band widths to suit the instrument.
Integration ideas for manual workflows:
* Confluence checklist. Use Meta Bias% as one of several independent checks, alongside structure, session context, and event risk. Act only when multiple cues align.
* Stop and target thinking. Because deltas are ATR-scaled at each timeframe, benchmark your proposed stops and targets against the forward steps’ magnitude. Stops that are much tighter than the prevailing ATR often sit inside normal noise.
* Session context. Consider session hours and microstructure. The same ADX value can imply different tradeability in different sessions, particularly in index futures and FX.
This indicator deliberately avoids:
* Fixed thresholds for buy or sell decisions. Markets vary and fixed numbers invite overfitting. Decide what constitutes “high enough” Meta Bias% for your market and timeframe.
* Automatic risk sizing. Proper sizing depends on account parameters, instrument specifications, and personal risk tolerance. Keep that decision in your risk plan, not in a visual bias tool.
* Claims of edge. These measures summarize path geometry and trend context; they do not ensure a tradable edge on their own.
Summary of how to think about the output:
* The script builds a 12-step forward path by stacking linear-regression micro-forecasts across increasing multiples of the chart timeframe.
* Each micro-forecast is blended between trend and anti-trend using an adaptive ADX band with separate aggression controls for positive and negative regimes.
* All computations are done in ATR-true units for each timeframe before reconversion to price, ensuring dimensional consistency when accumulating steps.
* Bias% (per-timeframe and Meta) condenses directional efficiency and trend fidelity into a compact score.
* The output is designed to serve as an analytical overlay that helps assess whether conditions look trend-friendly, fade-friendly, or neutral, while acknowledging higher-timeframe update behavior and avoiding prescriptive trade rules.
Use this tool as one component within a disciplined process that includes independent confirmation, event awareness, and robust risk management.

Ruckard TradingLatinoThis strategy tries to mimic TradingLatino strategy.
The current implementation is beta.
Si hablas castellano o espanyol por favor consulta MENSAJE EN CASTELLANO más abajo.
It's aimed at BTCUSDT pair and 4h timeframe.
STRATEGY DEFAULT SETTINGS EXPLANATION
max_bars_back=5000 : This is a random number of bars so that the strategy test lasts for one or two years
calc_on_order_fills=false : To wait for the 4h closing is too much. Try to check if it's worth entering a position after closing one. I finally decided not to recheck if it's worth entering after an order is closed. So it is false.
calc_on_every_tick=false
pyramiding=0 : We only want one entry allowed in the same direction. And we don't want the order to scale by error.
initial_capital=1000 : These are 1000 USDT. By using 1% maximum loss per trade and 7% as a default stop loss by using 1000 USDT at 12000 USDT per BTC price you would entry with around 142 USDT which are converted into: 0.010 BTC . The maximum number of decimal for contracts on this BTCUSDT market is 3 decimals. E.g. the minimum might be: 0.001 BTC . So, this minimal 1000 amount ensures us not to entry with less than 0.001 entries which might have happened when using 100 USDT as an initial capital.
slippage=1 : Binance BTCUSDT mintick is: 0.01. Binance slippage: 0.1 % (Let's assume). TV has an integer slippage. It does not have a percentage based slippage. If we assume a 1000 initial capital, the recommended equity is 142 which at 11996 USDT per BTC price means: 0.011 BTC. The 0.1% slippage of: 0.011 BTC would be: 0.000011 . This is way smaller than the mintick. So our slippage is going to be 1. E.g. 1 (slippage) * 0.01 (mintick)
commission_type=strategy.commission.percent and commission_value=0.1 : According to: binance . com / en / fee / schedule in VIP 0 level both maker and taker fees are: 0.1 %.
BACKGROUND
Jaime Merino is a well known Youtuber focused on crypto trading
His channel TradingLatino
features monday to friday videos where he explains his strategy.
JAIME MERINO STANCE ON BOTS
Jaime Merino stance on bots (taken from memory out of a 2020 June video from him):
'~
You know. They can program you a bot and it might work.
But, there are some special situations that the bot would not be able to handle.
And, I, as a human, I would handle it. And the bot wouldn't do it.
~'
My long term target with this strategy script is add as many
special situations as I can to the script
so that it can match Jaime Merino behaviour even in non normal circumstances.
My alternate target is learn Pine script
and enjoy programming with it.
WARNING
This script might be bigger than other TradingView scripts.
However, please, do not be confused because the current status is beta.
This script has not been tested with real money.
This is NOT an official strategy from Jaime Merino.
This is NOT an official strategy from TradingLatino . net .
HOW IT WORKS
It basically uses ADX slope and LazyBear's Squeeze Momentum Indicator
to make its buy and sell decisions.
Fast paced EMA being bigger than slow paced EMA
(on higher timeframe) advices going long.
Fast paced EMA being smaller than slow paced EMA
(on higher timeframe) advices going short.
It finally add many substrats that TradingLatino uses.
SETTINGS
__ SETTINGS - Basics
____ SETTINGS - Basics - ADX
(ADX) Smoothing {14}
(ADX) DI Length {14}
(ADX) key level {23}
____ SETTINGS - Basics - LazyBear Squeeze Momentum
(SQZMOM) BB Length {20}
(SQZMOM) BB MultFactor {2.0}
(SQZMOM) KC Length {20}
(SQZMOM) KC MultFactor {1.5}
(SQZMOM) Use TrueRange (KC) {True}
____ SETTINGS - Basics - EMAs
(EMAS) EMA10 - Length {10}
(EMAS) EMA10 - Source {close}
(EMAS) EMA55 - Length {55}
(EMAS) EMA55 - Source {close}
____ SETTINGS - Volume Profile
Lowest and highest VPoC from last three days
is used to know if an entry has a support
VPVR of last 100 4h bars
is also taken into account
(VP) Use number of bars (not VP timeframe): Uses 'Number of bars {100}' setting instead of 'Volume Profile timeframe' setting for calculating session VPoC
(VP) Show tick difference from current price {False}: BETA . Might be useful for actions some day.
(VP) Number of bars {100}: If 'Use number of bars (not VP timeframe)' is turned on this setting is used to calculate session VPoC.
(VP) Volume Profile timeframe {1 day}: If 'Use number of bars (not VP timeframe)' is turned off this setting is used to calculate session VPoC.
(VP) Row width multiplier {0.6}: Adjust how the extra Volume Profile bars are shown in the chart.
(VP) Resistances prices number of decimal digits : Round Volume Profile bars label numbers so that they don't have so many decimals.
(VP) Number of bars for bottom VPOC {18}: 18 bars equals 3 days in suggested timeframe of 4 hours. It's used to calculate lowest session VPoC from previous three days. It's also used as a top VPOC for sells.
(VP) Ignore VPOC bottom advice on long {False}: If turned on it ignores bottom VPOC (or top VPOC on sells) when evaluating if a buy entry is worth it.
(VP) Number of bars for VPVR VPOC {100}: Number of bars to calculate the VPVR VPoC. We use 100 as Jaime once used. When the price bounces back to the EMA55 it might just bounce to this VPVR VPoC if its price it's lower than the EMA55 (Sells have inverse algorithm).
____ SETTINGS - ADX Slope
ADX Slope
help us to understand if ADX
has a positive slope, negative slope
or it is rather still.
(ADXSLOPE) ADX cut {23}: If ADX value is greater than this cut (23) then ADX has strength
(ADXSLOPE) ADX minimum steepness entry {45}: ADX slope needs to be 45 degrees to be considered as a positive one.
(ADXSLOPE) ADX minimum steepness exit {45}: ADX slope needs to be -45 degrees to be considered as a negative one.
(ADXSLOPE) ADX steepness periods {3}: In order to avoid false detection the slope is calculated along 3 periods.
____ SETTINGS - Next to EMA55
(NEXTEMA55) EMA10 to EMA55 bounce back percentage {80}: EMA10 might bounce back to EMA55 or maybe to 80% of its complete way to EMA55
(NEXTEMA55) Next to EMA55 percentage {15}: How much next to the EMA55 you need to be to consider it's going to bounce back upwards again.
____ SETTINGS - Stop Loss and Take Profit
You can set a default stop loss or a default take profit.
(STOPTAKE) Stop Loss % {7.0}
(STOPTAKE) Take Profit % {2.0}
____ SETTINGS - Trailing Take Profit
You can customize the default trailing take profit values
(TRAILING) Trailing Take Profit (%) {1.0}: Trailing take profit offset in percentage
(TRAILING) Trailing Take Profit Trigger (%) {2.0}: When 2.0% of benefit is reached then activate the trailing take profit.
____ SETTINGS - MAIN TURN ON/OFF OPTIONS
(EMAS) Ignore advice based on emas {false}.
(EMAS) Ignore advice based on emas (On closing long signal) {False}: Ignore advice based on emas but only when deciding to close a buy entry.
(SQZMOM) Ignore advice based on SQZMOM {false}: Ignores advice based on SQZMOM indicator.
(ADXSLOPE) Ignore advice based on ADX positive slope {false}
(ADXSLOPE) Ignore advice based on ADX cut (23) {true}
(STOPTAKE) Take Profit? {false}: Enables simple Take Profit.
(STOPTAKE) Stop Loss? {True}: Enables simple Stop Loss.
(TRAILING) Enable Trailing Take Profit (%) {True}: Enables Trailing Take Profit.
____ SETTINGS - Strategy mode
(STRAT) Type Strategy: 'Long and Short', 'Long Only' or 'Short Only'. Default: 'Long and Short'.
____ SETTINGS - Risk Management
(RISKM) Risk Management Type: 'Safe', 'Somewhat safe compound' or 'Unsafe compound'. ' Safe ': Calculations are always done with the initial capital (1000) in mind. The maximum losses per trade/day/week/month are taken into account. ' Somewhat safe compound ': Calculations are done with initial capital (1000) or a higher capital if it increases. The maximum losses per trade/day/week/month are taken into account. ' Unsafe compound ': In each order all the current capital is gambled and only the default stop loss per order is taken into account. That means that the maximum losses per trade/day/week/month are not taken into account. Default : 'Somewhat safe compound'.
(RISKM) Maximum loss per trade % {1.0}.
(RISKM) Maximum loss per day % {6.0}.
(RISKM) Maximum loss per week % {8.0}.
(RISKM) Maximum loss per month % {10.0}.
____ SETTINGS - Decimals
(DECIMAL) Maximum number of decimal for contracts {3}: How small (3 decimals means 0.001) an entry position might be in your exchange.
EXTRA 1 - PRICE IS IN RANGE indicator
(PRANGE) Print price is in range {False}: Enable a bottom label that indicates if the price is in range or not.
(PRANGE) Price range periods {5}: How many previous periods are used to calculate the medians
(PRANGE) Price range maximum desviation (%) {0.6} ( > 0 ): Maximum positive desviation for range detection
(PRANGE) Price range minimum desviation (%) {0.6} ( > 0 ): Mininum negative desviation for range detection
EXTRA 2 - SQUEEZE MOMENTUM Desviation indicator
(SQZDIVER) Show degrees {False}: Show degrees of each Squeeze Momentum Divergence lines to the x-axis.
(SQZDIVER) Show desviation labels {False}: Whether to show or not desviation labels for the Squeeze Momentum Divergences.
(SQZDIVER) Show desviation lines {False}: Whether to show or not desviation lines for the Squeeze Momentum Divergences.
EXTRA 3 - VOLUME PROFILE indicator
WARNING: This indicator works not on current bar but on previous bar. So in the worst case it might be VP from 4 hours ago. Don't worry, inside the strategy calculus the correct values are used. It's just that I cannot show the most recent one in the chart.
(VP) Print recent profile {False}: Show Volume Profile indicator
(VP) Avoid label price overlaps {False}: Avoid label prices to overlap on the chart.
EXTRA 4 - ZIGNALY SUPPORT
(ZIG) Zignaly Alert Type {Email}: 'Email', 'Webhook'. ' Email ': Prepare alert_message variable content to be compatible with zignaly expected email content format. ' Webhook ': Prepare alert_message variable content to be compatible with zignaly expected json content format.
EXTRA 5 - DEBUG
(DEBUG) Enable debug on order comments {False}: If set to true it prepares the order message to match the alert_message variable. It makes easier to debug what would have been sent by email or webhook on each of the times an order is triggered.
HOW TO USE THIS STRATEGY
BOT MODE: This is the default setting.
PROPER VOLUME PROFILE VIEWING: Click on this strategy settings. Properties tab. Make sure Recalculate 'each time the order was run' is turned off.
NEWBIE USER: (Check PROPER VOLUME PROFILE VIEWING above!) You might want to turn on the 'Print recent profile {False}' setting. Alternatively you can use my alternate realtime study: 'Resistances and supports based on simplified Volume Profile' but, be aware, it might consume one indicator.
ADVANCED USER 1: Turn on the 'Print price is in range {False}' setting and help us to debug this subindicator. Also help us to figure out how to include this value in the strategy.
ADVANCED USER 2: Turn on the all the (SQZDIVER) settings and help us to figure out how to include this value in the strategy.
ADVANCED USER 3: (Check PROPER VOLUME PROFILE VIEWING above!) Turn on the 'Print recent profile {False}' setting and report any problem with it.
JAIME MERINO: Just use the indicator as it comes by default. It should only show BUY signals, SELL signals and their associated closing signals. From time to time you might want to check 'ADVANCED USER 2' instructions to check that there's actually a divergence. Check also 'ADVANCED USER 1' instructions for your amusement.
EXTRA ADVICE
It's advised that you use this strategy in addition to these two other indicators:
* Squeeze Momentum Indicator
* ADX
so that your chart matches as close as possible to TradingLatino chart.
ZIGNALY INTEGRATION
This strategy supports Zignaly email integration by default. It also supports Zignaly Webhook integration.
ZIGNALY INTEGRATION - Email integration example
What you would write in your alert message:
||{{strategy.order.alert_message}}||key=MYSECRETKEY||
ZIGNALY INTEGRATION - Webhook integration example
What you would write in your alert message:
{ {{strategy.order.alert_message}} , "key" : "MYSECRETKEY" }
CREDITS
I have reused and adapted some code from
'Directional Movement Index + ADX & Keylevel Support' study
which it's from TradingView console user.
I have reused and adapted some code from
'3ema' study
which it's from TradingView hunganhnguyen1193 user.
I have reused and adapted some code from
'Squeeze Momentum Indicator ' study
which it's from TradingView LazyBear user.
I have reused and adapted some code from
'Strategy Tester EMA-SMA-RSI-MACD' study
which it's from TradingView fikira user.
I have reused and adapted some code from
'Support Resistance MTF' study
which it's from TradingView LonesomeTheBlue user.
I have reused and adapted some code from
'TF Segmented Linear Regression' study
which it's from TradingView alexgrover user.
I have reused and adapted some code from
"Poor man's volume profile" study
which it's from TradingView IldarAkhmetgaleev user.
FEEDBACK
Please check the strategy source code for more detailed information
where, among others, I explain all of the substrats
and if they are implemented or not.
Q1. Did I understand wrong any of the Jaime substrats (which I have implemented)?
Q2. The strategy yields quite profit when we should long (EMA10 from 1d timeframe is higher than EMA55 from 1d timeframe.
Why the strategy yields much less profit when we should short (EMA10 from 1d timeframe is lower than EMA55 from 1d timeframe)?
Any idea if you need to do something else rather than just reverse what Jaime does when longing?
FREQUENTLY ASKED QUESTIONS
FAQ1. Why are you giving this strategy for free?
TradingLatino and his fellow enthusiasts taught me this strategy. Now I'm giving back to them.
FAQ2. Seriously! Why are you giving this strategy for free?
I'm confident his strategy might be improved a lot. By keeping it to myself I would avoid other people contributions to improve it.
Now that everyone can contribute this is a win-win.
FAQ3. How can I connect this strategy to my Exchange account?
It seems that you can attach alerts to strategies.
You might want to combine it with a paying account which enable Webhook URLs to work.
I don't know how all of this works right now so I cannot give you advice on it.
You will have to do your own research on this subject. But, be careful. Automating trades, if not done properly,
might end on you automating losses.
FAQ4. I have just found that this strategy by default gives more than 3.97% of 'maximum series of losses'. That's unacceptable according to my risk management policy.
You might want to reduce default stop loss setting from 7% to something like 5% till you are ok with the 'maximum series of losses'.
FAQ5. Where can I learn more about your work on this strategy?
Check the source code. You might find unused strategies. Either because there's not a substantial increases on earnings. Or maybe because they have not been implemented yet.
FAQ6. How much leverage is applied in this strategy?
No leverage.
FAQ7. Any difference with original Jaime Merino strategy?
Most of the times Jaime defines an stop loss at the price entry. That's not the case here. The default stop loss is 7% (but, don't be confused it only means losing 1% of your investment thanks to risk management). There's also a trailing take profit that triggers at 2% profit with a 1% trailing.
FAQ8. Why this strategy return is so small?
The strategy should be improved a lot. And, well, backtesting in this platform is not guaranteed to return theoric results comparable to real-life returns. That's why I'm personally forward testing this strategy to verify it.
MENSAJE EN CASTELLANO
En primer lugar se agradece feedback para mejorar la estrategia.
Si eres un usuario avanzado y quieres colaborar en mejorar el script no dudes en comentar abajo.
Ten en cuenta que aunque toda esta descripción tenga que estar en inglés no es obligatorio que el comentario esté en inglés.
CHISTE - CASTELLANO
¡Pero Jaime!
¡400.000!
¡Tu da mun!

BB Breakout-Momentum + Reversion Strategies# BB Breakout-Momentum + Reversion Strategies
## Overview
This indicator combines two complementary Bollinger Band trading strategies that automatically adapt to market conditions. Strategy 1 capitalizes on trending markets with breakout-pullback-momentum setups, while Strategy 2 exploits mean reversion in ranging markets. Advanced filtering using ADX and BB Width ensures each strategy only fires in its optimal market environment.
---
## Strategy 1: Breakout → Pullback → Renewed Momentum (Long B / Short B)
### Best Market Conditions
- **Trending Markets**: ADX ≥ 25
- **High Volatility**: BB Width ≥ 1.0× average
- Directional price action with sustained momentum
### Entry Logic
**Long B (Bullish Breakout):**
1. **Initial Breakout**: Price breaks above upper Bollinger Band with strong momentum
2. **Controlled Pullback**: Price pulls back 1-12 bars but holds above lower band (stays in trend)
3. **Defended Zone**: Pullback creates a support zone based on swing lows (validated by multiple touches)
4. **Renewed Momentum**: Price reclaims with green candle, volume confirmation, bullish MACD
5. **Position Check**: Entry must have cushion below upper band and room to reach targets
**Short B (Bearish Breakdown):**
- Mirror logic for downtrends: breakdown below lower band, pullback stays below upper band, renewed selling pressure
### Risk Management
- **Stop Loss**: Lower of (zone floor/previous low) OR (1.5 × ATR from entry)
- **Targets**:
- T1: Entry + 0.85R (0.85 × 1.5 ATR)
- T2: Entry + 1.40R (1.40 × 1.5 ATR)
- T3: Entry + 2.50R (2.50 × 1.5 ATR)
- T4: Entry + 4.50R (4.50 × 1.5 ATR)
- Risk is calculated using ATR (ATRX = 1.5 ATR), stop uses tighter of structural level (ATRL) or ATRX
---
## Strategy 2: Bollinger Band Mean Reversion (Long R / Short R)
### Best Market Conditions
- **Ranging Markets**: ADX ≤ 20
- **Low Volatility**: BB Width ≤ 0.8× average
- Price oscillating around the mean without sustained trend
### Entry Logic
**Long R (Long Reversion):**
1. **Overextension**: Price breaks below lower Bollinger Band (2 consecutive closes)
2. **Snap Back**: Price crosses back above lower band (re-enters the range)
3. **Entry Window**: Within 2 candles of re-entry, look for:
- **Green candle** (close > open) confirming bullish strength
- Close above previous candle (close > close )
4. **Trigger**: First qualifying candle within 2-bar window executes the trade
**Short R (Short Reversion):**
1. **Overextension**: Price breaks above upper Bollinger Band (2 consecutive closes)
2. **Snap Back**: Price crosses back below upper band (re-enters the range)
3. **Entry Window**: Within 2 candles of re-entry, look for:
- **Red candle** (close < open) confirming bearish pressure
- Close below previous candle (close < close )
4. **Trigger**: First qualifying candle within 2-bar window executes the trade
### Risk Management
- **Stop Loss**: Lower of (previous high/low) OR (1.5 × ATR from entry)
- **Targets**: Same as Strategy 1 (0.85R, 1.4R, 2.5R, 4.5R based on 1.5 ATR)
- Betting on return to Bollinger Band basis (mean)
---
## Advanced Filtering System
### ADX Filter (Average Directional Index)
- **Purpose**: Measures trend strength vs choppy/ranging conditions
- **Trending**: ADX ≥ 25 → Enables Strategy 1 (Breakout)
- **Ranging**: ADX ≤ 20 → Enables Strategy 2 (Reversion)
- **Neutral**: ADX 20-25 → No signals (indecisive market)
### BB Width Filter
- **Purpose**: Confirms volatility expansion/contraction
- **Wide Bands**: Current width ≥ 1.0× 50-bar average → Trending environment
- **Narrow Bands**: Current width ≤ 0.8× 50-bar average → Ranging environment
- **Logic**: Both ADX and BB Width must agree on market state before signaling
### Combined Logic
- **Strategy 1 fires**: When BOTH ADX shows trending AND bands are wide
- **Strategy 2 fires**: When BOTH ADX shows ranging AND bands are narrow
- **Visual Display**: Table at bottom-right shows ADX value, BB Width ratio, and current market state
---
## Visual Elements
### Bollinger Bands
- **Gray line**: 20-period SMA (basis/mean)
- **Green line**: Upper band (basis + 2 standard deviations)
- **Red line**: Lower band (basis - 2 standard deviations)
### Strategy 1 Markers
- **Long B**: Green triangle below bar with "Long B" text
- **Short B**: Orange triangle above bar with "Short B" text
- **Defended Zones**: Green/red boxes showing pullback support/resistance areas
- **Targets**: Green/orange crosses showing T1-T4 and stop loss levels
### Strategy 2 Markers
- **Long R**: Blue label below bar with "Long R" text
- **Short R**: Purple label above bar with "Short R" text
- **Trade Levels**: Horizontal lines extending 50 bars forward
- Blue solid = Entry price
- Red dashed = Stop loss
- Green/Orange dotted = Targets (T1-T4)
### Market State Table
- **ADX**: Current value with color coding (green=trending, orange=ranging, gray=neutral)
- **BB Width**: Ratio vs 50-bar average (e.g., "1.15x" = 15% wider than average)
- **State**: TREND / RANGE / NEUTRAL classification
---
## Settings & Customization
### Bollinger Bands
- **BB Length**: 20 (default) - period for moving average
- **BB Std Dev**: 2.0 (default) - standard deviation multiplier
### ATR & Risk
- **ATR Length**: 14 (default) - period for Average True Range calculation
- All stop losses and targets are derived from 1.5 × ATR
### Trend/Range Filters
- **ADX Length**: 14 (default)
- **ADX Trending Threshold**: 25 (higher = stronger trend required)
- **ADX Ranging Threshold**: 20 (lower = tighter ranging condition)
- **BB Width Average Length**: 50 (period for comparing current width)
- **BB Width Trend Multiplier**: 1.0 (width must be ≥ this × average)
- **BB Width Range Multiplier**: 0.8 (width must be ≤ this × average)
- **Use ADX Filter**: Toggle on/off
- **Use BB Width Filter**: Toggle on/off
### Strategy 1 (Breakout-Momentum)
- **Breakout Lookback**: 15 bars (how far back to search for initial breakout)
- **Min Pullback Bars**: 1 (minimum consolidation period)
- **Max Pullback Bars**: 12 (maximum consolidation period)
- **Show Defended Zone**: Display support/resistance boxes
- **Show Signals**: Display Long B / Short B markers
- **Show Targets**: Display stop loss and target levels
### Strategy 2 (Reversion)
- **Show Signals**: Display Long R / Short R markers
- **Show Trade Levels**: Display entry, stop, and target lines
---
## How to Use This Indicator
### Step 1: Identify Market State
- Check the table in bottom-right corner
- **TREND**: Look for Strategy 1 signals (Long B / Short B)
- **RANGE**: Look for Strategy 2 signals (Long R / Short R)
- **NEUTRAL**: Wait for clearer conditions
### Step 2: Wait for Signal
- Signals only fire when ALL conditions are met (structural + momentum + filters + room-to-target)
- Signals are relatively rare but high-probability
### Step 3: Execute Trade
- **Entry**: Close of signal candle
- **Stop Loss**: Shown as red cross (Strategy 1) or red dashed line (Strategy 2)
- **Targets**: Scale out at T1, T2, T3, T4 or hold for maximum R:R
### Step 4: Management
- Consider moving stop to breakeven after T1
- Trail stop using swing lows/highs in Strategy 1
- Exit full position at T2-T3 in Strategy 2 (mean reversion has limited upside)
---
## Key Principles
### Why This Works
1. **Market Adaptation**: Uses right strategy for right conditions (trend vs range)
2. **Confluence**: Multiple confirmations required (structure + momentum + volatility + room)
3. **Risk-Defined**: Every trade has pre-calculated stop and targets based on ATR
4. **Probability**: Filters reduce noise and increase win rate by waiting for ideal setups
### Common Pitfalls to Avoid
- ❌ Taking signals in NEUTRAL market state (indicators disagree)
- ❌ Overriding the stop loss (it's calculated for a reason)
- ❌ Expecting signals on every swing (quality over quantity)
- ❌ Using Strategy 1 in ranging markets or Strategy 2 in trending markets
- ❌ Ignoring the room-to-target check (signal won't fire if targets are blocked)
### Complementary Analysis
This indicator works best when combined with:
- Higher timeframe trend analysis
- Key support/resistance levels
- Volume analysis
- Market structure (swing highs/lows)
- Risk management rules (position sizing, max daily loss, etc.)
---
## Technical Details
### Indicators Used
- **Bollinger Bands**: 20-period SMA ± 2 standard deviations
- **ATR**: 14-period Average True Range for volatility measurement
- **ADX**: 14-period Average Directional Index for trend strength
- **EMA**: 10 and 20-period exponential moving averages (Strategy 1 filter)
- **MACD**: 12/26/9 settings (Strategy 1 momentum confirmation)
- **Volume**: Compared to 15-bar average (Strategy 1 confirmation)
### Calculation Methodology
- **ATRL** (Structural Risk): Previous swing high/low or defended zone boundary
- **ATRX** (ATR Risk): 1.5 × 14-period ATR from entry price
- **Stop Loss**: Minimum of ATRL and ATRX (tightest protection)
- **Targets**: Always calculated from ATRX (consistent R-multiples)
- **BB Width Ratio**: Current BB width ÷ 50-period SMA of BB width
---
## Performance Notes
### Strengths
- Adapts to changing market conditions automatically
- Clear, objective entry and exit criteria
- Pre-defined risk on every trade
- Filters reduce false signals significantly
- Works across multiple timeframes and instruments
### Limitations
- Signals are infrequent (by design - quality over quantity)
- Requires patience to wait for all conditions to align
- May miss explosive moves if pullback doesn't form properly (Strategy 1)
- Ranging markets can transition to trending (Strategy 2 risk)
- Filters may delay entry in fast-moving markets
### Best Timeframes
- **Strategy 1**: 1H, 4H, Daily (needs time for proper pullback structure)
- **Strategy 2**: 15M, 30M, 1H (mean reversion works best intraday)
- Both strategies can work on any timeframe if market conditions are right
### Best Instruments
- **Liquid markets**: Major stocks, indices, forex pairs, liquid crypto
- **Sufficient volatility**: ATR should be meaningful relative to price
- **Clear trend/range cycles**: Markets that respect technical levels
---
## IMPORTANT DISCLAIMER
### Risk Warning
**TRADING INVOLVES SUBSTANTIAL RISK OF LOSS AND IS NOT SUITABLE FOR ALL INVESTORS.**
This indicator is provided for **educational and informational purposes only**. It does not constitute financial advice, investment advice, trading advice, or any other sort of advice. You should not treat any of the indicator's content as such.
### No Guarantee of Profit
Past performance is not indicative of future results. No trading strategy, including this indicator, can guarantee profits or protect against losses. The market is inherently unpredictable and all trading involves risk.
### User Responsibility
- **Do Your Own Research**: Always conduct your own analysis before making trading decisions
- **Test First**: Backtest and paper trade this strategy before risking real capital
- **Risk Management**: Never risk more than you can afford to lose
- **Position Sizing**: Use appropriate position sizes relative to your account
- **Stop Losses**: Always use stop losses and respect them
- **Market Conditions**: Understand that market conditions change and past behavior may not repeat
### No Liability
The creator of this indicator accepts no liability for any financial losses incurred through the use of this tool. All trading decisions are made at your own risk. You are solely responsible for evaluating the merits and risks associated with the use of any trading systems, signals, or content provided.
### Not Financial Advice
This indicator does not take into account your personal financial situation, investment objectives, risk tolerance, or specific needs. You should consult with a licensed financial advisor before making any investment decisions.
### Technical Limitations
- Indicators can repaint or lag in real-time
- Past signals may look different than real-time signals
- Code bugs or errors may exist despite testing
- TradingView platform limitations may affect functionality
### Market Risks
- Markets can gap, causing stops to be executed at worse prices
- Slippage and commissions can significantly impact results
- High volatility can cause unexpected losses
- Counterparty risk exists in all leveraged products
---
## Version History
- **v1.0**: Initial release combining breakout-momentum and mean reversion strategies
- Includes ADX and BB Width filtering
- ATRL/ATRX risk calculation system
- 2-candle entry window for reversion trades
---
## Credits & License
This indicator combines concepts from classical technical analysis including Bollinger Bands (John Bollinger), ATR (Welles Wilder), and ADX (Welles Wilder). The specific implementation and combination of filters is original work.
**Use at your own risk. Trade responsibly.**
---
*For questions, suggestions, or to report bugs, please comment below or contact the author.*
**Remember: The best indicator is the one between your ears. Use this tool as part of a comprehensive trading plan, not as a standalone solution.**

Average Directional Index with MACombining the Average Directional Index (ADX) with a 14-period Exponential Moving Average (EMA) can provide traders with a comprehensive approach to identify both the strength of a trend (through ADX) and the trend's direction (using EMA). Let's break down each component and then discuss how they can be combined:
Average Directional Index (ADX):
The ADX is a technical indicator that measures the strength or momentum of a trend, regardless of its direction. The ADX is derived from two other indicators:
Positive Directional Index (+DI): Measures the strength of upward price movement.
Negative Directional Index (-DI): Measures the strength of downward price movement.
14-period Exponential Moving Average (EMA):
The 14-period EMA is a trend-following indicator that gives more weight to recent price data compared to simple moving averages (SMAs). The EMA is calculated by taking the average of the last 14 closing prices, giving more importance to the most recent prices.
Combining ADX and EMA:
When combining ADX with a 14-period EMA:
ADX as a Filter:
Traders might use the ADX to filter out trades when the trend's strength is weak (e.g., ADX below 25) to avoid trading in sideways or choppy markets.
EMA for Trend Direction:
Traders can use the 14-period EMA to determine the trend direction.
A price above the 14-period EMA might indicate an uptrend, while a price below the EMA might suggest a downtrend.
Example Strategy:
Here's a simplified trading strategy combining ADX and EMA:
Trend Identification:
Buy when the price is above the 14-period EMA and the ADX indicates a strong uptrend (e.g., ADX > 25).
Sell or go short when the price is below the 14-period EMA and the ADX indicates a strong downtrend (e.g., ADX > 25).
Avoid Choppy Markets:
Avoid trading when the ADX is below a certain threshold (e.g., ADX < 25) to filter out sideways or range-bound markets.
Combining ADX and a 14-period EMA can provide traders with a balanced approach to identify both the strength and direction of a trend. However, it's essential to remember that no indicator or strategy can guarantee profits, and it's crucial to use risk management techniques and other tools to make informed trading decisions. Consider back testing this strategy on historical data and adjusting the parameters based on their trading style and risk tolerance.

Reversal Point Dynamics - Machine Learning⇋ Reversal Point Dynamics - Machine Learning
RPD Machine Learning: Self-Adaptive Multi-Armed Bandit Trading System
RPD Machine Learning is an advanced algorithmic trading system that implements genuine machine learning through contextual multi-armed bandits, reinforcement learning, and online adaptation. Unlike traditional indicators that use fixed rules, RPD learns from every trade outcome , automatically discovers which strategies work in current market conditions, and continuously adapts without manual intervention .
Core Innovation: The system deploys six distinct trading policies (ranging from aggressive trend-following to conservative range-bound strategies) and uses LinUCB contextual bandit algorithms with Random Fourier Features to learn which policy performs best in each market regime. After the initial learning phase (50-100 trades), the system achieves autonomous adaptation , automatically shifting between policies as market conditions evolve.
Target Users: Quantitative traders, algorithmic trading developers, systematic traders, and data-driven investors who want a system that adapts over time . Suitable for stocks, futures, forex, and cryptocurrency on any liquid instrument with >100k daily volume.
The Problem This System Solves
Traditional Technical Analysis Limitations
Most trading systems suffer from three fundamental challenges :
Fixed Parameters: Static settings (like "buy when RSI < 30") work well in backtests but may struggle when markets change character. What worked in low-volatility environments may not work in high-volatility regimes.
Strategy Degradation: Manual optimization (curve-fitting) produces systems that perform well on historical data but may underperform in live trading. The system never adapts to new market conditions.
Cognitive Overload: Running multiple strategies simultaneously forces traders to manually decide which one to trust. This leads to hesitation, late entries, and inconsistent execution.
How RPD Machine Learning Addresses These Challenges
Automated Strategy Selection: Instead of requiring you to choose between trend-following and mean-reversion strategies, RPD runs all six policies simultaneously and uses machine learning to automatically select the best one for current conditions. The decision happens algorithmically, removing human hesitation.
Continuous Learning: After every trade, the system updates its understanding of which policies are working. If the market shifts from trending to ranging, RPD automatically detects this through changing performance patterns and adjusts selection accordingly.
Context-Aware Decisions: Unlike simple voting systems that treat all conditions equally, RPD analyzes market context (ADX regime, entropy levels, volatility state, volume patterns, time of day, historical performance) and learns which combinations of context features correlate with policy success.
Machine Learning Architecture: What Makes This "Real" ML
Component 1: Contextual Multi-Armed Bandits (LinUCB)
What Is a Multi-Armed Bandit Problem?
Imagine facing six slot machines, each with unknown payout rates. The exploration-exploitation dilemma asks: Should you keep pulling the machine that's worked well (exploitation) or try others that might be better (exploration)? RPD solves this for trading policies.
Academic Foundation:
RPD implements Linear Upper Confidence Bound (LinUCB) from the research paper "A Contextual-Bandit Approach to Personalized News Article Recommendation" (Li et al., 2010, WWW Conference). This algorithm is used in content recommendation and ad placement systems.
How It Works:
Each policy (AggressiveTrend, ConservativeRange, VolatilityBreakout, etc.) is treated as an "arm." The system maintains:
Reward History: Tracks wins/losses for each policy
Contextual Features: Current market state (8-10 features including ADX, entropy, volatility, volume)
Uncertainty Estimates: Confidence in each policy's performance
UCB Formula: predicted_reward + α × uncertainty
The system selects the policy with highest UCB score , balancing proven performance (predicted_reward) with potential for discovery (uncertainty bonus). Initially, all policies have high uncertainty, so the system explores broadly. After 50-100 trades, uncertainty decreases, and the system focuses on known-performing policies.
Why This Matters:
Traditional systems pick strategies based on historical backtests or user preference. RPD learns from actual outcomes in your specific market, on your timeframe, with your execution characteristics.
Component 2: Random Fourier Features (RFF)
The Non-Linearity Challenge:
Market relationships are often non-linear. High ADX may indicate favorable conditions when volatility is normal, but unfavorable when volatility spikes. Simple linear models struggle to capture these interactions.
Academic Foundation:
RPD implements Random Fourier Features from "Random Features for Large-Scale Kernel Machines" (Rahimi & Recht, 2007, NIPS). This technique approximates kernel methods (like Support Vector Machines) while maintaining computational efficiency for real-time trading.
How It Works:
The system transforms base features (ADX, entropy, volatility, etc.) into a higher-dimensional space using random projections and cosine transformations:
Input: 8 base features
Projection: Through random Gaussian weights
Transformation: cos(W×features + b)
Output: 16 RFF dimensions
This allows the bandit to learn non-linear relationships between market context and policy success. For example: "AggressiveTrend performs well when ADX >25 AND entropy <0.6 AND hour >9" becomes naturally encoded in the RFF space.
Why This Matters:
Without RFF, the system could only learn "this policy has X% historical performance." With RFF, it learns "this policy performs differently in these specific contexts" - enabling more nuanced selection.
Component 3: Reinforcement Learning Stack
Beyond bandits, RPD implements a complete RL framework :
Q-Learning: Value-based RL that learns state-action values. Maps 54 discrete market states (trend×volatility×RSI×volume combinations) to 5 actions (4 policies + no-trade). Updates via Bellman equation after each trade. Converges toward optimal policy after 100-200 trades.
TD(λ) with Eligibility Traces: Extension of Q-Learning that propagates credit backwards through time . When a trade produces an outcome, TD(λ) updates not just the final state-action but all states visited during the trade, weighted by eligibility decay (λ=0.90). This accelerates learning from multi-bar trades.
Policy Gradient (REINFORCE): Learns a stochastic policy directly from 12 continuous market features without discretization. Uses gradient ascent to increase probability of actions that led to positive outcomes. Includes baseline (average reward) for variance reduction.
Meta-Learning: The system learns how to learn by adapting its own learning rates based on feature stability and correlation with outcomes. If a feature (like volume ratio) consistently correlates with success, its learning rate increases. If unstable, rate decreases.
Why This Matters:
Q-Learning provides fast discrete decisions. Policy Gradient handles continuous features. TD(λ) accelerates learning. Meta-learning optimizes the optimization. Together, they create a robust, multi-approach learning system that adapts more quickly than any single algorithm.
Component 4: Policy Momentum Tracking (v2 Feature)
The Recency Challenge:
Standard bandits treat all historical data equally. If a policy performed well historically but struggles in current conditions due to regime shift, the system may be slow to adapt because historical success outweighs recent underperformance.
RPD's Solution:
Each policy maintains a ring buffer of the last 10 outcomes. The system calculates:
Momentum: recent_win_rate - global_win_rate (range: -1 to +1)
Confidence: consistency of recent results (1 - variance)
Policies with positive momentum (recent outperformance) get an exploration bonus. Policies with negative momentum and high confidence (consistent recent underperformance) receive a selection penalty.
Effect: When markets shift, the system detects the shift more quickly through momentum tracking, enabling faster adaptation than standard bandits.
Signal Generation: The Core Algorithm
Multi-Timeframe Fractal Detection
RPD identifies reversal points using three complementary methods :
1. Quantum State Analysis:
Divides price range into discrete states (default: 6 levels)
Peak signals require price in top states (≥ state 5)
Valley signals require price in bottom states (≤ state 1)
Prevents mid-range signals that may struggle in strong trends
2. Fractal Geometry:
Identifies swing highs/lows using configurable fractal strength
Confirms local extremum with neighboring bars
Validates reversal only if price crosses prior extreme
3. Multi-Timeframe Confirmation:
Analyzes higher timeframe (4× default) for alignment
MTF confirmation adds probability bonus
Designed to reduce false signals while preserving valid setups
Probability Scoring System
Each signal receives a dynamic probability score (40-99%) based on:
Base Components:
Trend Strength: EMA(velocity) / ATR × 30 points
Entropy Quality: (1 - entropy) × 10 points
Starting baseline: 40 points
Enhancement Bonuses:
Divergence Detection: +20 points (price/momentum divergence)
RSI Extremes: +8 points (RSI >65 for peaks, <40 for valleys)
Volume Confirmation: +5 points (volume >1.2× average)
Adaptive Momentum: +10 points (strong directional velocity)
MTF Alignment: +12 points (higher timeframe confirms)
Range Factor: (high-low)/ATR × 3 - 1.5 points (volatility adjustment)
Regime Bonus: +8 points (trending ADX >25 with directional agreement)
Penalties:
High Entropy: -5 points (entropy >0.85, chaotic price action)
Consolidation Regime: -10 points (ADX <20, no directional conviction)
Final Score: Clamped to 40-99% range, classified as ELITE (>85%), STRONG (75-85%), GOOD (65-75%), or FAIR (<65%)
Entropy-Based Quality Filter
What Is Entropy?
Entropy measures randomness in price changes . Low entropy indicates orderly, directional moves. High entropy indicates chaotic, unpredictable conditions.
Calculation:
Count up/down price changes over adaptive period
Calculate probability: p = ups / total_changes
Shannon entropy: -p×log(p) - (1-p)×log(1-p)
Normalized to 0-1 range
Application:
Entropy <0.5: Highly ordered (ELITE signals possible)
Entropy 0.5-0.75: Mixed (GOOD signals)
Entropy >0.85: Chaotic (signals blocked or heavily penalized)
Why This Matters:
Prevents trading during choppy, news-driven conditions where technical patterns may be less reliable. Automatically raises quality bar when market is unpredictable.
Regime Detection & Market Microstructure - ADX-Based Regime Classification
RPD uses Wilder's Average Directional Index to classify markets:
Bull Trend: ADX >25, +DI > -DI (directional conviction bullish)
Bear Trend: ADX >25, +DI < -DI (directional conviction bearish)
Consolidation: ADX <20 (no directional conviction)
Transitional: ADX 20-25 (forming direction, ambiguous)
Filter Logic:
Blocks all signals during Transitional regime (avoids trading during uncertain conditions)
Blocks Consolidation signals unless ADX ≥ Min Trend Strength
Adds probability bonus during strong trends (ADX >30)
Effect: Designed to reduce signal frequency while focusing on higher-quality setups.
Divergence Detection
Bearish Divergence:
Price makes higher high
Velocity (price momentum) makes lower high
Indicates weakening upward pressure → SHORT signal quality boost
Bullish Divergence:
Price makes lower low
Velocity makes higher low
Indicates weakening downward pressure → LONG signal quality boost
Bonus: Adds probability points and additional acceleration factor. Divergence signals have historically shown higher success rates in testing.
Hierarchical Policy System - The Six Trading Policies
1. AggressiveTrend (Policy 0):
Probability Threshold: 60% (trades more frequently)
Entropy Threshold: 0.70 (tolerates moderate chaos)
Stop Multiplier: 2.5× ATR (wider stops for trends)
Target Multiplier: 5.0R (larger targets)
Entry Mode: Pyramid (scales into winners)
Best For: Strong trending markets, breakouts, momentum continuation
2. ConservativeRange (Policy 1):
Probability Threshold: 75% (more selective)
Entropy Threshold: 0.60 (requires order)
Stop Multiplier: 1.8× ATR (tighter stops)
Target Multiplier: 3.0R (modest targets)
Entry Mode: Single (one-shot entries)
Best For: Range-bound markets, low volatility, mean reversion
3. VolatilityBreakout (Policy 2):
Probability Threshold: 65% (moderate)
Entropy Threshold: 0.80 (accepts high entropy)
Stop Multiplier: 3.0× ATR (wider stops)
Target Multiplier: 6.0R (larger targets)
Entry Mode: Tiered (splits entry)
Best For: Compression breakouts, post-consolidation moves, gap opens
4. EntropyScalp (Policy 3):
Probability Threshold: 80% (very selective)
Entropy Threshold: 0.40 (requires extreme order)
Stop Multiplier: 1.5× ATR (tightest stops)
Target Multiplier: 2.5R (quick targets)
Entry Mode: Single
Best For: Low-volatility grinding moves, tight ranges, highly predictable patterns
5. DivergenceHunter (Policy 4):
Probability Threshold: 70% (quality-focused)
Entropy Threshold: 0.65 (balanced)
Stop Multiplier: 2.2× ATR (moderate stops)
Target Multiplier: 4.5R (balanced targets)
Entry Mode: Tiered
Best For: Divergence-confirmed reversals, exhaustion moves, trend climax
6. AdaptiveBlend (Policy 5):
Probability Threshold: 68% (balanced)
Entropy Threshold: 0.75 (balanced)
Stop Multiplier: 2.0× ATR (standard)
Target Multiplier: 4.0R (standard)
Entry Mode: Single
Best For: Mixed conditions, general trading, fallback when no clear regime
Policy Clustering (Advanced/Extreme Modes)
Policies are grouped into three clusters based on regime affinity:
Cluster 1 (Trending): AggressiveTrend, DivergenceHunter
High regime affinity (0.8): Performs well when ADX >25
Moderate vol affinity (0.6): Works in various volatility
Cluster 2 (Ranging): ConservativeRange, AdaptiveBlend
Low regime affinity (0.3): Better suited for ADX <20
Low vol affinity (0.4): Optimized for calm markets
Cluster 3 (Breakout): VolatilityBreakout
Moderate regime affinity (0.6): Works in multiple regimes
High vol affinity (0.9): Requires high volatility for optimal characteristics
Hierarchical Selection Process:
Calculate cluster scores based on current regime and volatility
Select best-matching cluster
Run UCB selection within chosen cluster
Apply momentum boost/penalty
This two-stage process reduces learning time - instead of choosing among 6 policies from scratch, system first narrows to 1-2 policies per cluster, then optimizes within cluster.
Risk Management & Position Sizing
Dynamic Kelly Criterion Sizing (Optional)
Traditional Fixed Sizing Challenge:
Using the same position size for all signal probabilities may be suboptimal. Higher-probability signals could justify larger positions, lower-probability signals smaller positions.
Kelly Formula:
f = (p × b - q) / b
Where:
p = win probability (from signal score)
q = loss probability (1 - p)
b = win/loss ratio (average_win / average_loss)
f = fraction of capital to risk
RPD Implementation:
Uses Fractional Kelly (1/4 Kelly default) for safety. Full Kelly is theoretically optimal but can recommend large position sizes. Fractional Kelly reduces volatility while maintaining adaptive sizing benefits.
Enhancements:
Probability Bonus: Normalize(prob, 65, 95) × 0.5 multiplier
Divergence Bonus: Additional sizing on divergence signals
Regime Bonus: Additional sizing during strong trends (ADX >30)
Momentum Adjustment: Hot policies receive sizing boost, cold policies receive reduction
Safety Rails:
Minimum: 1 contract (floor)
Maximum: User-defined cap (default 10 contracts)
Portfolio Heat: Max total risk across all positions (default 4% equity)
Multi-Mode Stop Loss System
ATR Mode (Default):
Stop = entry ± (ATR × base_mult × policy_mult)
Consistent risk sizing
Ignores market structure
Best for: Futures, forex, algorithmic trading
Structural Mode:
Finds swing low (long) or high (short) over last 20 bars
Identifies fractal pivots within lookback
Places stop below/above structure + buffer (0.1× ATR)
Best for: Stocks, instruments that respect structure
Hybrid Mode (Intelligent):
Attempts structural stop first
Falls back to ATR if:
Structural level is invalid (beyond entry)
Structural stop >2× ATR away (too wide)
Best for: Mixed instruments, adaptability
Dynamic Adjustments:
Breakeven: Move stop to entry + 1 tick after 1.0R profit
Trailing: Trail stop 0.8R behind price after 1.5R profit
Timeout: Force close after 30 bars (optional)
Tiered Entry System
Challenge: Equal sizing on all signals may not optimize capital allocation relative to signal quality.
Solution:
Tier 1 (40% of size): Enters immediately on all signals
Tier 2 (60% of size): Enters only if probability ≥ Tier 2 trigger (default 75%)
Example:
Calculated optimal size: 10 contracts
Signal probability: 72%
Tier 2 trigger: 75%
Result: Enter 4 contracts only (Tier 1)
Same signal at 80% probability
Result: Enter 10 contracts (4 Tier 1 + 6 Tier 2)
Effect: Automatically scales size to signal quality, optimizing capital allocation.
Performance Optimization & Learning Curve
Warmup Phase (First 50 Trades)
Purpose: Ensure all policies get tested before system focuses on preferred strategies.
Modifications During Warmup:
Probability thresholds reduced 20% (65% becomes 52%)
Entropy thresholds increased 20% (more permissive)
Exploration rate stays high (30%)
Confidence width (α) doubled (more exploration)
Why This Matters:
Without warmup, system might commit to early-performing policy without testing alternatives. Warmup forces thorough exploration before focusing on best-performing strategies.
Curriculum Learning
Phase 1 (Trades 1-50): Exploration
Warmup active
All policies tested
High exploration (30%)
Learning fundamental patterns
Phase 2 (Trades 50-100): Refinement
Warmup ended, thresholds normalize
Exploration decaying (30% → 15%)
Policy preferences emerging
Meta-learning optimizing
Phase 3 (Trades 100-200): Specialization
Exploration low (15% → 8%)
Clear policy preferences established
Momentum tracking fully active
System focusing on learned patterns
Phase 4 (Trades 200+): Maturity
Exploration minimal (8% → 5%)
Regime-policy relationships learned
Auto-adaptation to market shifts
Stable performance expected
Convergence Indicators
System is learning well when:
Policy switch rate decreasing over time (initially ~50%, should drop to <20%)
Exploration rate decaying smoothly (30% → 5%)
One or two policies emerge with >50% selection frequency
Performance metrics stabilizing over time
Consistent behavior in similar market conditions
System may need adjustment when:
Policy switch rate >40% after 100 trades (excessive exploration)
Exploration rate not decaying (parameter issue)
All policies showing similar selection (not differentiating)
Performance declining despite relaxed thresholds (underlying signal issue)
Highly erratic behavior after learning phase
Advanced Features
Attention Mechanism (Extreme Mode)
Challenge: Not all features are equally important. Trading hour might matter more than price-volume correlation, but standard approaches treat them equally.
Solution:
Each RFF dimension has an importance weight . After each trade:
Calculate correlation: sign(feature - 0.5) × sign(reward)
Update importance: importance += correlation × 0.01
Clamp to range
Effect: Important features get amplified in RFF transformation, less important features get suppressed. System learns which features correlate with successful outcomes.
Temporal Context (Extreme Mode)
Challenge: Current market state alone may be incomplete. Historical context (was volatility rising or falling?) provides additional information.
Solution:
Includes 3-period historical context with exponential decay (0.85):
Current features (weight 1.0)
1 bar ago (weight 0.85)
2 bars ago (weight 0.72)
Effect: Captures momentum and acceleration of market features. System learns patterns like "rising volatility with falling entropy" that may precede significant moves.
Transfer Learning via Episodic Memory
Short-Term Memory (STM):
Last 20 trades
Fast adaptation to immediate regime
High learning rate
Long-Term Memory (LTM):
Condensed historical patterns
Preserved knowledge from past regimes
Low learning rate
Transfer Mechanism:
When STM fills (20 trades), patterns consolidated into LTM . When similar regime recurs later, LTM provides faster adaptation than starting from scratch.
Practical Implementation Guide - Recommended Settings by Instrument
Futures (ES, NQ, CL):
Adaptive Period: 20-25
ML Mode: Advanced
RFF Dimensions: 16
Policies: 6
Base Risk: 1.5%
Stop Mode: ATR or Hybrid
Timeframe: 5-15 min
Forex Majors (EURUSD, GBPUSD):
Adaptive Period: 25-30
ML Mode: Advanced
RFF Dimensions: 16
Policies: 6
Base Risk: 1.0-1.5%
Stop Mode: ATR
Timeframe: 5-30 min
Cryptocurrency (BTC, ETH):
Adaptive Period: 20-25
ML Mode: Extreme (handles non-stationarity)
RFF Dimensions: 32 (captures complexity)
Policies: 6
Base Risk: 1.0% (volatility consideration)
Stop Mode: Hybrid
Timeframe: 15 min - 4 hr
Stocks (Large Cap):
Adaptive Period: 25-30
ML Mode: Advanced
RFF Dimensions: 16
Policies: 5-6
Base Risk: 1.5-2.0%
Stop Mode: Structural or Hybrid
Timeframe: 15 min - Daily
Scaling Strategy
Phase 1 (Testing - First 50 Trades):
Max Contracts: 1-2
Goal: Validate system on your instrument
Monitor: Performance stabilization, learning progress
Phase 2 (Validation - Trades 50-100):
Max Contracts: 2-3
Goal: Confirm learning convergence
Monitor: Policy stability, exploration decay
Phase 3 (Scaling - Trades 100-200):
Max Contracts: 3-5
Enable: Kelly sizing (1/4 Kelly)
Goal: Optimize capital efficiency
Monitor: Risk-adjusted returns
Phase 4 (Full Deployment - Trades 200+):
Max Contracts: 5-10
Enable: Full momentum tracking
Goal: Sustained consistent performance
Monitor: Ongoing adaptation quality
Limitations & Disclaimers
Statistical Limitations
Learning Sample Size: System requires minimum 50-100 trades for basic convergence, 200+ trades for robust learning. Early performance (first 50 trades) may not reflect mature system behavior.
Non-Stationarity Risk: Markets change over time. A system trained on one market regime may need time to adapt when conditions shift (typically 30-50 trades for adjustment).
Overfitting Possibility: With 16-32 RFF dimensions and 6 policies, system has substantial parameter space. Small sample sizes (<200 trades) increase overfitting risk. Mitigated by regularization (λ) and fractional Kelly sizing.
Technical Limitations
Computational Complexity: Extreme mode with 32 RFF dimensions, 6 policies, and full RL stack requires significant computation. May perform slowly on lower-end systems or with many other indicators loaded.
Pine Script Constraints:
No true matrix inversion (uses diagonal approximation for LinUCB)
No cryptographic RNG (uses market data as entropy)
No proper random number generation for RFF (uses deterministic pseudo-random)
These approximations reduce mathematical precision compared to academic implementations but remain functional for trading applications.
Data Requirements: Needs clean OHLCV data. Missing bars, gaps, or low liquidity (<100k daily volume) can degrade signal quality.
Forward-Looking Bias Disclaimer
Reward Calculation Uses Future Data: The RL system evaluates trades using an 8-bar forward-looking window. This means when a position enters at bar 100, the reward calculation considers price movement through bar 108.
Why This is Disclosed:
Entry signals do NOT look ahead - decisions use only data up to entry bar
Forward data used for learning only, not signal generation
In live trading, system learns identically as bars unfold in real-time
Simulates natural learning process (outcomes are only known after trades complete)
Implication: Backtested metrics reflect this 8-bar evaluation window. Live performance may vary if:
- Positions held longer than 8 bars
- Slippage/commissions differ from backtest settings
- Market microstructure changes (wider spreads, different execution quality)
Risk Warnings
No Guarantee of Profit: All trading involves substantial risk of loss. Machine learning systems can fail if market structure fundamentally changes or during unprecedented events.
Maximum Drawdown: With 1.5% base risk and 4% max total risk, expect potential drawdowns. Historical drawdowns do not predict future drawdowns. Extreme market conditions can exceed expectations.
Black Swan Events: System has not been tested under: flash crashes, trading halts, circuit breakers, major geopolitical shocks, or other extreme events. Such events can exceed stop losses and cause significant losses.
Leverage Risk: Futures and forex involve leverage. Adverse moves combined with leverage can result in losses exceeding initial investment. Use appropriate position sizing for your risk tolerance.
System Failures: Code bugs, broker API failures, internet outages, or exchange issues can prevent proper execution. Always monitor automated systems and maintain appropriate safeguards.
Appropriate Use
This System Is:
✅ A machine learning framework for adaptive strategy selection
✅ A signal generation system with probabilistic scoring
✅ A risk management system with dynamic sizing
✅ A learning system designed to adapt over time
This System Is NOT:
❌ A price prediction system (does not forecast exact prices)
❌ A guarantee of profits (can and will experience losses)
❌ A replacement for due diligence (requires monitoring and understanding)
❌ Suitable for complete beginners (requires understanding of ML concepts, risk management, and trading fundamentals)
Recommended Use:
Paper trade for 100 signals before risking capital
Start with minimal position sizing (1-2 contracts) regardless of calculated size
Monitor learning progress via dashboard
Scale gradually over several months only after consistent results
Combine with fundamental analysis and broader market context
Set account-level risk limits (e.g., maximum drawdown threshold)
Never risk more than you can afford to lose
What Makes This System Different
RPD implements academically-derived machine learning algorithms rather than simple mathematical calculations or optimization:
✅ LinUCB Contextual Bandits - Algorithm from WWW 2010 conference (Li et al.)
✅ Random Fourier Features - Kernel approximation from NIPS 2007 (Rahimi & Recht)
✅ Q-Learning, TD(λ), REINFORCE - Standard RL algorithms from Sutton & Barto textbook
✅ Meta-Learning - Learning rate adaptation based on feature correlation
✅ Online Learning - Real-time updates from streaming data
✅ Hierarchical Policies - Two-stage selection with clustering
✅ Momentum Tracking - Recent performance analysis for faster adaptation
✅ Attention Mechanism - Feature importance weighting
✅ Transfer Learning - Episodic memory consolidation
Key Differentiators:
Actually learns from trade outcomes (not just parameter optimization)
Updates model parameters in real-time (true online learning)
Adapts to changing market regimes (not static rules)
Improves over time through reinforcement learning
Implements published ML algorithms with proper citations
Conclusion
RPD Machine Learning represents a different approach from traditional technical analysis to adaptive, self-learning systems . Instead of manually optimizing parameters (which can overfit to historical data), RPD learns behavior patterns from actual trading outcomes in your specific market.
The combination of contextual bandits, reinforcement learning, random fourier features, hierarchical policy selection, and momentum tracking creates a multi-algorithm learning system designed to handle non-stationary markets better than static approaches.
After the initial learning phase (50-100 trades), the system achieves autonomous adaptation - automatically discovering which strategies work in current conditions and shifting allocation without human intervention. This represents an approach where systems adapt over time rather than remaining static.
Use responsibly. Paper trade extensively. Scale gradually. Understand that past performance does not guarantee future results and all trading involves risk of loss.
Taking you to school. — Dskyz, Trade with insight. Trade with anticipation.

RSI Bands [APIDEVs]RSI BANDS:
It is an exclusive product of ApiDevs , this indicator selectively integrates a series of highly advanced algorithms that aim to provide the trader with an effective and profitable trading system, based on a series of conditions that project the price direction with a reasonable probability.
This indicator bears the name of “RSI Bands” , this is because we have based this trading system on the “Relative Strength Index (RSI)” , the strength of this indicator is centennial and we at APIDEVs have decided to focus our efforts on the development of powerful tools based on the favorite indicators of the afternoon.
WHAT IT HAS INCORPORATED:
1. Exponential Moving Average (EMAs): The RSI Bands has, by default, a band composed of two moving averages of 10 and 55 exponential periods, which can be modified in the indicator menu.
• Possibility of changing the value of the EMAs.
• Function was enabled to change the color and transparency of the bands.
• Visual alerts SHORT (L) and LONG (L) were added when there is the crossing of the EMAS.
• Hull Moving Average (HMA) of 100 periods was also incorporated, also modifiable for those who wish to strengthen their visual analysis. (Disabled by default)
• We also add an Exponential Moving Average (EMA) of 200 periods to mark the trend. (Disabled by default).
2. A TR (Average True Range): This indicator has two main functions in the RSI Bands, the first is to mark the trend of the asset and the second is to establish a margin of safety in price volatility, that is, a maximum estimate of the setbacks without this representing a change in the direction of the price.
3. RSI (Relative Strength Index): It was visually incorporated into the RSI Bands, the graph is obtained on the right side and its purpose is to visually indicate where the price is with respect to the RSI PRO+ indicator, offering the following improvements :
• ALERT SYSTEM: THE RSI PRO+ has the ADX incorporated into its algorithm, which allows establishing a filter that will provide reliable inputs, represented by the LONG (L) and SHORT (S) signals.
• FILTER AGAINST TREND: The signals described above will be activated according to the crossing of the RSI above the 50 point, provided that the ADX agrees with the market direction.
• Possibility of deactivating this graphical representation.
4. ADX (Average Directional Index): The ADX in this indicator is intended to estimate the strength of the movement, it is present in each part of the code, either to indicate the strength of the market or to serve as a filter against trend. In the same way, we apply certain exclusive improvements for this indicator:
• It was established as default values of the ADX that the Level Range was 10 and the Level Trend 25. This significantly changes the behavior of this indicator, almost completely eliminating the zone of disinterest that was usually considered.
• A function was activated to paint the sails the color of the ADX.
5. ADX Ocillator: Yes, we developed a Wave oscillator type ADX and incorporated it into this strategy. From this indicator, which we recommend using in conjunction with the RSI Bands, we extracted the LONG (L) and SHORT (S) signals. The ADX Oscillator is the improved version of the traditional ADX as it offers the following improvements:
• Its interpretation is much simpler.
• Allows you to set entry and exit signals during the trend change and during the price path.
• It has an integrated alert system.
STRATEGY PANEL:
This panel is an exclusive creation of APIDEVs , and its purpose is to parameterize five conditionals based on the indicators that make up our RSI strategy, giving the trader an immediate vision of the status of the asset analyzed considering this strategy. That is, we decided to transfer our experience of using this indicator on a panel that will project the price trajectory visually. It has the following characteristics:
• It can be placed anywhere on the screen through the main menu of the indicator, it can even be deactivated.
• It can be resized, we designed this to adapt to all types of screens, including those of mobile phones.
• It has an upper panel called "Project" which will calculate the percentage probability that the price has to take a direction based on all the indicators incorporated into the strategy. Their values range from (+ 100%) to (-100%).
STRATEGY PANEL PARAMETERS:
1. EMAs : This panel has 2 variables:
• LONG : If the fast EMA is above the slow EMA.
• SHORT : If the fast EMA is below the slow EMA.
2. RSI : This panel has 3 variables:
• LONG : The RSI should be bullish (green) and above the 50 point.
• SHORT : The RSI should be bearish (red) and be below the 50 point.
• RANK: (Range)this condition is activated when there is no concordance with the RSI condition and its crossing.
3. ATR : This panel has 2 variables:
• LONG : When the price is above the ATR.
• SHORT : When the price is below the ATR.
4. ADX: This panel has 3 variables:
• LONG : The ADX is green. That is, the DI + is above the DI-.
• SHORT : The ADX is red. That is, the DI- is above the DI +.
• RANK : ADX is below point 10.
It also has a numerical value that indicates the value of the ADX and two texts indicating the strength of the trend:
• Trend (bullish or bearish).
• Strong trend (bullish or bearish).
5. OSC : This panel has 3 variables:
• LONG : The oscillator slopes upward and the built-in ADX is green.
• SHORT : The oscillator slopes downward and the built-in ADX is red.
• RANK : The oscillator slopes downward and the built-in ADX is green and the opposite. In short, there is no coherence in the movement of the oscillator and the projection of the ADX.

Auto Option Screener Pro Multi-Symbol Technical Dashboard# **Auto Option Screener Pro – Multi-Symbol Technical Dashboard**
**Real-time options screening with 15+ indicators, custom filters, and institutional-grade analytics**
***
## 📊 **What This Indicator Does**
**Auto Option Screener Pro** is a comprehensive **multi-symbol technical analysis dashboard** designed specifically for **NSE options traders**. It simultaneously monitors **30 symbols** (calls/puts) and displays real-time data for **15+ professional indicators** in a sortable, filterable table format.
Instead of flipping between charts, you get **instant visibility** across your entire watchlist: momentum, trend strength, volatility, volume analysis, and gap detection—all in one screen.
***
## 🎯 **Key Features**
### **Multi-Symbol Monitoring**
- Track **30 symbols simultaneously** (calls + puts)
- Toggle symbols on/off with checkboxes
- Optimized for **NSE options** (but works with any symbol)
- Lightweight code using matrix operations for speed
### **15+ Built-In Indicators**
- **RSI** (Relative Strength Index) – Overbought/oversold detection
- **TSI** (True Strength Index) – Double-smoothed momentum
- **ADX** (Average Directional Index) – Trend strength measurement
- **SuperTrend** – Trend-following with ATR-based stops
- **MACD** – Crossover and momentum signals
- **CMF** (Chaikin Money Flow) – Institutional money flow tracker
- **OBV** (On-Balance Volume) – Volume-price relationship
- **BB Power** (Bull/Bear Power) – Elder Ray indicator
- **Choppiness Index** – Trend vs. chop detection
- **∆VWAP** – Deviation from VWAP (value/trading)
- **Relative Volume** – Surge detection vs. average
- **RDX Score** – Custom ADX+RSI combo score (-5 to +5)
- **ATR Volatility** – Volatility ranking (Low/Medium/High)
- **Gap Detection** – Gap Up/Down with percentage
- **Price Change** – Real-time premium movement
### **Smart Filtering System**
- Filter any column by **custom range** (e.g., RSI 30-70, ADX > 25)
- **Column-specific thresholds** for each indicator
- **Toggle filters on/off** with one click
- Example: Show only options where RSI < 35 AND ADX > 30
### **Visual Intelligence**
- **Color-coded cells**: Green (bullish), Red (bearish), Gray (neutral)
- **ATR Volatility labels**: Lo/Md/Hi with color coding
- **Gap detection**: UP/DN/NO with directional colors
- **RDX Score**: -5 to +5 visual scoring system
- **Compact dashboard**: 18 columns × 40 rows maximum
### **Customizable Dashboard**
- **9 position options**: Top/Bottom/Middle + Left/Center/Right
- **Adjustable font sizes**: Small, Normal, Large, Huge
- **Theme-aware**: Works on dark/light TradingView themes
- **Auto-clearing**: Refreshes every bar for accuracy
---
## ⚙️ **How to Set Up**
### **Step 1: Add Your Symbols**
1. Click **Settings** (gear icon) on the indicator
2. Scroll to **Symbols** section
3. **Enable/disable symbols** using checkboxes (u01-u30)
4. **Replace default symbols** with your preferred options:
- Format: `NSE:SYMBOLYYMMDDCPRICE`
- Example: `NSE:NIFTY251230C25900`
### **Step 2: Configure Filters (Optional)**
1. Go to **Filter** section
2. **Enable filter** by checking "Filter" box
3. Select **Column** to filter (Price, RSI, TSI, ADX, SuperTrend, etc.)
4. Set **From** and **To** values
5. Only symbols meeting criteria will display
### **Step 3: Adjust Indicator Settings**
- **RSI Length**: Default 14 (overbought 65, oversold 35)
- **TSI Lengths**: Long 25, Short 13 (thresholds ±25)
- **ADX Smoothing**: Default 14 (threshold 30)
- **SuperTrend**: ATR 10, Factor 3.0
- **CMF**: Length 20 (thresholds ±0.3)
- **Choppiness**: Period 14 (trending <38.2, choppy >61.8)
- **RDX ADX**: Length 14, Threshold 14
- **ATR Volatility**: Period 14 (High >1.5%, Medium >1.0%)
### **Step 4: Position Dashboard**
- Choose **Dashboard Position** from dropdown
- Recommended: **Top right** or **Top left** for minimal chart overlap
- Adjust **font size** for readability
### **Step 5: Set Alerts (Optional)**
- Create alerts for individual symbols
- Use **combined conditions** from the dashboard
- Example: Alert when RDX Score = 5 AND ADX > 30
***
## 📈 **Indicator Guide**
### **Column Explanations**
| Column | What It Shows | How to Read |
|--------|---------------|-------------|
| **NnSexOpt** | Symbol name | Gray background |
| **Price** | Current premium | Always shown |
| **RSI** | Momentum (0-100) | >65 green (OB), <35 red (OS) |
| **TSI** | True strength | >25 red (OB), <-25 green (OS) |
| **ADX** | Trend strength | >30 green (strong trend) |
| **Sptrd** | SuperTrend | "Up" green, "Down" red |
| **MACD** | MACD trend | 1=uptrend green, -1=downtrend red |
| **CMF** | Money flow | >0.3 green, <-0.3 red |
| **OBV** | On-Balance Volume (Cr) | Positive/negative flow |
| **OHL** | Open=High/Low | "OH" red (bearish), "OL" green (bullish) |
| **BB+** | Bull Power | Positive green, negative red |
| **Chop** | Choppiness Index | <38.2 green (trending), >61.8 red (chop) |
| **∆VWAP** | VWAP deviation | Above green, below red |
| **RVol** | Relative volume | >1.5 green (surge) |
| **RDX** | ADX+RSI score | -5 to +5, color-coded |
| **ATR%** | Volatility % | Actual percentage value |
| **Vol** | Volatility label | Lo/Md/Hi with color |
| **Gap** | Gap type/size | UP/DN green/red + % |
***
## 🎨 **Color Coding**
- **Green Cells**: Bullish signals (overbought, uptrend, positive flow)
- **Red Cells**: Bearish signals (oversold, downtrend, negative flow)
- **Gray Cells**: Neutral or no signal
- **White Text**: All values for readability
- **Gray Header**: Row separators for scannability
---
## 🔧 **Advanced Usage Tips**
### **Finding High-Probability Setups**
1. **Bullish Combo**: RDX > 0 + ADX > 30 + ∆VWAP > 0 + CMF > 0.3
2. **Bearish Combo**: RDX < 0 + ADX > 30 + ∆VWAP < 0 + CMF < -0.3
3. **Momentum Surge**: RSI crossing 50 + RVol > 1.5 + ATR Volatility = Hi
4. **Trend Confirmation**: ADX > 30 + Chop < 38.2 + SuperTrend = Up
### **Avoiding False Signals**
- **Choppy Markets**: Skip when Chop > 61.8
- **Low Volume**: Ignore if RVol < 1.0
- **Weak Trend**: ADX < 20 = no trend, avoid directional trades
### **Options-Specific Strategies**
- **Premium Buyers**: Look for low RVol + RDX turning positive
- **Premium Sellers**: Target high RVol + Chop > 61.8 (rangebound)
- **Expiry Day**: Focus on Gap column + ∆VWAP for mean reversion
---
## ⚡ **Performance Notes**
- **Optimized for 30 symbols**: Uses matrix operations for speed
- **Updates on bar close**: Minimal repainting
- **Works on any timeframe**: 1m to 1D
- **NSE options tested**: Compatible with Indian options format
- **RAM usage**: ~50MB for 30 symbols on 1m chart
---
## 🎯 **Supported Instruments**
**Primary Use Case:**
- **NSE Options**: NIFTY, BANKNIFTY, FINNIFTY, MIDCPNIFTY, stock options
**Also Works With:**
- **Equity cash**: NSE, BSE stocks
- **Futures**: NIFTY, BANKNIFTY futures
- **Global instruments**: Any TradingView-supported symbol
***
## ⚠️ **Disclaimer & Risk Warning**
**IMPORTANT**: This indicator is for **educational and informational purposes only**.
- Options trading involves **substantial risk of loss**
- Past performance does not guarantee future results
- **Test thoroughly** on paper trading before live use
- Verify **liquidity and spreads** before trading
- **No signals are guaranteed**—use with proper risk management
- Creator is **not responsible** for any trading losses
**Always consult a financial advisor** before making trading decisions.
***
## 📝 **Version History**
**v1.0 (Current)**
- Initial release
- 30-symbol multi-screener
- 15+ indicators integration
- Custom filter system
- Gap detection
- ATR volatility labeling
- RDX scoring system
***
## 💬 **Feedback & Support**
Found this screener helpful? Please:
- ⭐ **Leave a rating** on TradingView
- 💬 **Share your strategies** in comments
- 📊 **Post chart ideas** using this indicator
- 🔔 **Follow for updates**
**Questions?** Drop a comment below—I'll help you optimize your settings!
***
**Tags**: Options Screener, NSE Options, Multi-Symbol, Technical Analysis, RSI, ADX, SuperTrend, MACD, CMF, VWAP, Volatility, Gap Detection, RDX Score, Intraday Trading, Options Trading
***
**Legal**: This tool does not constitute financial advice. All trading decisions are your responsibility. Always use risk capital you can afford to lose.

Trend Catch STFR - whipsaw Reduced### Summary of the Setup
This trading system combines **SuperTrend** (a trend-following indicator based on ATR for dynamic support/resistance), **Range Filter** (a smoothed median of the last 100 candles to identify price position relative to a baseline), and filters using **VIX Proxy** (a volatility measure: (14-period ATR / 14-period SMA of Close) × 100) and **ADX** (Average Directional Index for trend strength). It's designed for trend trading with volatility safeguards.
- **Entries**: Triggered only in "tradeable" markets (VIX Proxy ≥ 15 OR ADX ≥ 20) when SuperTrend aligns with direction (green for long, red for short), price crosses the Range Filter median accordingly, and you're not already in that position.
- **Exits**: Purely price-based—exit when SuperTrend flips or price crosses back over the Range Filter median. No forced exits from low volatility/trend.
- **No Trade Zone**: Blocks new entries if both VIX Proxy < 15 AND ADX < 20, but doesn't affect open positions.
- **Overall Goal**: Enter trends with confirmed strength/volatility, ride them via price action, and avoid ranging/choppy markets for new trades.
This creates a filtered trend-following strategy that prioritizes quality entries while letting winners run.
### Advantages
- **Reduces Noise in Entries**: The VIX Proxy and ADX filters ensure trades only in volatile or strongly trending conditions, avoiding low-momentum periods that often lead to false signals.
- **Lets Winners Run**: Exits based solely on price reversal (SuperTrend or Range Filter) allow positions to stay open during temporary lulls in volatility/trend, potentially capturing longer moves.
- **Simple and Balanced**: Combines trend (SuperTrend/ADX), range (Filter), and volatility (VIX Proxy) without overcomplicating—easy to backtest and adapt to assets like stocks, forex, or crypto.
- **Adaptable to Markets**: The "OR" logic for VIX/ADX provides flexibility (e.g., enters volatile sideways markets if ADX is low, or steady trends if VIX is low).
- **Risk Control**: Implicitly limits exposure by blocking entries in calm markets, which can preserve capital during uncertainty.
### Disadvantages
- **Whipsaws in Choppy Markets**: As you noted, SuperTrend can flip frequently in ranging conditions, leading to quick entries/exits and small losses, especially if the Range Filter isn't smoothing enough noise.
- **Missed Opportunities**: Strict filters (e.g., requiring VIX ≥ 15 or ADX ≥ 20) might skip early-stage trends or low-volatility grinds, reducing trade frequency and potential profits in quiet bull/bear markets.
- **Lagging Exits**: Relying only on price flips means you might hold losing trades longer if volatility drops without a clear reversal, increasing drawdowns.
- **Parameter Sensitivity**: Values like VIX 15, ADX 20, or Range Filter's 100-candle lookback need tuning per asset/timeframe; poor choices could amplify whipsaws or over-filter.
- **No Built-in Risk Management**: Lacks explicit stops/targets, so it relies on user-added rules (e.g., ATR-based stops), which could lead to oversized losses if not implemented.
### How to Use It
This system can be implemented in platforms like TradingView (via Pine Script), Python (e.g., with TA-Lib or Pandas), or MT4/5. Here's a step-by-step guide, assuming TradingView for simplicity—adapt as needed. (If coding in Python, use libraries like pandas_ta for indicators.)
1. **Set Up Indicators**:
- Add SuperTrend (default: ATR period 10, multiplier 3—adjust as suggested in prior tweaks).
- Create Range Filter: Use a 100-period SMA of (high + low)/2, smoothed (e.g., via EMA if desired).
- Calculate VIX Proxy: Custom script for (ATR(14) / SMA(close, 14)) * 100.
- Add ADX (period 14, standard).
2. **Define Rules in Code/Script**:
- **Long Entry**: If SuperTrend direction < 0 (green), close > RangeFilterMedian, (VIX Proxy ≥ 15 OR ADX ≥ 20), and not already long—buy on bar close.
- **Short Entry**: If SuperTrend direction > 0 (red), close < RangeFilterMedian, (VIX Proxy ≥ 15 OR ADX ≥ 20), and not already short—sell short.
- **Exit Long**: If in long and (SuperTrend > 0 OR close < RangeFilterMedian)—sell.
- **Exit Short**: If in short and (SuperTrend < 0 OR close > RangeFilterMedian)—cover.
- Monitor No Trade Zone visually (e.g., plot yellow background when VIX < 15 AND ADX < 20).
3. **Backtest and Optimize**:
- Use historical data on your asset (e.g., SPY on 1H chart).
- Test metrics: Win rate, profit factor, max drawdown. Adjust thresholds (e.g., ADX to 25) to reduce whipsaws.
- Forward-test on demo account to validate.
4. **Live Trading**:
- Apply to a chart, set alerts for entries/exits.
- Add risk rules: Position size 1-2% of capital, stop-loss at SuperTrend line.
- Monitor manually or automate via bots—avoid overtrading; use on trending assets.
For the adjustments I suggested earlier (e.g., ADX 25, 2-bar confirmation), integrate them into entries only—test one at a time to isolate improvements. If whipsaws persist, combine 2-3 tweaks.

Ultimate Scalping Tool[BullByte]Overview
The Ultimate Scalping Tool is an open-source TradingView indicator built for scalpers and short-term traders released under the Mozilla Public License 2.0. It uses a custom Quantum Flux Candle (QFC) oscillator to combine multiple market forces into one visual signal. In plain terms, the script reads momentum, trend strength, volatility, and volume together and plots a special “candlestick” each bar (the QFC) that reflects the overall market bias. This unified view makes it easier to spot entries and exits: the tool labels signals as Strong Buy/Sell, Pullback (a brief retracement in a trend), Early Entry, or Exit Warning . It also provides color-coded alerts and a small dashboard of metrics. In practice, traders see green/red oscillator bars and symbols on the chart when conditions align, helping them scalp or trend-follow without reading multiple separate indicators.
Core Components
Quantum Flux Candle (QFC) Construction
The QFC is the heart of the indicator. Rather than using raw price, it creates a candlestick-like bar from the underlying oscillator values. Each QFC bar has an “open,” “high/low,” and “close” derived from calculated momentum and volatility inputs for that period . In effect, this turns the oscillator into intuitive candle patterns so traders can recognize momentum shifts visually. (For comparison, note that Heikin-Ashi candles “have a smoother look because take an average of the movement”. The QFC instead represents exact oscillator readings, so it reflects true momentum changes without hiding price action.) Colors of QFC bars change dynamically (e.g. green for bullish momentum, red for bearish) to highlight shifts. This is the first open-source QFC oscillator that dynamically weights four non-correlated indicators with moving thresholds, which makes it a unique indicator on its own.
Oscillator Normalization & Adaptive Weights
The script normalizes its oscillator to a fixed scale (for example, a 0–100 range much like the RSI) so that various inputs can be compared fairly. It then applies adaptive weighting: the relative influence of trend, momentum, volatility or volume signals is automatically adjusted based on current market conditions. For instance, in very volatile markets the script might weight volatility more heavily, or in a strong trend it might give extra weight to trend direction. Normalizing data and adjusting weights helps keep the QFC sensitive but stable (normalization ensures all inputs fit a common scale).
Trend/Momentum/Volume/Volatility Fusion
Unlike a typical single-factor oscillator, the QFC oscillator fuses four aspects at once. It may compute, for example, a trend indicator (such as an ADX or moving average slope), a momentum measure (like RSI or Rate-of-Change), a volume-based pressure (similar to MFI/OBV), and a volatility measure (like ATR) . These different values are combined into one composite oscillator. This “multi-dimensional” approach follows best practices of using non-correlated indicators (trend, momentum, volume, volatility) for confirmation. By encoding all these signals in one line, a high QFC reading means that trend, momentum, and volume are all aligned, whereas a neutral reading might mean mixed conditions. This gives traders a comprehensive picture of market strength.
Signal Classification
The script interprets the QFC oscillator to label trades. For example:
• Strong Buy/Sell : Triggered when the oscillator crosses a high-confidence threshold (e.g. breaks clearly above zero with strong slope), indicating a well-confirmed move. This is like seeing a big green/red QFC candle aligned with the trend.
• Pullbacks : Identified when the trend is up but momentum dips briefly. A Pullback Buy appears if the overall trend is bullish but the oscillator has a short retracement – a typical buying opportunity in an uptrend. (A pullback is “a brief decline or pause in a generally upward price trend”.)
• Early Buy/Sell : Marks an initial swing in the oscillator suggesting a possible new trend, before it is fully confirmed. It’s a hint of momentum building (an early-warning signal), not as strong as the confirmed “Strong” signal.
• Exit Warnings : Issued when momentum peaks or reverses. For instance, if the QFC bars reach a high and start turning red/green opposite, the indicator warns that the move may be ending. In other words, a Momentum Peak is the point of maximum strength after which weakness may follow.
These categories correspond to typical trading concepts: Pullback (temporary reversal in an uptrend), Early Buy (an initial bullish cross), Strong Buy (confirmed bullish momentum), and Momentum Peak (peak oscillator value suggesting exhaustion).
Filters (DI Reversal, Dynamic Thresholds, HTF EMA/ADX)
Extra filters help avoid bad trades. A DI Reversal filter uses the +DI/–DI lines (from the ADX system) to require that the trend direction confirms the signal . For example, it might ignore a buy signal if the +DI is still below –DI. Dynamic Thresholds adjust signal levels on-the-fly: rather than fixed “overbought” lines, they move with volatility so signals happen under appropriate market stress. An optional High-Timeframe EMA or ADX filter adds a check against a larger timeframe trend: for instance, only taking a trade if price is above the weekly EMA or if weekly ADX shows a strong trend. (Notably, the ADX is “a technical indicator used by traders to determine the strength of a price trend”, so requiring a high-timeframe ADX avoids trading against the bigger trend.)
Dashboard Metrics & Color Logic
The Dashboard in the Ultimate Scalping Tool (UST) serves as a centralized information hub, providing traders with real-time insights into market conditions, trend strength, momentum, volume pressure, and trade signals. It is highly customizable, allowing users to adjust its appearance and content based on their preferences.
1. Dashboard Layout & Customization
Short vs. Extended Mode : Users can toggle between a compact view (9 rows) and an extended view (13 rows) via the `Short Dashboard` input.
Text Size Options : The dashboard supports three text sizes— Tiny, Small, and Normal —adjustable via the `Dashboard Text Size` input.
Positioning : The dashboard is positioned in the top-right corner by default but can be moved if modified in the script.
2. Key Metrics Displayed
The dashboard presents critical trading metrics in a structured table format:
Trend (TF) : Indicates the current trend direction (Strong Bullish, Moderate Bullish, Sideways, Moderate Bearish, Strong Bearish) based on normalized trend strength (normTrend) .
Momentum (TF) : Displays momentum status (Strong Bullish/Bearish or Neutral) derived from the oscillator's position relative to dynamic thresholds.
Volume (CMF) : Shows buying/selling pressure levels (Very High Buying, High Selling, Neutral, etc.) based on the Chaikin Money Flow (CMF) indicator.
Basic & Advanced Signals:
Basic Signal : Provides simple trade signals (Strong Buy, Strong Sell, Pullback Buy, Pullback Sell, No Trade).
Advanced Signal : Offers nuanced signals (Early Buy/Sell, Momentum Peak, Weakening Momentum, etc.) with color-coded alerts.
RSI : Displays the Relative Strength Index (RSI) value, colored based on overbought (>70), oversold (<30), or neutral conditions.
HTF Filter : Indicates the higher timeframe trend status (Bullish, Bearish, Neutral) when using the Leading HTF Filter.
VWAP : Shows the V olume-Weighted Average Price and whether the current price is above (bullish) or below (bearish) it.
ADX : Displays the Average Directional Index (ADX) value, with color highlighting whether it is rising (green) or falling (red).
Market Mode : Shows the selected market type (Crypto, Stocks, Options, Forex, Custom).
Regime : Indicates volatility conditions (High, Low, Moderate) based on the **ATR ratio**.
3. Filters Status Panel
A secondary panel displays the status of active filters, helping traders quickly assess which conditions are influencing signals:
- DI Reversal Filter: On/Off (confirms reversals before generating signals).
- Dynamic Thresholds: On/Off (adjusts buy/sell thresholds based on volatility).
- Adaptive Weighting: On/Off (auto-adjusts oscillator weights for trend/momentum/volatility).
- Early Signal: On/Off (enables early momentum-based signals).
- Leading HTF Filter: On/Off (applies higher timeframe trend confirmation).
4. Visual Enhancements
Color-Coded Cells : Each metric is color-coded (green for bullish, red for bearish, gray for neutral) for quick interpretation.
Dynamic Background : The dashboard background adapts to market conditions (bullish/bearish/neutral) based on ADX and DI trends.
Customizable Reference Lines : Users can enable/disable fixed reference lines for the oscillator.
How It(QFC) Differs from Traditional Indicators
Quantum Flux Candle (QFC) Versus Heikin-Ashi
Heikin-Ashi candles smooth price by averaging (HA’s open/close use averages) so they show trend clearly but hide true price (the current HA bar’s close is not the real price). QFC candles are different: they are oscillator values, not price averages . A Heikin-Ashi chart “has a smoother look because it is essentially taking an average of the movement”, which can cause lag. The QFC instead shows the raw combined momentum each bar, allowing faster recognition of shifts. In short, HA is a smoothed price chart; QFC is a momentum-based chart.
Versus Standard Oscillators
Common oscillators like RSI or MACD use fixed formulas on price (or price+volume). For example, RSI “compares gains and losses and normalizes this value on a scale from 0 to 100”, reflecting pure price momentum. MFI is similar but adds volume. These indicators each show one dimension: momentum or volume. The Ultimate Scalping Tool’s QFC goes further by integrating trend strength and volatility too. In practice, this means a move that looks strong on RSI might be downplayed by low volume or weak trend in QFC. As one source notes, using multiple non-correlated indicators (trend, momentum, volume, volatility) provides a more complete market picture. The QFC’s multi-factor fusion is unique – it is effectively a multi-dimensional oscillator rather than a traditional single-input one.
Signal Style
Traditional oscillators often use crossovers (RSI crossing 50) or fixed zones (MACD above zero) for signals. The Ultimate Scalping Tool’s signals are custom-classified: it explicitly labels pullbacks, early entries, and strong moves. These terms go beyond a typical indicator’s generic “buy”/“sell.” In other words, it packages a strategy around the oscillator, which traders can backtest or observe without reading code.
Key Term Definitions
• Pullback : A short-term dip or consolidation in an uptrend. In this script, a Pullback Buy appears when price is generally rising but shows a brief retracement. (As defined by Investopedia, a pullback is “a brief decline or pause in a generally upward price trend”.)
• Early Buy/Sell : An initial or tentative entry signal. It means the oscillator first starts turning positive (or negative) before a full trend has developed. It’s an early indication that a trend might be starting.
• Strong Buy/Sell : A confident entry signal when multiple conditions align. This label is used when momentum is already strong and confirmed by trend/volume filters, offering a higher-probability trade.
• Momentum Peak : The point where bullish (or bearish) momentum reaches its maximum before weakening. When the oscillator value stops rising (or falling) and begins to reverse, the script flags it as a peak – signaling that the current move could be overextended.
What is the Flux MA?
The Flux MA (Moving Average) is an Exponential Moving Average (EMA) applied to a normalized oscillator, referred to as FM . Its purpose is to smooth out the fluctuations of the oscillator, providing a clearer picture of the underlying trend direction and strength. Think of it as a dynamic baseline that the oscillator moves above or below, helping you determine whether the market is trending bullish or bearish.
How it’s calculated (Flux MA):
1.The oscillator is normalized (scaled to a range, typically between 0 and 1, using a default scale factor of 100.0).
2.An EMA is applied to this normalized value (FM) over a user-defined period (default is 10 periods).
3.The result is rescaled back to the oscillator’s original range for plotting.
Why it matters : The Flux MA acts like a support or resistance level for the oscillator, making it easier to spot trend shifts.
Color of the Flux Candle
The Quantum Flux Candle visualizes the normalized oscillator (FM) as candlesticks, with colors that indicate specific market conditions based on the relationship between the FM and the Flux MA. Here’s what each color means:
• Green : The FM is above the Flux MA, signaling bullish momentum. This suggests the market is trending upward.
• Red : The FM is below the Flux MA, signaling bearish momentum. This suggests the market is trending downward.
• Yellow : Indicates strong buy conditions (e.g., a "Strong Buy" signal combined with a positive trend). This is a high-confidence signal to go long.
• Purple : Indicates strong sell conditions (e.g., a "Strong Sell" signal combined with a negative trend). This is a high-confidence signal to go short.
The candle mode shows the oscillator’s open, high, low, and close values for each period, similar to price candlesticks, but it’s the color that provides the quick visual cue for trading decisions.
How to Trade the Flux MA with Respect to the Candle
Trading with the Flux MA and Quantum Flux Candle involves using the MA as a trend indicator and the candle colors as entry and exit signals. Here’s a step-by-step guide:
1. Identify the Trend Direction
• Bullish Trend : The Flux Candle is green and positioned above the Flux MA. This indicates upward momentum.
• Bearish Trend : The Flux Candle is red and positioned below the Flux MA. This indicates downward momentum.
The Flux MA serves as the reference line—candles above it suggest buying pressure, while candles below it suggest selling pressure.
2. Interpret Candle Colors for Trade Signals
• Green Candle : General bullish momentum. Consider entering or holding a long position.
• Red Candle : General bearish momentum. Consider entering or holding a short position.
• Yellow Candle : A strong buy signal. This is an ideal time to enter a long trade.
• Purple Candle : A strong sell signal. This is an ideal time to enter a short trade.
3. Enter Trades Based on Crossovers and Colors
• Long Entry : Enter a buy position when the Flux Candle turns green and crosses above the Flux MA. If it turns yellow, this is an even stronger signal to go long.
• Short Entry : Enter a sell position when the Flux Candle turns red and crosses below the Flux MA. If it turns purple, this is an even stronger signal to go short.
4. Exit Trades
• Exit Long : Close your buy position when the Flux Candle turns red or crosses below the Flux MA, indicating the bullish trend may be reversing.
• Exit Short : Close your sell position when the Flux Candle turns green or crosses above the Flux MA, indicating the bearish trend may be reversing.
•You might also exit a long trade if the candle changes from yellow to green (weakening strong buy signal) or a short trade from purple to red (weakening strong sell signal).
5. Use Additional Confirmation
To avoid false signals, combine the Flux MA and candle signals with other indicators or dashboard metrics (e.g., trend strength, momentum, or volume pressure). For example:
•A yellow candle with a " Strong Bullish " trend and high buying volume is a robust long signal.
•A red candle with a " Moderate Bearish " trend and neutral momentum might need more confirmation before shorting.
Practical Example
Imagine you’re scalping a cryptocurrency:
• Long Trade : The Flux Candle turns yellow and is above the Flux MA, with the dashboard showing "Strong Buy" and high buying volume. You enter a long position. You exit when the candle turns red and dips below the Flux MA.
• Short Trade : The Flux Candle turns purple and crosses below the Flux MA, with a "Strong Sell" signal on the dashboard. You enter a short position. You exit when the candle turns green and crosses above the Flux MA.
Market Presets and Adaptation
This indicator is designed to work on any market with candlestick price data (stocks, crypto, forex, indices, etc.). To handle different behavior, it provides presets for major asset classes. Selecting a “Stocks,” “Crypto,” “Forex,” or “Options” preset automatically loads a set of parameter values optimized for that market . For example, a crypto preset might use a shorter lookback or higher sensitivity to account for crypto’s high volatility, while a stocks preset might use slightly longer smoothing since stocks often trend more slowly. In practice, this means the same core QFC logic applies across markets, but the thresholds and smoothing adjust so signals remain relevant for each asset type.
Usage Guidelines
• Recommended Timeframes : Optimized for 1 minute to 15 minute intraday charts. Can also be used on higher timeframes for short term swings.
• Market Types : Select “Crypto,” “Stocks,” “Forex,” or “Options” to auto tune periods, thresholds and weights. Use “Custom” to manually adjust all inputs.
• Interpreting Signals : Always confirm a signal by checking that trend, volume, and VWAP agree on the dashboard. A green “Strong Buy” arrow with green trend, green volume, and price > VWAP is highest probability.
• Adjusting Sensitivity : To reduce false signals in fast markets, enable DI Reversal Confirmation and Dynamic Thresholds. For more frequent entries in trending environments, enable Early Entry Trigger.
• Risk Management : This tool does not plot stop loss or take profit levels. Users should define their own risk parameters based on support/resistance or volatility bands.
Background Shading
To give you an at-a-glance sense of market regime without reading numbers, the indicator automatically tints the chart background in three modes—neutral, bullish and bearish—with two levels of intensity (light vs. dark):
Neutral (Gray)
When ADX is below 20 the market is considered “no trend” or too weak to trade. The background fills with a light gray (high transparency) so you know to sit on your hands.
Bullish (Green)
As soon as ADX rises above 20 and +DI exceeds –DI, the background turns a semi-transparent green, signaling an emerging uptrend. When ADX climbs above 30 (strong trend), the green becomes more opaque—reminding you that trend-following signals (Strong Buy, Pullback) carry extra weight.
Bearish (Red)
Similarly, if –DI exceeds +DI with ADX >20, you get a light red tint for a developing downtrend, and a darker, more solid red once ADX surpasses 30.
By dynamically varying both hue (green vs. red vs. gray) and opacity (light vs. dark), the background instantly communicates trend strength and direction—so you always know whether to favor breakout-style entries (in a strong trend) or stay flat during choppy, low-ADX conditions.
The setup shown in the above chart snapshot is BTCUSD 15 min chart : Binance for reference.
Disclaimer
No indicator guarantees profits. Backtest or paper trade this tool to understand its behavior in your market. Always use proper position sizing and stop loss orders.
Good luck!
- BullByte

Trend Following Bundle [ActiveQuants]The Trend Following Bundle indicator is a comprehensive toolkit designed to equip traders with a suite of essential technical analysis tools focused on identifying , confirming , and capitalizing on market trends . By bundling popular indicators like Moving Averages , MACD , Supertrend , ADX , ATR , OBV , and the Choppiness Index into a single script, it streamlines chart analysis and enhances strategy development.
This bundle operates on the principle that combining signals from multiple, complementary indicators provides a more robust view of market trends than relying on a single tool. It integrates:
Trend Direction: Moving Averages, Supertrend.
Momentum: MACD.
Trend Strength: ADX.
Volume Pressure: On Balance Volume (OBV).
Volatility: Average True Range (ATR).
Market Condition Filter: Choppiness Index (Trend vs. Range).
By allowing users to selectively enable, customize, and view these indicators (potentially across different timeframes), the bundle facilitates nuanced and layered trend analysis.
█ KEY FEATURES
All-in-One Convenience: Access multiple core trend-following indicators within a single TradingView script slot.
Modular Design: Easily toggle each individual indicator (MAs, MACD, Supertrend, etc.) On or Off via the settings menu to customize your chart view.
Extensive Customization: Fine-tune parameters (lengths, sources, MA types, colors, etc.) for every included indicator to match your trading style and the specific asset.
Multi-Timeframe (MTF) Capability: Configure each indicator component to analyze data from a different timeframe than the chart's, allowing for higher-level trend context.
Integrated Alerts: Pre-built alert conditions for key events like Moving Average crossovers , MACD signals , Supertrend flips , and Choppiness Index threshold crosses . Easily set up alerts through TradingView's alert system.
When configuring your alerts in TradingView, pay close attention to the trigger option:
- Setting it to " Only Once " will trigger the alert the first time the condition is met, which might happen during an unclosed bar (intra-bar). This alert instance will then cease.
- Setting it to " Once Per Bar Close " will trigger the alert only after a bar closes if the condition was met on that finalized bar. This ensures signals are based on confirmed data and allows the alert to potentially trigger again on subsequent closing bars if the condition persists or reoccurs. Use this option for signals based on confirmed, closed-bar data.
MA Smoothing & Bands (Optional): Apply secondary smoothing or Bollinger Bands directly to the Fast and Slow Moving Averages for advanced analysis.
█ USER INPUTS
Fast MA:
On/Off: Enables/Disables the Fast Moving Average plot and related smoothing/bands.
Type: Selects the primary calculation type (SMA, EMA, SMMA (RMA), WMA, VWMA). Default: EMA.
Source: Input data for the MA calculation (e.g., close, open, hl2). Default: close.
Length: Lookback period for the primary MA calculation. Default: 9.
Color: Sets the color of the primary Fast MA line. Default: Yellow.
Line Width: Sets the thickness of the primary Fast MA line. Default: 2.
Smoothing Type: Selects secondary smoothing type applied to the primary MA (e.g., None, SMA, EMA) or adds Bollinger Bands (SMA + Bollinger Bands). Default: None.
Smoothing Length: Lookback period for the secondary smoothing MA or the basis MA for Bollinger Bands. Relevant only if Smoothing Type is not " None ". Default: 10.
BB StdDev: Standard deviation multiplier for Bollinger Bands. Relevant only if Smoothing Type is " SMA + Bollinger Bands ". Default: 2.0.
Timeframe: Sets a specific timeframe for the MA calculation. Default: Chart.
Wait TF Close: If a timeframe is set, waits for that timeframe's bar to close before plotting, preventing repainting. Default: true.
Slow MA:
On/Off: Enables/Disables the Slow Moving Average plot and related smoothing/bands.
Type: Selects the primary calculation type (SMA, EMA, SMMA (RMA), WMA, VWMA). Default: EMA.
Source: Input data for the MA calculation (e.g., close, open, hl2). Default: close.
Length: Lookback period for the primary MA calculation. Default: 9.
Color: Sets the color of the primary Slow MA line. Default: Yellow.
Line Width: Sets the thickness of the primary Slow MA line. Default: 2.
Smoothing Type: Selects secondary smoothing type applied to the primary MA (e.g., None, SMA, EMA) or adds Bollinger Bands (SMA + Bollinger Bands). Default: None.
Smoothing Length: Lookback period for the secondary smoothing MA or the basis MA for Bollinger Bands. Relevant only if Smoothing Type is not " None ". Default: 10.
BB StdDev: Standard deviation multiplier for Bollinger Bands. Relevant only if Smoothing Type is " SMA + Bollinger Bands ". Default: 2.0.
Timeframe: Sets a specific timeframe for the MA calculation. Default: Chart.
Wait TF Close: If a timeframe is set, waits for that timeframe's bar to close before plotting, preventing repainting. Default: true.
MACD:
On/Off: Enables/Disables the MACD plots (MACD line, Signal line, Histogram).
Fast Length: Lookback period for the fast MA in MACD calculation. Default: 12.
Slow Length: Lookback period for the slow MA in MACD calculation. Default: 26.
Source: Input data for the MACD MAs. Default: close.
Signal Smoothing: Lookback period for the Signal Line MA. Default: 9.
Oscillator MA Type: Calculation type for Fast and Slow MAs (SMA, EMA). Default: EMA.
Signal Line MA Type: Calculation type for Signal Line MA (SMA, EMA). Default: EMA.
MACD Color: Color of the MACD line. Default: #2962FF.
MACD Signal Color: Color of the Signal line. Default: #FF6D00.
Timeframe: Sets a specific timeframe for the MACD calculation. Default: Chart.
Wait TF Close: If a timeframe is set, waits for that timeframe's bar to close. Default: true.
On Balance Volume (OBV):
On/Off: Enables/Disables the OBV plot and its related MAs/Bands.
Type (MA Smoothing): Selects MA type for smoothing OBV (None, SMA, EMA, etc.) or SMA + Bollinger Bands. Default: None.
Length (MA Smoothing): Lookback period for the OBV smoothing MA. Default: 14.
BB StdDev: Standard deviation multiplier for Bollinger Bands if selected. Default: 2.0.
Color: Color of the main OBV line. Default: #2962FF.
Timeframe: Sets a specific timeframe for the OBV calculation. Default: Chart.
Wait TF Close: If a timeframe is set, waits for that timeframe's bar to close. Default: true.
ADX:
On/Off: Enables/Disables the ADX plot.
ADX Smoothing: Lookback period for the ADX smoothing component. Default: 14.
DI Length: Lookback period for the Directional Movement (+DI/-DI) calculation. Default: 14.
Color: Color of the ADX line. Default: Red.
Timeframe: Sets a specific timeframe for the ADX calculation. Default: Chart.
Wait TF Close: If a timeframe is set, waits for that timeframe's bar to close. Default: true.
ATR:
On/Off: Enables/Disables the ATR plot.
Length: Lookback period for the ATR calculation. Default: 14.
Smoothing: Selects the calculation type for ATR (SMMA (RMA), SMA, EMA, WMA). Default: SMMA (RMA).
Color: Color of the ATR line. Default: #B71C1C.
Timeframe: Sets a specific timeframe for the ATR calculation. Default: Chart.
Wait TF Close: If a timeframe is set, waits for that timeframe's bar to close. Default: true.
Supertrend:
On/Off: Enables/Disables the Supertrend plot and background fill.
ATR Length: Lookback period for the ATR calculation within Supertrend. Default: 10.
Factor: Multiplier for the ATR value used to calculate the Supertrend bands. Default: 3.0.
Up Trend Color: Color for the Supertrend line and background during an uptrend. Default: Green.
Down Trend Color: Color for the Supertrend line and background during a downtrend. Default: Red.
Timeframe: Sets a specific timeframe for the Supertrend calculation. Default: Chart.
Wait TF Close: If a timeframe is set, waits for that timeframe's bar to close. Default: true.
Choppiness Index:
On/Off: Enables/Disables the Choppiness Index plot and bands.
Length: Lookback period for the Choppiness Index calculation. Default: 14.
Offset: Shifts the plot left or right. Default: 0.
Color: Color of the Choppiness Index line. Default: #2962FF.
Timeframe: Sets a specific timeframe for the CI calculation. Default: Chart.
Wait TF Close: If a timeframe is set, waits for that timeframe's bar to close. Default: true.
█ STRATEGY EXAMPLES
The following strategy examples are provided for illustrative and educational purposes only to demonstrate how indicators within this bundle could be combined. They do not constitute financial advice or trading recommendations. Always conduct your own thorough research and backtesting before implementing any trading strategy.
Here are a few ways the indicators in this bundle can be combined:
1. MA Crossover with Multi-Factor Confirmation
Goal: Enter trends early with confirmation from momentum and trend strength, while filtering out choppy conditions.
Setup: Enable Fast MA (e.g., 9 EMA), Slow MA (e.g., 50 EMA), MACD, ADX, and Choppiness Index.
Entry (Long):
- Price > Slow MA (Establishes broader uptrend context).
- Fast MA crosses above Slow MA OR Price crosses above Fast MA.
- MACD Histogram > 0 (Confirms bullish momentum).
- ADX > 20 or 25 (Indicates sufficient trend strength).
- Choppiness Index < 61.8 (Filters out excessively choppy markets).
Entry (Short): Reverse logic (except for ADX and Choppiness Index).
Management: Consider using the Supertrend or an ATR multiple for stop-loss placement.
Image showing a chart with 2:1 long and short trades, highlighting a candle disqualified for a long entry due to ADX below 20.
2. Supertrend Breakout Strategy
Goal: Use Supertrend for primary signals and stops, confirming with volume and trend strength.
Setup: Enable Supertrend, Slow MA, ADX, and OBV.
Entry (Long):
- Supertrend line turns green and price closes above it.
- Price > Slow MA (Optional filter for alignment with larger trend).
- ADX is rising or above 20 (Confirms trending conditions).
- OBV is generally rising or breaks a recent resistance level (Confirms volume supporting the move).
Entry (Short): Reverse logic (except for ADX and OBV).
Management: Initial stop-loss placed just below the green Supertrend line (for longs) or above the red line (for shorts). Trail stop as Supertrend moves.
Image showing a chart with a 2:1 long trade, one candle disqualified for a short entry, and another disqualified for a long entry.
3. Trend Continuation Pullbacks
Goal: Enter established trends during pullbacks to value areas defined by MAs or Supertrend.
Setup: Enable Slow MA, Fast MA (or Supertrend), MACD, and ADX.
Entry (Long):
- Price is consistently above the Slow MA (Strong uptrend established).
- ADX > 25 (Confirms strong trend).
- Price pulls back towards the Fast MA or the green Supertrend line.
- MACD Histogram was decreasing during the pullback but turns positive again OR MACD line crosses above Signal line near the MA/Supertrend level (Indicates momentum resuming).
Entry (Short): Reverse logic (except for ADX) during a confirmed downtrend.
Management: Stop-loss below the recent swing low or the Slow MA/Supertrend level.
Image showing a chart with 2:1 long and short trades, where price pulls back to the fast MA and the MACD histogram changes color, indicating shifts in momentum during the pullbacks.
█ CONCLUSION
The Trend Following Bundle offers a powerful and flexible solution for traders focused on trend-based strategies. By consolidating essential indicators into one script with deep customization, multi-timeframe analysis, and built-in alerts, it simplifies the analytical workflow and allows for the development of robust, multi-conditional trading systems. Whether used for confirming entries, identifying trend strength, managing risk, or filtering market conditions, this bundle provides a versatile foundation for technical analysis.
█ IMPORTANT NOTES
⚠ Parameter Tuning: Indicator settings (lengths, factors, thresholds) are not one-size-fits-all. Adjust them based on the asset being traded, its typical volatility, and the timeframe you are analyzing for optimal performance. Backtesting is crucial .
⚠ Multi-Timeframe Use: Using the Timeframe input allows for powerful analysis but be mindful of potential lag, especially if Wait TF Close is disabled. Signals based on higher timeframes will update only when that higher timeframe bar closes (if Wait TF Close is enabled).
⚠ Confirmation is Key: While the bundle provides many tools, avoid relying on a single indicator's signal. Use combinations to build confluence and increase the probability of successful trades.
⚠ Chart Clarity: With many indicators available, only enable those relevant to your current strategy to avoid overwhelming your chart. Use the On/Off toggles frequently.
⚠ Confirmed Bars Only: Like most TradingView indicators, signals and plots are finalized on the close of the bar. Be cautious acting on intra-bar signals which may change before the bar closes.
█ RISK DISCLAIMER
Trading involves substantial risk of loss and is not suitable for every investor. The Trend Following Bundle indicator provides technical analysis tools for educational and informational purposes only; it does not constitute financial advice or a recommendation to buy or sell any asset. Indicator signals identify potential patterns based on historical data but do not guarantee future price movements or profitability. Always conduct your own thorough analysis, use multiple sources of information, and implement robust risk management practices before making any trading decisions. Past performance is not indicative of future results.
📊 Happy trading! 🚀

Relative Directional Index (RDI)🔍 Overview
The Relative Directional Index (RDI) is a hybrid tool that fuses the Average Directional and the Relative Strength Indices (ADX and RSI) into a single, highly visual interface. While the former captures trend strength, the latter reveals momentum shifts and potential exhaustion. Together, they can confirm trend structure, anticipate reversals, and sharpen the timing entries and exits.
📌 Why Combine ADX with RSI?
Most indicators focus on either trend-following (like ADX) or momentum detection (like RSI)—but rarely both. Each comes with trade-offs:
- ADX alone confirms trend strength but ignores momentum.
- RSI alone signals overbought/oversold, but lacks trend context.
The RDI resolves this by integrating both, offering:
- Smarter filters for trend entries
- Early warnings of momentum breakdowns
- More confident signal validation
🧠 Design Note: Fibonacci Harmony
All default values—5, 13, 21—are Fibonacci numbers. This is intentional, as these values reflect the natural rhythm of market cycles, and promote harmonic calibration between price action and indicator logic.
🔥 Key Features
✅ ADX Histogram
- Green bars = trend gaining strength
- Red bars = trend weakening
- Adjustable transparency for visual tuning
✅ ADX Line (Orange)
- Measures trend strength over time
- Rising = accelerating trend
- Falling = trend may be fading
✅ RSI Line (Lemon Yellow)
- Captures momentum surges and slowdowns
- Above 50 = bullish control
- Below 50 = bearish pressure
✅ Trend Strength Squares
- Bright green = strong uptrend
- Bright red = strong downtrend
- Faded colors = range-bound or indecisive
✅ ADX/RSI Crossover Markers
- Yellow square = RSI crosses above ADX → momentum building
- Orange square = ADX crosses above RSI → trend still dominant
✅ Customizable Reference Lines
- Yellow (50) = strong trend threshold
- Red (30) = weak trend zone
- Green (70) = overextended, potential exhaustion
_______________________________________________________
🎯 How to Trade with the RDI
The RDI helps traders identify momentum-supported trends, catch early reversals, and avoid false signals during consolidation.
✅ Trend Confirmation Entries
🔼 Bullish → Enter long on pullbacks or resistance breakouts
- ADX rising above 30
- RSI above 50
- Green trend square visible
🔽 Bearish → Enter short on breakdowns or failed retests
- ADX rising
- RSI below 50
- Red trend square visible
🧯 Exit if RSI crosses back against trend direction or ADX flattens
🚨 Reversal Setups Using Divergence
📈 Bullish Divergence → Long entry after confirmation (e.g. engulfing bar, volume spike)
- Price prints lower low
- RSI prints higher low
- Green triangle
📉 Bearish Divergence → Short entry on breakdown
- Price prints higher high
- RSI prints lower high
- Red triangle
Tip: Stronger if ADX is declining (fading trend strength)
🔂 Breakout Detection via Cross Markers
- Yellow square = RSI > ADX → breakout brewing
- Orange square = ADX > RSI → trend continuation likely
⏸️ Avoid Choppy Markets
- RSI between 45–55
- Faded trend squares
- Flat ADX below 20–30
🧠 Pro Tips
- Combine RDI with VWAPs, moving averages and/or pitchforks
- Watch for alignment between trend and momentum
- Use divergence markers as confirmation, not stand-alone triggers
_______________________________________________________
⚠️ Hidden Divergence (Optional)
The RDI includes optional hidden divergence detection. These signals suggest trend continuation but are off by default. Use with discretion—best in established trends, not sideways markets.
🙈 Hidden Bullish
- Price prints higher low
- RSI prints lower low
🙈 Hidden Bearish
- Price prints lower high
- RSI prints higher high

Smart Trend Lines [The_lurker]"Smart Trend Lines" هو مؤشر متقدم مصمم لرسم خطوط الاتجاه الديناميكية تلقائيًا على الرسم البياني، مع القدرة على اكتشاف الكسور (Breakouts) بدقة باستخدام فلاتر تحليلية مثل ADX، RSI، والحجم. يوفر المؤشر ثلاثة أنواع من خطوط الاتجاه – رئيسية (Main)، متوسطة (Mid)، وقصيرة (Short) – لتلبية احتياجات المتداولين على مختلف الأطر الزمنية، سواء كانوا يركزون على الاتجاهات طويلة الأمد أو قصيرة الأمد.
كيف يعمل :
1- رسم خطوط الاتجاه:
يستخدم المؤشر نقاط الـ Pivot Highs و Pivot Lows لتحديد خطوط الاتجاه الصاعدة والهابطة تلقائيًا.
يتم رسم ثلاثة مستويات لخطوط الاتجاه بناءً على أطوال زمنية قابلة للتخصيص:
Main Trend Lines: لتحليل الاتجاهات طويلة الأمد (افتراضي: 50 شمعة).
Mid Trend Lines: للاتجاهات متوسطة المدى (افتراضي: 21 شمعة).
Short Trend Lines: للاتجاهات قصيرة المدى (افتراضي: 9 شموع).
2- اكتشاف الكسور:
يتم اكتشاف كسر خط الاتجاه عندما يتجاوز السعر (إغلاق، أعلى، أدنى - حسب اختيار المستخدم) الخط.
يتم وضع تسمية (Label) عند نقطة الكسر تحمل معلومات مختصرة عن الشروط المتحققة (مثل الحجم، ADX، RSI).
3- فلاتر التحقق:
ADX: يتحقق من قوة الاتجاه (الحد الأدنى قابل للتعديل، افتراضي: 20).
RSI: يستخدم لتصفية الكسور في مناطق التشبع الشرائي أو البيعي (حدود عليا وسفلى قابلة للتخصيص).
Volume: يقارن الحجم الحالي بالمتوسط المتحرك للحجم للتأكد من قوة الحركة.
4- التنبيهات:
يوفر تنبيهًا موحدًا عند حدوث أي كسر (شراء أو بيع) لجميع أنواع الخطوط، مع إطلاق التنبيه فقط عند شمعة الكسر.
المميزات الرئيسية
خطوط اتجاه متعددة المستويات:
ثلاثة أطوال مختلفة (رئيسية، متوسطة، قصيرة) مع إمكانية إظهارها أو إخفائها بشكل مستقل، مما يتيح المرونة للمتداولين.
تخصيص كامل:
تعديل أطوال خطوط الاتجاه (عدد الشموع).
اختيار الألوان والأنماط (متصل، متقطع، منقط) لكل نوع من الخطوط.
تحديد حجم التسميات (Tiny, Small, Normal, Large, Huge).
اختيار نوع السعر المستخدم لفحص الكسر (Close, High, Low).
فلاتر ذكية:
استخدام ADX لتأكيد قوة الاتجاه.
فلتر RSI لتجنب الإشارات في المناطق المشبعة.
مقارنة الحجم لضمان أهمية الكسر.
تسميات تفاعلية:
تظهر التسميات عند الكسر مع رموز مختصرة (V للحجم، A لـ ADX، R لـ RSI) لتوضيح الشروط المتحققة.
حجم التسميات قابل للتخصيص لتحسين الرؤية.
تنبيهات دقيقة:
تنبيه واحد موحد لجميع الكسور (شراء أو بيع) يُطلق فقط عند شمعة الكسر، مما يقلل من الإزعاج ويزيد من الكفاءة.
عرض الخطوط السابقة:
خيار اختياري لعرض خطوط الاتجاه الرئيسية السابقة لتحليل تاريخي أعمق.
الفوائد
سهولة الاستخدام: يرسم خطوط الاتجاه تلقائيًا دون الحاجة إلى رسم يدوي.
دقة عالية: الفلاتر المتعددة (ADX، RSI، Volume) تقلل من الإشارات الخاطئة وتعزز موثوقية الكسور.
مرونة كبيرة: مناسب لجميع أنواع المتداولين (Scalpers، Swing Traders، Long-term Investors) بفضل الخطوط متعددة الأطوال.
واجهة مرئية واضحة: ألوان وأنماط قابلة للتخصيص تجعل الرسم البياني سهل القراءة.
%% نصائح الاستخدام
للمتداولين قصيري الأمد: ركز على خطوط "Short" واضبط الفلاتر لتكون أكثر حساسية (مثل تقليل عتبة ADX).
للتحليل طويل الأمد: استخدم خطوط "Main" مع إعدادات افتراضية أو أطول لالتقاط الاتجاهات الكبيرة.
قم بتفعيل التنبيهات للحصول على إشعارات فورية عند حدوث كسر مؤكد.
%% الإعدادات
Main/Mid/Short Trend Line Length: اضبط طول كل خط بناءً على استراتيجيتك.
Color & Style: اختر ألوانًا وأنماطًا تناسب تفضيلاتك البصرية.
Break Check Price: حدد نوع السعر المستخدم للكسر (افتراضي: Close).
Label Size: اختر حجم التسميات حسب احتياجاتك.
Filters: فعّل أو عطّل الفلاتر وضبط العتبات (ADX، RSI، Volume) لتتناسب مع السوق.
إخلاء المسؤولية
لا يُقصد بالمعلومات والمنشورات أن تكون، أو تشكل، أي نصيحة مالية أو استثمارية أو تجارية أو أنواع أخرى من النصائح أو التوصيات المقدمة أو المعتمدة من TradingView.
"Smart Trend Lines" is an advanced indicator for drawing dynamic trend lines, with the ability to detect breakouts (breakouts) using analytical filters such as ADX, RSI, etc. It provides three types of light lines - main (main), intermediate (intermediate), and short (short) - for the General Pipeline Network Company on various time frames, whether they are set on long-term or precious trends.
How it works:
1- Drawing lines for lines:
Uses the Pivot Highs and Pivot Lows indicator points for guide lines and automatic guide lines.
Three levels of guide lines are drawn along the air lines for customization:
Main trend lines: for analyzing long-term trends (default: 50 candles).
Intermediate trend lines: for medium-term trends (default: 21 candles).
Short trend lines: for short-term trends (default: 9 candles).
2- Fracture detection:
A fault is detected when the price (close, high, low - according to the user's choice) crosses the line.
A label is placed at the break point with brief information about the conditions met (such as volume, ADX, RSI).
3- Validation filters:
ADX: Checks the strength of the fault (simple limit, default: 20).
Relative Strength Index (RSI): Used to filter out fractures in the northern or eastern regions (customizable upper limits).
Volume: Compares the current volume to the moving average of the volume by the strength of the impact.
4- Alerts:
Provides a unified alert when any break (buy or sell) occurs for all types of lines, with the alert being triggered only when the break occurs.
Key features
Multiple trend lines for levels:
Three different lengths (main, medium, short) with the possibility of showing or hiding them independently, allowing traders.
Full translation:
Modify the length of the lines (number of candles).
Choose colors and styles (solid, dashed, dotted) for each type of line.
Select label size (small, small, normal, large, huge).
Select user type to check the breakout (close, high, low).
Smart filters:
Use ADX to confirm the strength of the error.
RSI filter abbreviated in environmental factors.
Compare volume and use of the breakout.
Interactive labels:
Scale labels on the breakout with special symbols (V for volume, A for ADX, R for RSI) to indicate the conditions met.
Customizable label size to customize the search.
Precise alerts:
A single unified alert for all breakouts (buy or sell) is triggered only on the breakout, choosing from celebration to protest for that.
View previous lines:
Option to select previous major lines to analyze their history.
Benefits
Ease of use: Draws freehand lines without the need to draw by hand.
High-precision: Optical filters (ADX, RSI, Volume) are effective from the effective impact and enhance the confidence of the breakouts.
Multiple options: Suitable for all types of traders (scalpers, swing traders, long-term investors) thanks to Malaysia Airlines 24/7.
Visual interface: Colors and patterns can be plotted for easy-to-read charting.
%% Tips for use
For short-term traders: Focus on the "short" lines and adjust the filters to be more visible (e.g. reduce the ADX bar).
For long-term analysis: Use the "main" lines with default or partial settings for key points.
Enable notifications for breakouts on instant notifications when absolutely necessary.
%%Except
Main/Intermediate/Short Trend Line Length: Adjust the length of each line to guide you.
Color and Style: Choose colors and styles to suit your visual preferences.
Verify Price Breakout: Select the type of price used for the breakout (default: Close).
Label Size: Choose the size of the labels as desired.
Filters: Enable or disable filters and adjust thresholds (ADX, RSI, Volume) to suit the market.
Disclaimer
The information and posts are not intended to be, or constitute, any financial, investment, trading or other types of preparation or execution of tasks or endorsed by TradingView.
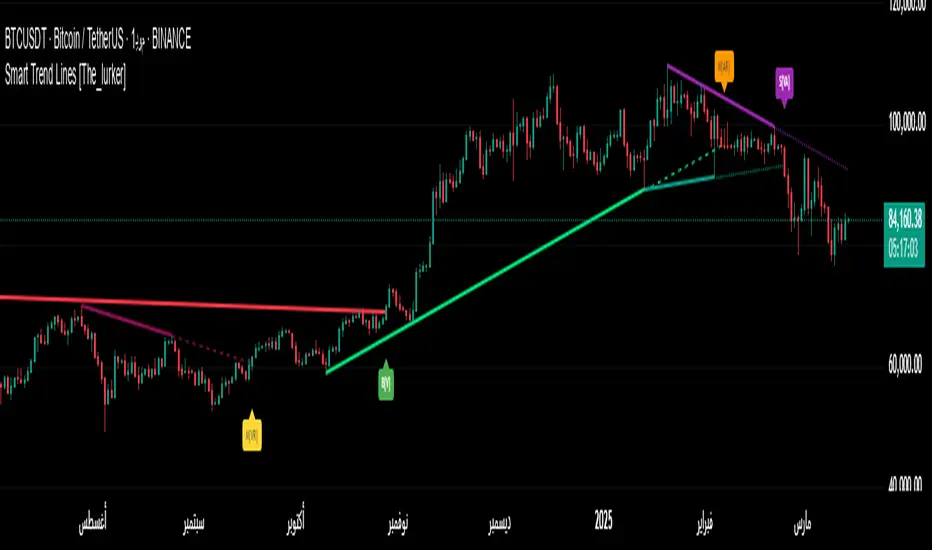
Gabriel's Witcher Strategy [65 Minute Trading Bot]Strategy Description: Gabriel's Witcher Strategy
Author: Gabriel
Platform: TradingView Pine Script (Version 5)
Backtested Asset: Avalanche (Coinbase Brokage for Volume adjustment)
Timeframe: 65 Minutes
Strategy Type: Comprehensive Trend-Following and Momentum Strategy with Scalping and Risk Management Features
Overview
Gabriel's Witcher Strategy is an advanced trading bot designed for the Avalanche pair on a 65-minute timeframe. This strategy integrates a multitude of technical indicators to identify and execute high-probability trading opportunities. By combining trend-following, momentum, volume analysis, and range filtering, the strategy aims to capitalize on both long and short market movements. Additionally, it incorporates scalping mechanisms and robust risk management features, including take-profit (TP) levels and commission considerations, to optimize trade performance and profitability.
====Key Components====
Source Selection:
Custom Source Flexibility: Allows traders to select from a wide range of price and volume sources (e.g., Close, Open, High, Low, HL2, HLC3, OHLC4, VWAP, On-Balance Volume, etc.) for indicator calculations, enhancing adaptability to various trading styles.
Various curves of Volume Analysis are employed:
Tick Volume Calculation: Utilizes tick volume as a fallback when actual volume data is unavailable, ensuring consistency across different data feeds.
Volume Indicators: Incorporates multiple volume-based indicators such as On-Balance Volume (OBV), Accumulation/Distribution (AccDist), Negative Volume Index (NVI), Positive Volume Index (PVI), and Price Volume Trend (PVT) for comprehensive market analysis.
Trend Indicators:
ADX (Average Directional Index): Measures trend strength using either the Classic or Masanakamura method, with customizable length and threshold settings. It's used to open positions when the mesured trend is strong, or exit when its weak.
Jurik Moving Average (JMA): A smooth moving average that reduces lag, configurable with various parameters including source, resolution, and repainting options.
Parabolic SAR: Identifies potential reversals in market trends with adjustable start, increment, and maximum settings.
Custom Trend Indicator: Utilizes highest and lowest price points over a specified timeframe to determine current and previous trend bases, visually represented with color-filled areas.
Momentum Indicators:
Relative Strength Index (RSI): Evaluates the speed and change of price movements, smoothed with a custom length and source. It's used to not enter the market for shorts in oversold or longs for overbought conditions, and to enter for long in oversold or shorts for overboughts.
Momentum-Based Calculations: Employs both Double Exponential Moving Averages (DEMA) on a MACD-based RSI to enhance momentum signal accuracy which is then further accelerated by a Hull MA. This is the technical analysis tool that determines bearish or bullish momentum.
OBV-Based Momentum Conditions: Uses two exponential moving averages of OBV to determine bullish or bearish momentum shifts, anomalities, breakouts where banks flow their funds in or Smart Money Concepts trade.
Moving Averages (MA):
Multiple MA Types: Includes Simple Moving Average (SMA), Exponential Moving Average (EMA), Weighted Moving Average (WMA), Hull Moving Average (HMA), and Volume-Weighted Moving Average (VWMA), selectable via input parameters.
MA Speed Calculation: Measures the percentage change in MA values to determine the direction and speed of the trend.
Range Filtering:
Variance-Based Filter: Utilizes variance and moving averages to filter out trades during low-volatility periods, enhancing trade quality.
Color-Coded Range Indicators: Visualizes range filtering with color changes on the chart for quick assessment.
Scalping Mechanism:
Heikin-Ashi Candles: Optionally uses Heikin-Ashi candles for smoother price action analysis.
EMA-Based Trend Detection: Employs fast, medium, and slow EMAs to determine trend direction and potential entry points.
Fractal-Based Filtering: Detects regular or BW (Black & White) fractals to confirm trade signals.
Take Profit (TP) Management:
Dynamic TP Levels: Calculates TP levels based on the number of consecutive long or short entries, adjusting targets to maximize profits.
TP Signals and Re-Entry: Plots TP signals on the chart and allows for automatic re-entry upon TP hit, maintaining continuous trade flow.
Risk Management:
Commission Integration: Accounts for trading commissions to ensure net profitability.
Position Sizing: Configured to use a percentage of equity for each trade, adjustable via input parameters.
Pyramiding: Allows up to one additional position per direction to enhance gains during strong trends.
Alerts and Visual Indicators:
Buy/Sell Signals: Plots visual indicators (triangles and flags) on the chart to signify entry and TP points.
Bar Coloring: Changes bar colors based on ADX and trend conditions for immediate visual cues.
Price Levels: Marks significant price levels related to TP and position entries with cross styles.
Input Parameters
Source Settings:
Custom Sources (srcinput): Choose from various price and volume sources to tailor indicator calculations.
ADX Settings:
ADX Type (ADX_options): Select between 'CLASSIC' and 'MASANAKAMURA' methods.
ADX Length (ADX_len): Defines the period for ADX calculation.
ADX Threshold (th): Sets the minimum ADX value to consider a strong trend.
RSI Settings:
RSI Length (len_3): Period for RSI calculation.
RSI Source (src_3): Source data for RSI.
Trend Strength Settings:
Channel Length (n1): Period for trend channel calculation.
Average Length (n2): Period for smoothing trend strength.
Jurik Moving Average (JMA) Settings:
JMA Source (inp): Source data for JMA.
JMA Resolution (reso): Timeframe for JMA calculation.
JMA Repainting (rep): Option to allow JMA to repaint.
JMA Length (lengths): Period for JMA.
Parabolic SAR Settings:
SAR Start (start): Initial acceleration factor.
SAR Increment (increment): Acceleration factor increment.
SAR Maximum (maximum): Maximum acceleration factor.
SAR Point Width (width): Visual width of SAR points.
Trend Indicator Settings:
Trend Timeframe (timeframe): Period for trend indicator calculations.
Momentum Settings:
Source Type (srcType): Select between 'Price' and 'VWAP'.
Momentum Source (srcPrice): Source data for momentum calculations.
RSI Length (rsiLen): Period for momentum RSI.
Smooth Length (sLen): Smoothing period for momentum RSI.
OBV Settings:
OBV Line 1 (e1): EMA period for OBV line 1.
OBV Line 2 (e2): EMA period for OBV line 2.
Moving Average (MA) Settings:
MA Length (length): Period for MA calculations.
MA Type (matype): Select MA type (1: SMA, 2: EMA, 3: HMA, 4: WMA, 5: VWMA).
Range Filter Settings:
Range Filter Length (length0): Period for range filtering.
Range Filter Multiplier (mult): Multiplier for range variance.
Take Profit (TP) Settings:
TP Long (tp_long0): Percentage for long TP.
TP Short (tp_short0): Percentage for short TP.
Scalping Settings:
Scalping Activation (ACT_SCLP): Enable or disable scalping.
Scalping Length (HiLoLen): Period for scalping indicators.
Fast EMA Length (fastEMAlength): Period for fast EMA in scalping.
Medium EMA Length (mediumEMAlength): Period for medium EMA in scalping.
Slow EMA Length (slowEMAlength): Period for slow EMA in scalping.
Filter (filterBW): Enable or disable additional fractal filtering.
Pullback Lookback (Lookback): Number of bars for pullback consideration.
Use Heikin-Ashi Candles (UseHAcandles): Option to use Heikin-Ashi candles for smoother trend analysis.
Strategy Logic
Indicator Calculations:
Volume and Source Selection: Determines the primary data source based on user input, ensuring flexibility and adaptability.
ADX Calculation: Computes ADX using either the Classic or Masanakamura method to assess trend strength.
RSI Calculation: Evaluates market momentum using RSI, further smoothed with custom periods.
Trend Strength Assessment: Utilizes trend channel and average lengths to gauge the robustness of current trends.
Jurik Moving Average (JMA): Smooths price data to reduce lag and enhance trend detection.
Parabolic SAR: Identifies potential trend reversals with adjustable parameters for sensitivity.
Momentum Analysis: Combines RSI with DEMA and OBV-based conditions to confirm bullish or bearish momentum.
Moving Averages: Employs multiple MA types to determine trend direction and speed.
Range Filtering: Filters out low-volatility periods to focus on high-probability trades.
Trade Conditions:
Long Entry Conditions:
ADX Confirmation: ADX must be above the threshold, indicating a strong uptrend.
RSI and Momentum: RSI below 70 and positive momentum signals.
JMA and SAR: JMA indicates an uptrend, and Parabolic SAR is below the price.
Trend Indicator: Confirms the current trend direction.
Range Filter: Ensures market is in an upward range.
Scalping Option: If enabled, additional scalping conditions must be met.
Short Entry Conditions:
ADX Confirmation: ADX must be above the threshold, indicating a strong downtrend.
RSI and Momentum: RSI above 30 and negative momentum signals.
JMA and SAR: JMA indicates a downtrend, and Parabolic SAR is above the price.
Trend Indicator: Confirms the current trend direction.
Range Filter: Ensures market is in a downward range.
Scalping Option: If enabled, additional scalping conditions must be met.
Position Management:
Entry Execution: Places long or short orders based on the identified conditions and user-selected position types (Longs, Shorts, or Both).
Take Profit (TP): Automatically sets TP levels based on predefined percentages, adjusting dynamically with consecutive trades.
Re-Entry Mechanism: Allows for automatic re-entry upon TP hit, maintaining active trading positions.
Exit Conditions: Closes positions when TP levels are reached or when opposing trend signals are detected.
Visual Indicators:
Bar Coloring: Highlights bars in green for bullish conditions, red for bearish, and orange for neutral.
Plotting Price Levels: Marks significant price levels related to TP and trade entries with cross symbols.
Signal Shapes: Displays triangle and flag shapes on the chart to indicate trade entries and TP hits.
Alerts:
Custom Alerts: Configured to notify traders of long entries, short entries, and TP hits, enabling timely trade management and execution.
Usage Instructions
Setup:
Apply the Strategy: Add the script to your TradingView chart set to BTCUSDT with a 65-minute timeframe.
Configure Inputs: Adjust the input parameters under their respective groups (e.g., Source Settings, ADX, RSI, Trend Strength, etc.) to match your trading preferences and risk tolerance.
Position Selection:
Choose Position Type: Use the Position input to select Longs, Shorts, or Both based on your market outlook.
Execution: The strategy will automatically execute and manage positions according to the selected type, ensuring targeted trading actions.
Signal Interpretation:
Buy Signals: Blue triangles below the bars indicate potential long entry points.
Sell Signals: Red triangles above the bars indicate potential short entry points.
Take Profit Signals: Flags above or below the bars signify TP hits for long and short positions, respectively.
Bar Colors: Green bars suggest bullish conditions, red bars indicate bearish conditions, and orange bars represent neutral or consolidating markets.
Risk Management:
Default Position Size: Set to 100% of equity. Adjust the default_qty_value as needed for your risk management strategy.
Commission: Accounts for a 0.1% commission per trade. Adjust the commission_value to match your broker's fees.
Pyramiding: Allows up to one additional position per direction to enhance gains during strong trends.
Backtesting and Optimization:
Historical Testing: Utilize TradingView's backtesting features to evaluate the strategy's performance over historical data.
Parameter Tuning: Optimize input parameters to align the strategy with current market dynamics and personal trading objectives.
Alerts Configuration:
Set Up Alerts: Enable and configure alerts based on the predefined alertcondition statements to receive real-time notifications of trade signals and TP hits.
Additional Features
Comprehensive Indicator Integration: Combines multiple technical indicators to provide a holistic view of market conditions, enhancing trade signal accuracy.
Scalping Options: Offers an optional scalping mechanism to capitalize on short-term price movements, increasing trading flexibility.
Dynamic Take Profit Levels: Adjusts TP targets based on the number of consecutive trades, maximizing profit potential during favorable trends.
Advanced Volume Analysis: Utilizes various volume indicators to confirm trend strength and validate trade signals.
Customizable Range Filtering: Filters trades based on market volatility, ensuring trades are taken during optimal conditions.
Heikin-Ashi Candle Support: Optionally uses Heikin-Ashi candles for smoother price action analysis and reduced noise.
====Recommendations====
Thorough Backtesting:
Historical Performance: Before deploying the strategy in a live trading environment, perform comprehensive backtesting to understand its performance under various market conditions. These are the premium settings for Avalanche Coinbase.
Optimization: Regularly review and adjust input parameters to ensure the strategy remains effective amidst changing market volatility and trends. Backtest the strategy for each crypto and make sure you are in the right brokage when using the volume sources as it will affect the overall outcome of the trading strategy.
Risk Management:
Position Sizing: Adjust the default_qty_value to align with your risk tolerance and account size.
Stop-Loss Implementation: Although the strategy includes TP levels, they're also consided to be a stop-loss mechanisms to protect against adverse market movements.
Commission Adjustment: Ensure the commission_value accurately reflects your broker's fees to maintain realistic backtesting results. Generally, 0.1~0.3% are most of the average broker's comission fees.
Slipage: The slip comssion is 1 Tick, since the strategy is adjusted to only enter/exit on bar close where most positions are available.
Continuous Monitoring:
Strategy Performance: Regularly monitor the strategy's performance to ensure it operates as expected and make adjustments as needed. A max-drawndown hit has been added to operate in case the premium Avalanche settings go wrong, but you can turn it off an adjust the equity percentage to 50% if you are confortable with the high volatile max-drown or even 100% if your account allows you to borrow cash.
Customization:
Indicator Parameters: Tailor indicator settings (e.g., ADX length, RSI period, MA types) to better fit your specific trading style and market conditions.
Scalping Options: Enable or disable scalping based on your trading preferences and risk appetite.
Conclusion
Gabriel's Witcher Strategy is a robust and versatile trading solution designed to navigate the complexities of the Crypto market. By integrating a wide array of technical indicators and providing extensive customization options, this strategy empowers traders to execute informed and strategic trades. Its comprehensive approach, combining trend analysis, momentum detection, volume evaluation, and range filtering, ensures that trades are taken during optimal market conditions. Additionally, the inclusion of scalping features and dynamic take-profit management enhances the strategy's adaptability and profitability potential. Unlike any trading strategy, with both diligent testing and continuous monitoring under the strategy tester, it's possible to achieve sustained success by adjusting the settings to the individual Crypto that need it, for example this one is preset for Avalanche Coinbase 65 Miinutes but it can be adjust for BTCUSD or Etherium if you backtest and search for the right settings.

The Flower - Multiple Strategy Options in OneStrategy Overview
This strategy code currently includes four separate strategies to be used to either aid in discretionary trading or to be used algorithmically through the third-party system Profitview (profitview.app). Support for Pineconnector for use with MetaTrader 4 is in the works. The strategies have been designed with cryptocurrency trading in mind, however, the fundamentals apply to other assets.
The four strategies currently included are labeled “TSI Cross” (the default setting), “Oscillator Bands”, “Scalping”, and “McG/MA Cross”. Detailed information for each independent strategy can be found below, including sample settings configurations for each. A dropdown menu to select the strategy can be found under the “Strategy Options” set of settings under the Input tab of the strategy settings menu.
Additionally, the option to receive only long or short signals can be found alongside the Strategy Choice menu.
Take profit, stop loss, and trailing percentages are also included, found at the bottom of the Input tab under “TT and TTP” as well as “Stop Loss”. Make sure to understand the TP/SL ratio that you desire before use, as the desired hit rate/profitability percentage will be affected accordingly.
The only visuals associated with the strategy are two McGinley Dynamic lines, red (slow length) and green (fast length). These are relevant to the McGinley Cross strategy, but can be used alongside the other strategies if desired.
When viewing the backtesting data in the TradingView Strategy Tester, ensure that “use bar magnifier” is activated. This option can be found in the Properties tab of the strategy settings menu.
Profitview Settings
If you wish to utilize Profitview’s automation system, find the included “Profitview Settings” under the Input tab of the strategy settings menu. If not, skip this section entirely as it can be left blank. Options will be “OPEN LONG TITLE”, “OPEN SHORT TITLE”, “CLOSE LONG TITLE”, and “CLOSE SHORT TITLE”. If you wished to trade SOL, for example, you would put “SOL LONG”, “SOL SHORT”, “SOL CLOSE LONG”, and “SOL CLOSE SHORT” in these areas. Within your Profitview extension, ensure that your Alerts all match these titles. A sample of our Profitview syntax can be found below.
To set an alert for use with Profitview, go to the “Alerts” tab in TradingView, then create an alert. Make sure that your desired asset and timeframe are currently displayed on your screen when creating the alert. Under the “Condition” option of the alert, select the strategy, then select the expiration time. If using TradingView Premium, this can be open-ended. Otherwise, select your desired expiration time and date. This can be updated whenever desired to ensure the strategy does not expire. Under “Alert actions”, nothing necessarily needs to be selected unless so desired. Leave the “Alert name” option empty. For the “Message”, delete the generated message and replace it with {{strategy.order.alert_message}} and nothing else.
Strategy Choices
As mentioned above, this strategy code contains four separate strategy options. A detailed breakdown of each follows below:
Total Strength Index (TSI) Cross
This strategy option is the default choice. The main signal involved in this strategy is a crossover or crossunder of the TSI value line and TSI signal line, however, there are a few other signals involved in the creation of a long or short entry. In addition to the TSI, the strategy includes an Average Directional Index (ADX) threshold value, Jurik Volatility Bands (JVB), a Stoch RSI threshold, and an oscillator of choice in conjunction with a threshold of 0. This oscillator choice can be selected under the “Signal Options” menu in the Input tab of the strategy settings. The default oscillator is the Detrended Price Oscillator (DPO), though the option for Chande Momentum (CMO) or Rate of Change (RoC) are both viable for this strategy.
Individual settings for these can be found in the Input tab under “Oscillator Settings” (TSI, Stoch RSI, DPO, CMO, ROC), “Band/Channel Settings” (Jurik Volatility Bands Length/Smoothing), and “Directional Settings” (ADX Smoothing Long, DI Length Short, ADX Threshold).
Sample settings for SOLUSDT using the 20M timeframe:
- Oscillator Settings -- DPO Length (21), DPO *not* centered, RSI (Stoch) Length (4), Stochastic Length (4), TSI Long Length (25), TSI Short Length (13), TSI Signal Length (13), K (3), D (3)
- Band/Channel Settings -- Jurik Volatility Bands Length (25), Jurik Volatility Bands Smoothing (5)
- Directional Settings – JVB Price Threshold (0), ADX Smoothing Long (5), DI Length Short (5), ADX Threshold (23)
- Take Profit/Stop Loss – 0.85% TP, 0.005% TTP, 1.3% SL
Oscillator Bands
This strategy involves the usage of bands or channels that use oscillators as a source input. The main signal for this strategy derives from a cross of the band or channel and a hline of 0. Additionally, this includes a “Directional Filter” and a “MA Filter”. The selections for all of these can be found in the “Signal Options” section of the Input tab.
First option is for Oscillator Choice and includes DPO, CMO, ROC, RSI, TSI, and the Jurik price line. The individual settings for these can be found in the “Oscillator Settings” section. Different channels can be selected for the upper or lower bands, though it is not necessary for them to differ. These current options include Bollinger Bands and Jurik Volatility Bands, the individual settings for each found in the “Band/Channel Settings” section. Next is the MA Filter, of which you can select SMA, EMA, SMMA, WMA, VWMA, KAMA, JMA, or McGinley Dynamic. All options for these settings can be found in the “MA Filter Settings” section. Lastly, the Directional Filters can be selected for either direction like the upper/lower band selection. These filters include the ADX, Bull-Bear Power (BBP), Parabolic SAR (PSAR), or Jurik.
Sample settings for WAVESUSDT using the 20M timeframe:
- Oscillator Choice – DPO (Length – 30, uncentered)
- Upper and Lower Band – JVB Upper/Lower (Jurik Volatility Bands Length – 25; Smoothing – 10)
- MA Filter – VWMA – (MA Length – 40; Source – Open)
- Directional Filter – ADX (ADX Smoothing Long – 14; DI Length Short – 5; ADX Threshold – 22)
- Take Profit/Stop Loss – 0.85% TP, 0.005% TTP, 1.3% SL
Scalping
This strategy heavily relies on the usage of Parabolic SAR, accompanied by a “Directional Filter” (as discussed in the previous section) other than PSAR. This strategy can provide a higher frequency of trades as opposed to the other strategies available, however, it comes with slightly higher risk inherently. A riskier take profit/stop loss spread is recommended here, though risk should always be managed. The settings required for this strategy are all found under the “Directional Settings” section of the strategy inputs.
Sample settings for NEARUSDT using the 20M timeframe:
- Directional Filter set to ADX
- Directional Settings – ADX Smoothing Long (5), DI Length Short (5), ADX Threshold (22), PSAR Start Value (0.02), PSAR Increment (0.005), PSAR Max Value (0.15), PSAR Source (Close)
- Take Profit/Stop Loss – 0.75% TP, 0.005% TTP, 1.5% SL
McGinley Cross
This strategy revolves around the crossing of two McGinley Dynamic lines of varying lengths alongside an ADX filter as well as a DPO filter. McGinley is used as opposed to a standard moving average cross strategy as it adjusts for shifts in market speed and can better gauge market trends. The McGinley length settings can be found with the “MA Filter” settings, labeled as Fast Length and Slow Length. The fast length number should be smaller than the slow length.
Sample settings for SOLUSDT using the 20M timeframe:
- Oscillator Settings – DPO Length (30), uncentered
- MA Filter Settings – McGinley Fast Length (4), McGinley Slow Length (21)
- Take Profit/Stop Loss – 0.85% TP, 0.005% TTP, 1.4% SL
Comprehensive Settings List
Date and Time: From date and to date, adjustable for backtesting purposes.
Signal Options:
Oscillator Choices: Chande Momentum Oscillator (CMO), Detrended Price Oscillator (DPO), Rate of Change (ROC), Relative Strength Index (RSI), True Strength Index (TSI), Jurik Volatility Bands Priceline (JVB) – *** for use with TSI Cross or Oscillator Bands strategies only ***
Upper and Lower Band/Channel Choices: Bollinger Bands (BB) or Jurik Volatility Bands (JVB) -- *** for use with Oscillator Bands strategy only ***
MA/McG Filter: SMA, EMA, RMA, WMA, VWMA, Kaufmann MA, Jurik MA, McGinley Dynamic -- *** for use with Oscillator Bands strategy only ***
Directional Filter Long/Short: Average Directional Index (ADX), Bull/Bear Power (BBP), Parabolic SAR (PSAR), Jurik -- *** for use with Oscillator Bands strategy only ***
Profitview Settings: *** For use with ProfitView extension only, otherwise ignore ***
Oscillator Settings: *** For use with TSI Cross, Oscillator Bands, and McGinley Cross strategies ***
CMO Length, CMO Source – for Chande Momentum Oscillator
DPO Length, DPO Centered – for Detrended Price Oscillator
RoC Length, RoC Source – for Rate of Change
RSI Length, RSI MA Length – for Relative Strength Index
RSI (Stoch) Length, Stochastic Length, Stoch RSI Source, K, D – for Stochastic RSI
TSI Long Length, TSI Short Length, TSI Signal Length – for True Strength Index
Band/Channel Settings: *** For use with Oscillator Bands strategy ***
Jurik Volatility Bands Length, Jurik Volatility Bands Smoothing – for Jurik Volatility Bands
Bollinger Band Length, Bollinger Band Multiplier – for Bollinger Bands
Directional Settings: *** For use with Scalping and Oscillator Bands strategies ***
JVB Price Threshold – for Jurik Volatility as a directional setting
ADX Smoothing Long, DI Length Short, ADX Threshold – for Average Directional Index
PSAR Start Value, PSAR Increment, PSAR Max Value, PSAR Source – for Parabolic SAR
MA Filter Settings: *** For use with Oscillator Bands and McGinley Cross strategies ***
McGinley Fast/Slow Length – for McGinley Dynamic
MA Length, MA Source, MA Offset – for any other moving average
TP and TTP / Stop Loss: *** For use with ALL strategies ***
Long/Short Take Profit % -- for standard take profit settings
Enable Trailing, Trailing Take Profit % -- for trailing settings
Stop Loss % -- for standard stop loss settings; trailing can be enabled or disabled for stop loss
Disclaimers:
Some open-source code has been included -- Jurik Volatility Bands (by "ProValueTrader") and Trailing Take Profit/Stop Loss code (by jason5480). Additional code was used from the TradingView built-ins.
These strategies do NOT guarantee future returns. Apply caution in trading regardless of discretionary or algorithmic. Understand the concepts of risk/reward and the intricacies of each strategy choice before utilizing them in your personal trading.
Invites to the strategy will only be disseminated to those with express consent and knowledge of the invite prior to the action itself.

Triple Standard Deviation==日本語説明も併記 // Japanese discription is following ==
■ Momentum Indicator (Triple Indication of Standard Deviation Volatilities)
■ Effective assets: All
■Example of utilization
1) Assume that a trend is generated at the timing when the yellow area chart (26) rises
2) Confirm the candlestick and if the price jumps out of the Bollinger band ± 1 σ, the trend toward that direction
3) If the closing price is confirmed within ± 1σ of the Bollinger band, close the position
■ Detailed explanation
Three standard deviation volatilities with different parameters are displayed at the same time. As represented by convergence divergence of Bollinger, it has a characteristic that it rises in the trend generation period and falls during the trend convergence period.
It develops color in a rising phase so that trend generation is easy to recognize, and fades in a falling phase.
Daily use is basic, but you can use it with the same parameters for other time feet.
The basic parameter (26) is displayed in yellow area for the most visibility.
The long-term parameter (52) is indicated by a yellow dot as an auxiliary element for judging the rising margin of the basic line.
The short-term parameter (13) is displayed as a line as an auxiliary element for recognizing the peak out of the basic line in advance.
In some cases, by changing short term (13) to super long term (100) you can recognize the major market price level once in several years.
Three periods The phrase "all lines" goes from "low position" to "rising together" is considered the strongest trend.
On the other hand, in the case where the short-term line rises backwards as the longer-term line goes down, it tends to end up with short-lived trends and failure to form trends.
If the trend speed is constant as a standard feature of calculating the standard deviation, the standard deviation may decrease even during trend continuation. Therefore, it is desirable to make a comprehensive judgment by comparing the shape of candlestick with the longer-term line.
Please note that there is no way to judge whether the trend suggested by this index rises or falls from this index, so it is necessary to confirm the main chart. (It is preferable to display parabolic or Bollinger band)
■ Remarks
It is an index created assuming that it is used as Triple STD-ADX in combination with Triple Smoothed ADX(to be posted later).
■ About Triple STD-ADX
Triple Standard Deviation "and" Triple Smoothed ADX "are superimposed and displayed as" Screen (without scale) "to function as" Triple STD - ADX ".
The method of utilization is the same as Triple Standard Deviation and Triple Smoothed ADX, but by simultaneously displaying two momentum indicators with different calculation approaches with multiple parameters, we aim to mutually complement the cognitive power of trends.
STD (13, 26, 52, 100, 200) and ADX (7, 14, 26, 52, 100) correspond to reaction rates respectively.
By choosing different reaction rates you can expect to further increase reliability.
You can estimate the reliability of the trend most reliably in a situation where all six signals in total rise from low to high.
■Sample: STD-ADX Trade Signal
========================================================
■ モメンタム指標(標準偏差ボラティリティの3連表示)
■ 有効アセット:すべて
■ 活用の一例
1)黄色のエリアチャート(26)が上昇したタイミングでトレンド発生を想定
2)ローソク足を確認し、ボリンジャーバンド±1σの外に価格が飛び出している場合はその方向へのトレンドと認識
3)ボリンジャーバンド±1σ以内で終値が確定した場合にはポジションクローズ
■ 詳細説明
パラメーターの異なる3つの標準偏差ボラティリティを同時に表示します。ボリンジャーの収束発散に代表されるように、トレンド発生期に上昇しトレンド収束期に低下する特性を持ちます。
トレンド発生を認識しやすいように上昇局面で発色し、下降局面で退色します。
活用は日足が基本ですが、他の時間足に対しても同一パラメーターで使用することができます。
基本パラメーター(26)は最も視認しやすいように黄色のエリア表示にしています。
長期パラメーター(52)は基本線の上昇余力を判断するための補助要素として黄色の丸点で表示しています。
短期パラメーター(13)は基本線のピークアウトを先行して認識するための補助要素としてラインで表示にしています。
場合によって、短期(13)を超長期(100)に変更することで数年に一度のレベルの大相場が認識できます。
3期間「全てのライン」が「低い位置」から「揃って上昇」する局面を最も強いトレンドと考えます。
一方、より長期のラインが低下する中、より短期のラインが逆行して上昇するケースでは、短命のトレンドやトレンド形成失敗に終わることが多くなります。
標準偏差の計算上の特徴としてトレンドの速度が一定の場合にトレンド継続中も標準偏差が低下することがあります。そのため、ローソク足の形状とより長期のラインを見比べて総合的に判断することが望ましいです。
なお、本指標が示唆するトレンドが上昇か下降かは本指標からは判断する術はないため、必ずメインチャートを確認する必要があります。(パラボリックやボリンジャーバンドを表示すると好適)
■備考
追って掲載するTriple Smoothed ADXと併用して、Triple STD-ADXとして使用することを想定して作成した指標です。
■Triple STD-ADXについて
「Triple Standard Deviation」と「Triple Smoothed ADX」を一方を「スクリーン(スケールなし)」として重ねて表示させることで「Triple STD-ADX」として機能します。
活用方法はTriple Standard DeviationやTriple Smoothed ADXと同じですが、算出アプローチの異なる2つのモメンタム指標を複数パラメーターで同時に表示させることで、トレンドの認識力を相互に補完する狙いがあります。
反応速度はそれぞれSTD(13,26,52,100,200)とADX(7,14,26,52,100)がほぼ対応します。
異なる反応速度を選択することで信頼度をさらに高めることを期待できます。
合計6本のシグナル全てが低い位置から揃って上昇する局面でトレンドの信頼性を最も高く見積もることができます。

Consolidation Zones Volume Delta | Flux ChartsGENERAL OVERVIEW:
The Consolidation Zones Volume Delta | Flux Charts indicator is designed to identify and visualize consolidation zones on the chart. Rather than only outlining areas of sideways price movement, the indicator analyzes volume activity occurring inside each consolidation zone. This is done by aggregating lower-timeframe volume data into the higher-timeframe consolidation range, allowing users to see how buying and selling activity evolves while price remains in a range.
What is the theory behind the indicator?:
The indicator is built around three core analytical concepts that guide how consolidation zones are detected and evaluated.
1. Consolidation as a structural phase
Periods of consolidation are characterized by reduced directional movement and compressed price ranges. During these phases, price action often alternates within a defined high–low boundary, creating a structure that can be objectively measured and tracked over time.
2. Volume behavior inside consolidation
While price may appear balanced within a consolidation range, volume activity inside that range can vary. The indicator evaluates volume contributions occurring within the vertical boundaries of the consolidation zone by using lower-timeframe data and weighting each candle’s volume based on its overlap with the zone. This produces an internal volume delta profile that reflects how buying and selling volume accumulates throughout the consolidation.
Delta behavior inside a zone may show:
Persistent dominance of buying or selling volume
Alternating shifts between buyers and sellers
Periods of relatively balanced participation
3. Markets consolidate in multiple ways, one detection method is not enough
Markets do not consolidate in a single, uniform way. To account for this, the indicator includes three distinct consolidation detection methods. Each method is calculated objectively, does not repaint, and targets a different type of sideways or low-expansion price behavior:
Candle Compression
ADX Low Trend Strength
Visual Range Boundaries
CONSOLIDATION ZONES VOLUME DELTA FEATURES:
The Consolidation Zones Volume Delta indicator includes 4 main features:
Consolidation Zones
Volume Delta
Standard Deviation Bands
Alerts
CONSOLIDATION ZONES:
🔹What is a Consolidation Zone?
A consolidation zone is a defined price range where market movement becomes compressed and price remains contained within clear upper and lower boundaries for a sustained period of time. During this phase, price does not establish a strong directional trend and instead oscillates within a relatively narrow range.
🔹Consolidation Zone Detection
The indicator automatically detects consolidation zones using three independent, rule-based methods. Each method evaluates a different market condition and can be selected individually depending on how you want consolidation to be defined. Regardless of the method used, all zones are calculated objectively and finalized once confirmed.
◇ Candles (Candle Compression)
The Candles method identifies consolidation by detecting periods of candle compression and reduced range expansion. A candle is considered part of a consolidation sequence when:
The candle body is small relative to its total range
The candle’s high–low range is smaller than the short-term Average True Range (ATR)
ATR is calculated using a 4-period average true range and is used as a volatility reference. If consecutive candles continue to meet these compression conditions, the indicator increments an internal count.
Under the Consolidation Candles section in the settings, you’ll find two controls.
Min. Consolidation Candles setting
This defines how many consecutive compressed candles are required before a consolidation zone is confirmed. Candle compression is determined using candle structure and short-term ATR, ensuring that only periods of reduced range expansion are counted. Once the minimum threshold is reached, the indicator creates a consolidation zone using the highest high and lowest low formed during the compressed sequence.
Mark Consolidation Candles
When enabled, the indicator highlights candles that meet the compression criteria, making it easy to visually identify which candles contributed to the formation of the consolidation zone.
◇ ADX (Low Trend Strength)
The ADX method identifies consolidation based on weak or declining trend strength rather than candle structure. This method uses the Average Directional Index (ADX) to determine when directional movement is reduced.
ADX is calculated using directional movement values that are smoothed over time. When ADX remains below a user-defined threshold, price is treated as being in a low-trend market. While this condition persists, the indicator tracks the highest high and lowest low formed during the low-trend period.
Under the ADX Settings section in the settings, you’ll find the following controls.
ADX Length
Defines the lookback period used to calculate directional movement for ADX.
ADX Smoothing
Controls the smoothing applied to the ADX calculation.
ADX Threshold
Sets the level below which ADX must remain for the market to be considered consolidating.
Consolidation Strength
Defines how many consecutive candles’ ADX must stay below the threshold before a consolidation zone is confirmed. Once this requirement is met, the indicator creates a consolidation zone using the accumulated high and low from the low-trend window.
Mark Candles Below Threshold
When enabled, the indicator highlights candles where ADX remains below the threshold.
◇ Visual Range
The Visual Range method identifies consolidation by detecting clearly defined horizontal price ranges where price remains contained for a sustained period of time. The indicator continuously tracks the rolling highest high and lowest low across recent candles. When price remains inside the same high–low boundaries without breaking above or below the range, an internal counter advances.
Under the Visual Range section in the settings, you’ll find the following control.
Min. Candles in Range
Defines how many consecutive candles must remain fully contained within the same high–low range before a consolidation zone is confirmed. Once this requirement is met, the indicator creates a consolidation zone using the established range boundaries.
🔹Consolidation Zone Settings
◇ Invalidation Method
Users can choose how Consolidation Zones are invalidated, selecting between Close Break or Wick Break.
Close Break: A Consolidation Zone is invalidated when a candle closes above/below the zone.
Wick Break: A Consolidation Zone is invalidated when a candle’s wick goes above/below the zone.
◇ Merge Overlapping Zones
When enabled, overlapping Consolidation Zones are automatically combined into one unified zone.
◇ Show Last
This setting determines how many Consolidation Zones are displayed on your chart. For example, setting this to 5 will display the 5 most recent zones.
VOLUME DELTA:
Delta Volume visualizes how buying and selling volume accumulates inside each consolidation zone. Instead of using the full candle volume, the indicator isolates only the volume that occurs within the vertical boundaries of the zone. This allows you to see whether bullish or bearish volume is dominating while price remains range-bound. The visualization updates in real time while the zone is active and reflects cumulative participation rather than individual candles.
🔹How Volume Delta is Calculated
Delta Volume is calculated using lower-timeframe data and applied to the higher-timeframe consolidation zone.
Each candle’s volume is split into bullish or bearish volume based on candle direction.
Lower-timeframe candles are pulled using the selected delta timeframe.
For each lower-timeframe candle, only the portion of volume that vertically overlaps the consolidation zone is counted.
Volume is weighted by the amount of overlap between the candle’s range and the zone’s range.
Bullish and bearish volume are accumulated over time to form a running, cumulative delta profile for the zone.
🔹Volume Delta Settings
◇ Enable
Turns the Delta Volume visualization on or off. Consolidation zones continue to plot when disabled.
◇ Show Delta %
Displays the percentage breakdown of bullish versus bearish volume inside the consolidation zone. Percentages are derived from cumulative volume totals.
◇ 3D Visual
When enabled, the delta blocks are extended diagonally using a depth offset derived from the instrument’s daily ATR. This creates visible side faces and top faces for the delta blocks, simulating depth without altering any calculations. The 3D effect is purely visual. It does not change how volume is calculated, weighted, or accumulated.
Users can control the intensity of the 3D effect choosing a value between 1 and 5. Increasing this value increases:
The horizontal offset of the delta blocks
The vertical depth projection applied to the volume faces
Higher values produce a more pronounced 3D appearance by pushing the delta visualization further away from the consolidation box. Lower values keep the visualization flatter and closer to the box boundaries. The depth scaling is normalized using ATR, so the effect adapts proportionally to the instrument’s volatility.
◇ Volume Delta Display Style
Controls how bullish and bearish volume are displayed inside the Consolidation Zone:
Horizontal: Volume is split top-to-bottom within the zone
Vertical: Volume is split left-to-right across the zone
◇ Timeframe
Defines the lower timeframe used for Volume Delta calculations. When a timeframe is selected, the indicator pulls lower-timeframe price and volume data and maps it into the higher-timeframe consolidation zone. Each lower-timeframe candle is evaluated individually. Only the portion of its volume that vertically overlaps the consolidation zone is included, and that volume is weighted based on the candle’s overlap with the zone’s price range. If the Timeframe field is left empty, the indicator defaults to using the chart’s current timeframe for delta calculations.
Using a lower timeframe increases the granularity of the delta calculation, allowing volume changes inside the zone to be measured more precisely. Using a higher timeframe produces a smoother, less granular delta profile.
Please Note: Delta rendering is automatically limited to available lower-timeframe data to prevent incomplete or distorted visuals when historical lower-timeframe volume is unavailable due to TradingView data limits.
STANDARD DEVIATION BANDS:
Standard Deviation Bands project measured price distance away from a confirmed consolidation zone using the size of that zone as the reference unit. Rather than calculating volatility from historical price dispersion, the bands are derived directly from the height of the consolidation range itself. Each band represents a fixed multiple of the consolidation zone’s height and is plotted symmetrically above and below the zone.
🔹How the bands are calculated
Once a consolidation zone is finalized, the indicator calculates the zone height as:
Zone Height = Zone High − Zone Low
This value becomes the base measurement for all deviation calculations. For each enabled band:
Upper bands are placed above the consolidation zone’s high
Lower bands are placed below the consolidation zone’s low
The distance of each band from the zone is calculated by multiplying the zone height by the selected band multiplier. These band levels are fixed relative to the consolidation zone and do not recalculate based on future price movement.
🔹Standard Deviation Band Settings
◇ Band 1
Enables the first deviation band above and below the consolidation zone. The Band 1 multiplier defines how far the band is placed from the zone in terms of zone height. For example, a multiplier of 1 plots the band one full zone height above and below the consolidation range.
◇ Band 2
Enables a second deviation band at a greater distance from the consolidation zone. Band 2 uses its own multiplier and is calculated independently of Band 1, allowing multiple expansion levels to be displayed simultaneously.
◇ Fill Bands
When enabled, the area between the consolidation zone and each deviation band is filled with a semi-transparent color. Upper fills apply to bands above the zone, and lower fills apply to bands below the zone. Fills are static and tied directly to the consolidation zone boundaries.
◇ Color Customization
Each deviation band has independent color controls for:
Upper band lines and fills
Lower band lines and fills
This allows users to visually distinguish between bullish and bearish extensions as well as between multiple deviation levels.
ALERTS:
Users can create alerts for the following:
New Consolidation Zone Formed
Consolidation Zone Break
UNIQUENESS:
This indicator combines multiple consolidation detection methods with lower-timeframe volume delta analysis inside each consolidation zone. It visualizes bullish and bearish volume using weighted overlap logic and optional 3D rendering for improved clarity. Users can choose how volume is displayed, apply structure-based deviation bands, and enable alerts for new zones and zone breaks. All features are rule-based, configurable, and designed to work together within a single framework.

Regime EngineRegime Engine
Overview
Regime Engine is a market regime detection system that classifies price action into bullish, bearish, or neutral states using weighted exponential moving average analysis. Once the regime is identified, the indicator generates buy and sell signals based on Donchian channel breakouts, filtered by ADX trend strength and RSI momentum conditions.
The Money Line
The core of regime detection is the Money Line, a weighted combination of two exponential moving averages. By default, the short EMA (8 periods) receives 60% weight while the long EMA (24 periods) receives 40% weight. This weighting allows the Money Line to be more responsive than a simple long-period average while remaining smoother than a short-period average alone.
The Money Line changes color based on the current regime: green for bullish, red for bearish, and yellow for neutral. This provides immediate visual feedback about the market state.
Regime Classification
The indicator determines market regime by comparing the relative positions of the short and long EMAs while also considering RSI levels to avoid classifying overbought or oversold conditions as trend states.
Bullish regime is identified when the short EMA is above the long EMA and RSI is not in overbought territory. This combination suggests upward momentum that is not yet exhausted.
Bearish regime is identified when the short EMA is below the long EMA and RSI is not in oversold territory. This indicates downward momentum with room to continue.
Neutral regime applies when the EMAs are close together or RSI conditions prevent trend classification. The indicator provides two optional methods for enhanced neutral detection.
Neutral Zone Detection
Markets often transition through periods where trend direction is unclear. The indicator offers two complementary methods for detecting these neutral zones.
The slope method examines the rate of change of the Money Line relative to ATR. When the Money Line is moving slowly (slope below a tolerance threshold), the market is classified as neutral regardless of EMA positioning.
The EMA distance method calculates the percentage distance between the short and long EMAs. When they are within a specified percentage of each other, the EMAs are considered too close to reliably indicate direction.
Either or both methods can be enabled, and if either triggers, the regime is classified as neutral.
Donchian Channel Signals
Buy and sell signals are generated when price interacts with the Donchian channel boundaries. The Donchian channel plots the highest high and lowest low over a lookback period (default 20 bars), offset by one bar to prevent repainting.
Buy signals trigger when price touches or breaks below the lower Donchian band, indicating a potential support level. Sell signals trigger when price touches or breaks above the upper Donchian band, indicating potential resistance.
An optional setting requires the close to confirm the break rather than just the wick, providing more conservative signal generation.
ADX Trend Strength Filter
The Average Directional Index filters signals to ensure they occur during trending conditions. When enabled, signals only fire if ADX exceeds the threshold (default 24), confirming that the market has sufficient directional momentum for breakout trades to succeed.
The indicator uses Wilder's original smoothing method for ADX calculation, providing the traditional interpretation of trend strength values.
RSI Momentum Filter
RSI provides additional signal filtering to ensure entries occur at favorable momentum levels. Buy signals require RSI to be at or below the oversold threshold (default 30), indicating potential exhaustion of selling pressure. Sell signals require RSI to be at or above the overbought threshold (default 70), suggesting exhaustion of buying pressure.
These filters can be disabled for traders who prefer unfiltered Donchian breakout signals.
BBWP Volatility Monitoring
Bollinger Band Width Percentile measures current volatility relative to its historical range. The indicator calculates BB width and ranks it against the specified lookback period (default 252 bars, approximately one trading year).
BBWP above 70% indicates elevated volatility, which may signal trend acceleration or potential reversals. BBWP below 30% indicates compressed volatility, often preceding significant moves. The information panel displays the current BBWP reading with color coding to highlight these conditions.
Signal Cooldown
To prevent signal clustering during extended breakout periods, a configurable cooldown prevents new signals of the same type for a specified number of bars after each signal. This ensures each signal represents a distinct trading opportunity.
Visual Components
The Donchian channel can display shaded bands between the upper and lower boundaries. The shading color reflects the current regime: green for bullish, magenta for bearish, and blue for neutral. This provides at-a-glance context for where price is trading within its recent range.
An ADX strength bar at the bottom of the chart uses color coding: white for weak trend (ADX below 15), orange for ranging (ADX 15-24), and blue for trending (ADX above 24). This matches the trend strength display in the information panel.
Price labels appear at signal locations showing the signal type and entry price. Labels are automatically cleaned up after reaching a configurable history limit to maintain chart performance.
Signal candles are highlighted in blue, making it easy to identify exactly which bars generated signals when reviewing historical performance.
Information Panel
A compact table displays key metrics: current regime bias, trend strength classification, BBWP volatility reading, RSI level, and ADX value. Each metric is color-coded to highlight favorable or unfavorable conditions.
The panel can be positioned at any corner or middle edge of the chart. An alternative label-based display anchored to the chart is also available for those who prefer that format.
Trend Persistence Option
By default, the regime is recalculated on every bar. An optional persistence mode changes this behavior so that the regime only changes on EMA crossovers. This reduces regime flipping during choppy conditions but may delay regime recognition during gradual trend changes.
How to Use
Monitor the Money Line color and information panel for current regime. In bullish regimes, focus on buy signals at the lower Donchian band as potential pullback entries. In bearish regimes, focus on sell signals at the upper band as potential short entries or exit points.
Use the ADX strength indicator to gauge signal reliability. Signals during trending conditions (blue ADX bar) have historically higher success rates than signals during ranging conditions (orange bar) or weak trends (white bar).
Watch BBWP for volatility context. Low BBWP readings suggest a significant move may be developing, while high readings indicate the current move may be overextended.
The combination of regime awareness, Donchian breakout signals, and ADX/RSI filtering provides a structured approach to identifying trading opportunities across different market conditions.
Settings Guidance
The default settings work well for cryptocurrency and forex markets on intraday timeframes. For stocks or longer timeframes, consider increasing the EMA periods and Donchian lookback. The ADX threshold can be adjusted based on the typical ADX range for the traded instrument.
The RSI filter levels can be relaxed (higher oversold, lower overbought) for more signals or tightened for higher-quality but less frequent signals. The cooldown period should be adjusted based on timeframe, with shorter timeframes typically requiring longer cooldown periods.

Chimera [theUltimator5]In myth, the chimera is an “impossible” hybrid—lion, goat, and serpent fused into one—striking to look at and formidable in presence. The word has come to mean a beautiful, improbable union of parts that shouldn’t work together, yet do.
Chimera is a dual-mode market context tool that blends a multi-input oscillator with classic ADX/DI trend strength, plus optional multi-timeframe “gap-line” tracking. Use it to visualize regime (trend vs. range), momentum swings around an adaptive midline, and higher timeframe (HTF) reference levels that auto-terminate on touch/cross.
Modes
1) Oscillator view
A smoothed composite of five common inputs—RSI, MACD (oscillator), Bollinger position, Stochastic, and an ATR/DI-weighted bias. Each is normalized to a comparable 0–100 style scale, averaged, and plotted as a candle-style oscillator (short vs. long smoothing, wickless for clarity). A dynamic midline with standard-deviation bands frames neutral → bearish/bullish zones. Colors ramp from neutral to your chosen Oversold/Overbought endpoints; consolidation can override to white.
Here is a description of the (5) signals used to calculate the sentiment oscillator:
RSI (14): Measures recent momentum by comparing average gains vs. losses. High = strength after advances; low = weakness after declines. (Z-score normalized to 0–100.)
MACD oscillator (12/26/9): Uses the difference between MACD and its signal (histogram) to gauge momentum shifts. Positive = bullish tilt; negative = bearish. (Z-score normalized.)
Bollinger Bands position (20, 2): Locates price within the bands (0–100 from lower → upper). Near upper suggests strength/expansion; near lower suggests weakness/contraction. (Then normalized.)
Stochastic (14, 3, 3): Shows where the close sits within the recent high-low range, smoothed via %D. Higher values = closes near highs; lower = near lows. (Scaled 0–100.)
ATR/DI composite (14): Volatility-weighted directional bias: (+DI − −DI) amplified by ATR as a % of price and its relative average. Positive = bullish pressure with volatility; negative = bearish. (Rank/scale normalized.)
All five are normalized and averaged into one composite, then smoothed (short/long) and compared to an adaptive midline with bands.
2) ADX view
Shows ADX, +DI, –DI with user-defined High Threshold. Transparency and color shift with regime. When ADX is strong, a directional “fire/ice” gradient fills the area between ADX and the high threshold, biased toward the dominant DI; when ADX is weak, a soft white fade highlights low-trend conditions.
HTF gap-line tracking (optional; both modes)
Detects “gap-like” reference levels after weak-trend consolidation flips into a sudden DI jump.
Anchors a line at the event bar’s open and auto-terminates upon first touch/cross (tick-size tolerance).
Auto-selects up to three higher timeframes suited to your chart resolution and prints non-overlapping lines with labels like 1H / 4H / 1D. Lower-priority duplicates are suppressed to reduce clutter.
Confirmation / repaint notes
Signals and lines finalize on bar close of the relevant timeframe.
HTF elements update only on the HTF bar close. During a forming bar they may appear transiently.
Line removal finalizes after the bar that produced the touch/cross closes.
Visual cues & effects
Oscillator candles: Open/High = long smoothing; Low/Close = short smoothing (no wicks).
Adaptive bands: Midline ± StdDev Multiplier × stdev of the blended series.
Consolidation tint: Optional white backdrop/candles when the consolidation condition is true (balance + low ADX).
Breakout VFX (optional): With strong DI/ADX and Bollinger breaks, renders a subtle “fire” flare above upper-band thrusts or “ice” shelf below lower-band thrusts.
Inputs (high-level)
Visual Style: Oscillator or ADX.
General (Oscillator): Lookback Period, Short/Long Smoothing, Standard Deviation Multiplier.
Color (Oscillator): Oversold/Overbought colors for gradient endpoints.
Plot (Oscillator): Show Candles, Show Slow MA Line, Show Individual Component (RSI/MACD/BB/Stoch/ATR).
Table (Oscillator): Show Information Table & position (compact dashboard of component values + status).
ADX / Gaps / VFX (both modes): ADX High Threshold, Highlight Backgrounds, Show Gap Labels, Visual Overlay Effects, and color choices for current-TF & HTF lines.
HTF selection: Automatic ladder (3 tiers) based on your chart timeframe.
Alerts (built-in)
Buy Signal – Primary: Oscillator exits oversold.
Sell Signal – Primary: Oscillator exits overbought.
Gap Fill Line Created (Any TF)
Gap Fill Line Terminated (Any TF)
ADX Crossed ABOVE/BELOW Low Threshold
ADX Crossed ABOVE/BELOW High Threshold
Consolidation Started
Alerts evaluate on the close of the relevant timeframe.
How to read it (quick guide)
Pick your lens: Oscillator for blended momentum around an adaptive midline; ADX for trend strength and DI skew.
Watch extremes & mean re-entries (Oscillator): Approaches to the top/bottom band show persistent momentum; returns toward the midline show normalization.
Check regime (ADX): Below Low = low-trend; above High = strong trend, with “fire/ice” bias toward +DI/–DI.
Track gap lines: Fresh labels mark new reference levels; lines auto-remove on first interaction. HTF lines add context but finalize only on HTF close.
The uniqueness from this indicator comes from multiple areas:
1. A unique multi-timeframe algorithm detects gap fill zones and plots them on the chart.
2. Visual effects for both visual modes were hand crafted to provide a visually stunning and intuitive interface.
3. The algorithm to determine sentiment uses a unique blend of weight and sensitivity adjustment to create a plot with elastic upper and lower bounds based off historical volatility and price action.
