Candle Range-BarsThe Candle Range Bars indicator visually represents the range of each candlestick in either pips or ticks, depending on your preference. It plots vertical bars to show the size of each candle, making it easy to identify periods of high or low volatility. The indicator also displays the exact range value (in pips or ticks) above each bar, with customizable text size and color for better readability.
Key Features
Pips or Ticks Mode:
Choose to display the candle range in pips (for forex traders) or ticks (for other instruments).
Customizable Text:
Adjust the text color and text size (Tiny, Small, Normal, Large) to suit your chart style.
Clear Visuals:
Bars are colored green for bullish candles and red for bearish candles, making it easy to distinguish between up and down moves.
Flexible Use:
Ideal for analyzing volatility, identifying consolidation zones, and comparing candle ranges across different timeframes.
How to Use:
Add the indicator to your chart.
Customize the settings:
Choose between pips or ticks.
Adjust the text color and text size for the range values.
Observe the bars and their corresponding range values to analyze market volatility.
Why Use This Indicator?:
Simplify Range Analysis: Quickly see the size of each candlestick without manual calculations.
Customizable: Tailor the appearance to match your trading style.
Versatile: Works on any instrument and timeframe.
Settings:
Show Pips (Otherwise Ticks): Toggle between pips and ticks mode.
Text Color: Choose the color of the range value text.
Text Size: Select the size of the range value text (Tiny, Small, Normal, Large).
Ideal For:
Forex, stocks, commodities, and crypto traders.
Traders who focus on volatility and range analysis.
Anyone looking for a clear and customizable way to visualize candle ranges.
This description highlights the key features, benefits, and usability of your indicator, making it appealing to other TradingView members. Let me know if you'd like to tweak it further! 😊
ค้นหาในสคริปต์สำหรับ "Candlestick"

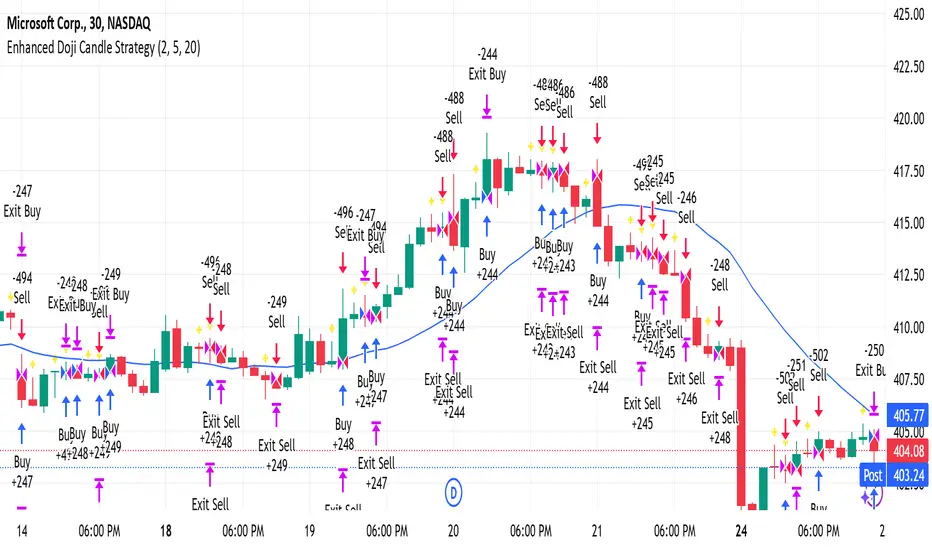
Enhanced Doji Candle StrategyYour trading strategy is a Doji Candlestick Reversal Strategy designed to identify potential market reversals using Doji candlestick patterns. These candles indicate indecision in the market, and when detected, your strategy uses a Simple Moving Average (SMA) with a short period of 20 to confirm the overall market trend. If the price is above the SMA, the trend is considered bullish; if it's below, the trend is bearish.
Once a Doji is detected, the strategy waits for one or two consecutive confirmation candles that align with the market trend. For a bullish confirmation, the candles must close higher than their opening price without significant bottom wicks. Conversely, for a bearish confirmation, the candles must close lower without noticeable top wicks. When these conditions are met, a trade is entered at the market price.
The risk management aspect of your strategy is clearly defined. A stop loss is automatically placed at the nearest recent swing high or low, with a tighter distance of 5 pips to allow for more trading opportunities. A take-profit level is set using a 2:1 reward-to-risk ratio, meaning the potential reward is twice the size of the risk on each trade.
Additionally, the strategy incorporates an early exit mechanism. If a reversal Doji forms in the opposite direction of your trade, the position is closed immediately to minimize losses. This strategy has been optimized to increase trade frequency by loosening the strictness of Doji detection and confirmation conditions while still maintaining sound risk management principles.
The strategy is coded in Pine Script for use on TradingView and uses built-in indicators like the SMA for trend detection. You also have flexible parameters to adjust risk levels, take-profit targets, and stop-loss placements, allowing you to tailor the strategy to different market conditions.
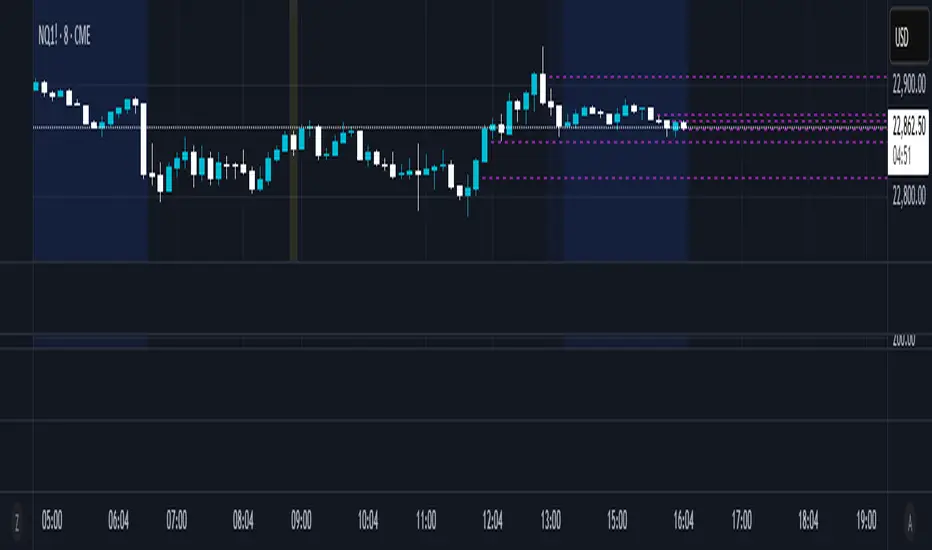
Half Candle RetraceThis custom indicator draws a horizontal line at the 50% retracement level of each candlestick on the chart. It calculates the midpoint between the high and low of each candle, which is often used by traders to identify potential entry, exit and take-profit levels. Once price action returns to an untouched level, the line will be removed, leaving only the levels where price action is still missing.
Key Features:
Timeframe: Works on all timeframes.
Line Color: Customize the line color to suit your charting preferences.
Line Width: Adjust the thickness of the retracement line for better visibility.
Line Style: Choose between solid, dotted, or dashed lines.
Up/Down Candle Selection: Option to only display retracement lines for up (bullish) candles, down (bearish) candles, or both.
Full Customization: Control the transparency (opacity) of the line for enhanced visual clarity.
Simple Setup: No complicated settings – simply choose your preferred color, line style, and visibility options.
This indicator is perfect for traders who prefer to use price action and retracement levels to identify potential trade opportunities.
How It Works:
The indicator automatically calculates the 50% level (midpoint) for each candlestick, drawing a line at this level. It will only draw lines for candles that match your chosen criteria (up or down candles), ensuring the chart remains clean and relevant to your trading strategy. Lines are automatically removed as soon as price crosses them.
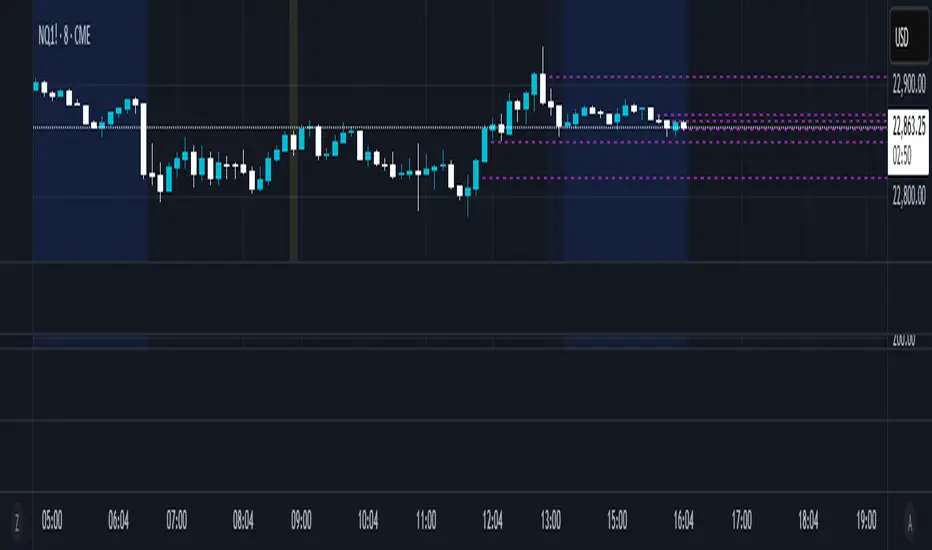
50% Candle RetraceThis custom indicator draws a horizontal line at the 50% retracement level of each candlestick on the chart. It calculates the midpoint between the high and low of each candle, which is often used by traders to identify potential entry, exit and take-profit levels. Once price action returns to an untouched level, the line will be removed, leaving only the levels where price action is still missing.
Key Features:
Timeframe: Works on all timeframes.
Line Color: Customize the line color to suit your charting preferences.
Line Width: Adjust the thickness of the retracement line for better visibility.
Line Style: Choose between solid, dotted, or dashed lines.
Up/Down Candle Selection: Option to only display retracement lines for up (bullish) candles, down (bearish) candles, or both.
Full Customization: Control the transparency (opacity) of the line for enhanced visual clarity.
Simple Setup: No complicated settings – simply choose your preferred color, line style, and visibility options.
This indicator is perfect for traders who prefer to use price action and retracement levels to identify potential trade opportunities.
How It Works:
The indicator automatically calculates the 50% level (midpoint) for each candlestick, drawing a line at this level. It will only draw lines for candles that match your chosen criteria (up or down candles), ensuring the chart remains clean and relevant to your trading strategy. Lines are automatically removed as soon as price crosses them.
CBC Strategy with Trend Confirmation & Separate Stop LossCBC Flip Strategy with Trend Confirmation and ATR-Based Targets
This strategy is based on the CBC Flip concept taught by MapleStax and inspired by the original CBC Flip indicator by AsiaRoo. It focuses on identifying potential reversals or trend continuation points using a combination of candlestick patterns (CBC Flips), trend filters, and a time-based entry window. This approach helps traders avoid false signals and increase trade accuracy.
What is a CBC Flip?
The CBC Flip is a candlestick-based pattern that identifies moments when the market is likely to change direction or strengthen its trend. It checks for a shift in price behavior between consecutive candles, signaling a bullish (upward) or bearish (downward) move.
However, not all flips are created equal! This strategy differentiates between Strong Flips and All Flips, allowing traders to choose between a more conservative or aggressive approach.
Strong Flips vs. All Flips
Strong Flips
A Strong Flip is a high-probability setup that occurs only after liquidity is swept from the previous candle’s high or low.
What is a liquidity sweep? This happens when the price briefly moves beyond the high or low of the previous candle, triggering stop-losses and trapping traders in the wrong direction. These sweeps often create fuel for the next move, making them powerful reversal signals.
Examples:
Long Setup: The price dips below the previous candle’s low (sweeping liquidity) and then closes higher, signaling a potential bullish move.
Short Setup: The price moves above the previous candle’s high and then closes lower, signaling a potential bearish move.
Why Use Strong Flips?
They provide fewer signals, but the accuracy is generally higher.
Ideal for trending markets where liquidity sweeps often mark key turning points.
All Flips
All Flips are less selective, offering both Strong Flips and additional signals without requiring a liquidity sweep.
This approach gives traders more frequent opportunities but comes with a higher risk of false signals, especially in sideways markets.
Examples:
Long Setup: A CBC flip occurs without sweeping the previous low, but the trend direction is confirmed (slow EMA is still above VWAP).
Short Setup: A CBC flip occurs without sweeping the previous high, but the trend is still bearish (slow EMA below VWAP).
Why Use All Flips?
Provides more frequent entries for active or aggressive traders.
Works well in trending markets but requires caution during consolidation periods.
How This Strategy Works
The strategy combines CBC Flips with multiple filters to ensure better trade quality:
Trend Confirmation: The slow EMA (20-period) must be positioned relative to the VWAP to confirm the overall trend direction.
Long Trades: Slow EMA must be above VWAP (upward trend).
Short Trades: Slow EMA must be below VWAP (downward trend).
Time-Based Filter: Traders can specify trading hours to limit entries to a particular time window, helping avoid low-volume or high-volatility periods.
Profit Target and Stop-Loss:
Profit Target: Defined as a multiple of the 14-period ATR (Average True Range). For example, if the ATR is 10 points and the profit target multiplier is set to 1.5, the strategy aims for a 15-point profit.
Stop-Loss: Uses a dynamic, candle-based stop-loss:
Long Trades: The trade closes if the market closes below the low of two candles ago.
Short Trades: The trade closes if the market closes above the high of two candles ago.
This approach adapts to recent price behavior and protects against unexpected reversals.
Customizable Settings
Strong Flips vs. All Flips: Choose between a more selective or aggressive entry style.
Profit Target Multiplier: Adjust the ATR multiplier to control the distance for profit targets.
Entry Time Range: Define specific trading hours for the strategy.
Indicators and Visuals
Fast EMA (10-Period) – Black Line
Slow EMA (20-Period) – Red Line
VWAP (Volume-Weighted Average Price) – Orange Line
Visual Labels:
▵ (Triangle Up) – Marks long entries (buy signals).
▿ (Triangle Down) – Marks short entries (sell signals).
Credits
CBC Flip Concept: Inspired by MapleStax, who teaches this concept.
Original Indicator: Developed by AsiaRoo, this strategy builds on the CBC Flip framework with additional features for improved trade management.
Risks and Disclaimer
This strategy is for educational purposes only and does not constitute financial advice.
Trading involves significant risk and may result in the loss of capital. Past performance does not guarantee future results. Use this strategy in a simulated environment before applying it to live trading.

Reversal rehersal v1This indicator was designed to identify potential market reversal zones using a combination of RSI thresholds (shooting range/falling range), candlestick patterns, and Fair Value Gaps (FVGs). By combining all these elements into one indicator, it allow for outputting high probability buy/sell signals for use by scalpers on low timeframes like 1-15 mins, for quick but small profits.
Note: that this has been mainly tested on DE40 index on the 1 min timeframe, and need to be adjusted to whichever timeframe and symbol you intend to use. Refer to the backtester feature for checking if this indicator may work for you.
The indicator use RSI ranges from two timeframes to highlight where momentum is building up. During these areas, it will look for certain candlestick patterns (Sweeps as the primary one) and check for existance of fair value gaps to further enhance the hitrate of the signal.
The logic for FVG detection was based on ©pmk07's work with MTF FVG tiny indicator. Several major changes was implemented though and incorporated into this indicator. Among these are:
Automatically adjustments of FVG boxes when mitigated partially and options to extend/cull boxes for performance and clarity.
Backtesting Table (Experimental):
This indicator also features an optional simplified table to review historical theoretical performance of signals, including win rate, profit/loss, and trade statistics. This does not take commision or slippage into consideration.
Usage Notes:
Setup:
1. Add the indicator to your chart.
2. Decide if you want to use Long or Short (or both).
3. If you're scalping on ie. 1 min time frame, make sure to set FVG's to higher timeframes (ie. 5, 15, 60).
4. Enable the 'Show backtest results' and adjust the 'Signals' og 'Take profit' and 'Stop loss' values until you are satisfied with the results.
Use:
1. Setup an alert based on either of the 'BullishShooting range' or 'BearishFalling range' alerts. This will draw your attention to watch for the possible setups.
2. Verify if there's a significant imbalance prior to the signal before taking the trade. Otherwise this may invalidate the setup.
3. Once a signal is shown on the graph (either Green arrow up for buys/Red arrow down for sells) - you should enter a trade with the given 'Take profit' and 'Stop loss' values.
4. (optional) Setup an alert for either the Strong/Weak signals. Which corresponds to when one of the arrows are printed.
Important: This is the way I use it myself, but use at own risk and remember to combine with other indicators for further confluence. Remember this is no crystal ball and I do not guarantee profitable results. The indicator merely show signals with high probability setups for scalping.

Engulfing and ATR-Imbalance [odnac]This Pine Script indicator combines two powerful concepts—Engulfing Candlestick Patterns and ATR Imbalance—to identify potential market reversal points with increased precision.
Engulfing Candlestick Patterns:
Bullish Engulfing: Identified when a candle closes higher than it opens, and it completely engulfs the previous candle (previous close is lower than the current open, and previous high is lower than the current close).
Bearish Engulfing: Identified when a candle closes lower than it opens, and it completely engulfs the previous candle (previous close is higher than the current open, and previous low is higher than the current close).
Bar Coloring: These patterns are highlighted with a customizable color (light gray by default) to make them easily identifiable.
ATR-Based Imbalance:
The Average True Range (ATR) is used to measure market volatility, and this script checks if the current candle’s range (difference between high and low) exceeds a defined multiple of the ATR, indicating a possible imbalance.
Imbalance Detection: If the current candle’s range is greater than ATR * imbalance multiplier (default multiplier: 1.5), it is marked as an ATR imbalance.
Bar Coloring: Candles with a significant imbalance (greater range than the ATR-based threshold) are highlighted in yellow, indicating an outlier or extreme price movement.
Engulfing + ATR Imbalance:
When both a Bullish Engulfing pattern and an ATR Imbalance are detected, a green triangle up is plotted below the bar, signaling a potential bullish reversal.
Conversely, when both a Bearish Engulfing pattern and an ATR Imbalance occur, a red triangle down is plotted above the bar, signaling a potential bearish reversal.
User Inputs:
Engulfing Plot: Enable or disable the plotting of Engulfing Candles.
ATR Length: Set the period used to calculate the ATR (default is 5).
Imbalance Multiplier: Adjust the multiplier to define the threshold for ATR imbalance detection (default is 1.5).
Bar Colors: Customizable color for both Engulfing candles and Imbalance candles.
Engulfing & Imbalance Plot: Enable or disable plotting of the combined conditions (Engulfing + ATR Imbalance) with arrows.
How This Indicator Helps:
By combining price action patterns with volatility analysis, this indicator highlights high-probability reversal points where significant price movement (imbalance) coincides with a clear Engulfing pattern. Traders can use these signals to time entries or exits based on both price action and market volatility.

Swing & Day Trading Strategy dddddThis TradingView Pine Script is designed for swing and day trading, incorporating multiple technical indicators and tools to enhance decision-making. It calculates and plots exponential moving averages (EMAs) for 5, 9, 21, 50, and 200 periods to identify trends and crossovers. The Relative Strength Index (RSI) and Moving Average Convergence Divergence (MACD) provide momentum and overbought/oversold signals. The script dynamically identifies and marks support and resistance levels based on recent highs and lows, while also detecting and labeling key candlestick patterns such as bullish and bearish engulfing, doji, and hammer candles. Bullish and bearish signals are highlighted on the chart with green and red backgrounds, respectively, and alerts are generated to notify traders of these conditions. All visualizations, including EMAs, support/resistance lines, and candlestick labels, are overlaid directly on the stock chart for easy interpretation. This comprehensive approach assists traders in spotting potential trading opportunities effectively.

Exponential Avg Body Size Green vs RedDescription :
This indicator calculates and plots the Exponential Moving Average (EMA) of green and red candlestick body sizes, allowing traders to easily visualize market momentum and sentiment shifts. The script includes the following features:
Customizable EMA Period: Users can set the number of candles to calculate the EMA through an input setting, with a default value of 21.
Separate Green and Red Candle Averages: Differentiates between bullish (green) and bearish (red) candlestick movements, plotting them as distinct lines.
Dynamic Range Control: Users can adjust the chart range (e.g., -50 to 50) for better visibility of the plotted lines.
Baseline for Reference: A horizontal baseline at 0 serves as a visual aid for easier interpretation.
Standalone Indicator Pane: The script is designed to display in a separate pane, preventing overlap with the price chart.
Use Case:
This indicator is ideal for traders seeking to analyze the relative strength of bullish versus bearish price movements over a specific period. The separation of green and red averages helps identify trends, potential reversals, or shifts in momentum.

Engulfing Patterns & Inside Bar at NWOGEngulfing Patterns & Inside Bar at NWOG:
This indicator is designed to detect and display specific candlestick patterns (Bearish Engulfing, Bullish Engulfing, and Inside Bar) when they occur at the New Week Open Gap (NWOG). The indicator provides tiny dots plotted at the top of the candle for each detected pattern, keeping the chart clean and minimal. Below is a detailed description of the logic and components:
Candlestick Patterns Detected:
Bearish Engulfing:
A Bearish Engulfing pattern occurs when:
The current candle’s high is above the previous candle’s high.
The current candle’s close is below the previous candle’s low.
This pattern signals a potential downtrend and is marked by a red dot at the top of the candle.
Bullish Engulfing:
A Bullish Engulfing pattern occurs when:
The current candle’s low is below the previous candle’s low.
The current candle’s close is above the previous candle’s high.
This pattern signals a potential uptrend and is marked by a green dot at the top of the candle.
Inside Bar:
An Inside Bar pattern occurs when:
The current candle’s high is lower than the previous candle’s high.
The current candle’s low is higher than the previous candle’s low.
This pattern indicates a period of consolidation and possible breakout or breakdown, and is marked by a blue dot at the top of the candle.
New Week Open Gap (NWOG) Condition:
The patterns (Bearish Engulfing, Bullish Engulfing, and Inside Bar) are only considered valid if the candles occur within or touch the range of the New Week Open Gap (NWOG).
The NWOG is defined as the gap between:
The Friday close (previous week’s closing price).
The Monday open (current week’s opening price).
If the signal patterns (Bullish Engulfing, Bearish Engulfing, Inside Bar) align with the NWOG, a tiny dot is plotted at the top of the candle where the pattern occurs.
Visual Representation:
Red Dots: Indicate Bearish Engulfing signals that occur at the NWOG.
Green Dots: Indicate Bullish Engulfing signals that occur at the NWOG.
Blue Dots: Indicate Inside Bar Breakdown signals that occur at the NWOG.
Each dot is plotted as a tiny circle at the top of the candle, ensuring the chart remains minimal and clean without cluttering the view.
Key Features:
Minimal and Clean: The indicator only plots tiny dots at the top of the candles for the detected signals. No additional lines, labels, or other visual elements clutter the chart.
Customizable Signal Colors: Users can customize the colors for each signal type (Bearish Engulfing, Bullish Engulfing, and Inside Bar).
Alerts: Alerts are included for all detected patterns (Bullish Engulfing, Bearish Engulfing, Inside Bar) at the NWOG.
Alerts:
Bearish Engulfing Detected: Alerts when a Bearish Engulfing pattern occurs at the NWOG.
Bullish Engulfing Detected: Alerts when a Bullish Engulfing pattern occurs at the NWOG.
Inside Bar Breakdown Detected: Alerts when an Inside Bar Breakdown pattern occurs at the NWOG.
This indicator is helpful for traders who want to focus on clean, easy-to-spot patterns and trade based on market conditions near the New Week Open Gap (NWOG). The tiny dots ensure that only relevant signals are displayed without any distractions.
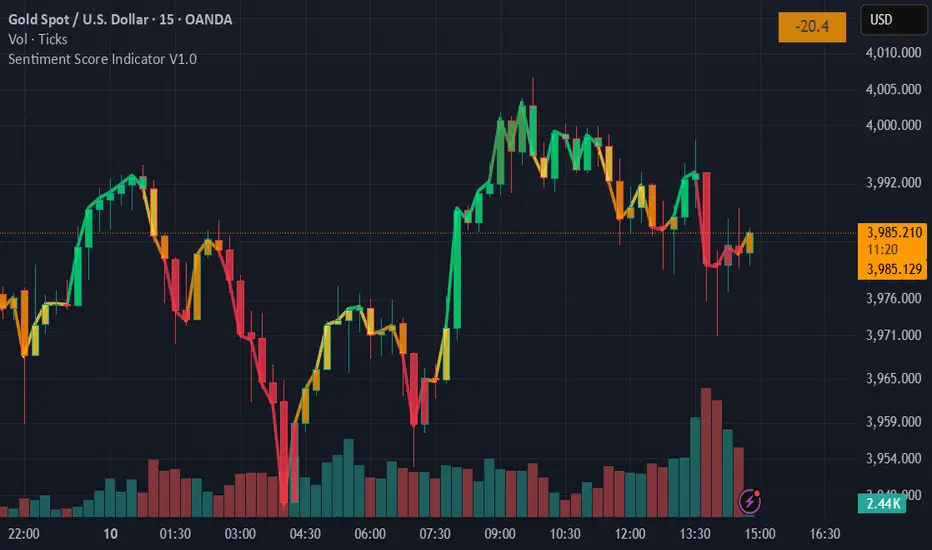
Sentiment Score Indicator V1.1Sentiment Score Indicator
The Sentiment Score Indicator attempts to gauge market sentiment by analyzing price action relative to Bollinger Bands and multiple Simple Moving Averages (SMAs). The indicator dynamically calculates a sentiment score ranging from -100 (Strong Bearish) to +100 (Strong Bullish) to provide insight into potential market direction and strength.
How the Sentiment Score is Calculated
The sentiment score is derived through a multi-step process that evaluates market conditions:
Bollinger Bands Analysis:
The script assesses the price’s position relative to the upper and lower Bollinger Bands.
When the price approaches or exceeds the upper band, it indicates potential overbought conditions and contributes to a bullish sentiment score.
Conversely, when the price nears or falls below the lower band, it signals potentially oversold conditions, contributing to a bearish sentiment score.
The magnitude of deviation from these bands influences the score, making it sensitive to volatility.
Moving Averages Evaluation:
The script incorporates multiple hardcoded SMAs to identify trends.
If the price is above these SMAs, the score is adjusted upward to reflect more bullish momentum.
If the price is below these SMAs, the score decreases to reflect more bearish momentum.
Each SMA provides a different perspective on short-term and long-term trends and are used in conjunction with determining the overall score at any given time.
Adaptive Scaling:
A scaling factor adjusts the sensitivity of the sentiment score based on market conditions.
This ensures the indicator remains responsive in both high-volatility and low-volatility environments.
Key Features
Dynamic Sentiment Score : Real-time sentiment ranging from Strong Bullish to Strong Bearish.
Combines Bollinger Bands and SMAs to assess overbought/oversold conditions and trend strength.
Color-Coded Labels: Intuitive color coding for quick interpretation of sentiment.
Works effectively on multiple time frames, including monthly, weekly, daily, intraday, and even down to 1-second chart data.
Toggle Option: Users can choose to display the sentiment score only on the last candle to reduce chart clutter.
Sentiment Score Ranges
Score Range Sentiment Color
+75 to +100 Strong Bullish Dark Green 🟩
+50 to +75 Bullish Green 🟩
+25 to +50 Medium Bullish Light Green 🟩
+10 to +25 Slightly Bullish Yellow-Green 🟨
-10 to +10 Neutral Yellow 🟨
-25 to -11 Slightly Bearish Orange-Yellow 🟧
-50 to -26 Medium Bearish Orange 🟧
-75 to -51 Bearish Dark Orange 🟥
-100 to -76 Strong Bearish Dark Red 🟥
How to Use
Add the Indicator to your preferred candlestick chart.
Interpret the Sentiment Labels displayed above or below each candlestick (you can toggle to only show the label on the last candle or all candles), this will be a numerical value accompanied by the range description (as per the above Sentiment Score Ranges).
Use the Color-Coded Scores to quickly gauge sentiment strength and direction.
Combine with Other Tools: For better analysis, use this indicator alongside other forms of technical analysis.
Disclaimer
This tool is for educational purposes only and does not constitute financial advice. Always conduct your own research and practice proper risk management.
Wick Detection (1 and 0) - AYNETDetailed Scientific Explanation
1. Wick Detection Logic
Definition of a Wick:
A wick, also known as a shadow, represents the price action outside the range of a candlestick's body (the region between open and close).
Upper Wick: Occurs when the high value exceeds the greater of open and close.
Lower Wick: Occurs when the low value is lower than the smaller of open and close.
Upper Wick Detection:
pinescript
Kodu kopyala
bool has_upper_wick = high > math.max(open, close)
This checks if the high price of the candle is greater than the maximum of the open and close prices. If true, an upper wick exists.
Lower Wick Detection:
pinescript
Kodu kopyala
bool has_lower_wick = low < math.min(open, close)
This checks if the low price of the candle is less than the minimum of the open and close prices. If true, a lower wick exists.
2. Binary Representation
The presence of a wick is encoded as a binary value for simplicity and computational analysis:
Upper Wick: Represented as 1 if present, otherwise 0.
pinescript
Kodu kopyala
float upper_wick_binary = has_upper_wick ? 1 : 0
Lower Wick: Represented as 1 if present, otherwise 0. This value is inverted (-1) for visualization purposes.
pinescript
Kodu kopyala
float lower_wick_binary = has_lower_wick ? 1 : 0
3. Visualization with Histograms
The plot function is used to create histograms for visualizing the binary wick data:
Upper Wicks: Plotted as positive values with green columns:
pinescript
Kodu kopyala
plot(upper_wick_binary, title="Upper Wick", color=color.new(color.green, 0), style=plot.style_columns, linewidth=2)
Lower Wicks: Plotted as negative values with red columns:
pinescript
Kodu kopyala
plot(lower_wick_binary * -1, title="Lower Wick", color=color.new(color.red, 0), style=plot.style_columns, linewidth=2)
Features and Applications
1. Wick Visualization:
Upper wicks are displayed as positive green columns.
Lower wicks are displayed as negative red columns.
This provides a clear visual representation of wick presence in historical data.
2. Technical Analysis:
Wick formations often indicate market sentiment:
Upper Wicks: Sellers pushed the price lower after buyers drove it higher, signaling rejection at the top.
Lower Wicks: Buyers pushed the price higher after sellers drove it lower, signaling rejection at the bottom.
3. Signal Generation:
Traders can use wick detection to build strategies, such as identifying key price levels or market reversals.
Enhancements and Future Improvements
1. Wick Length Measurement
Instead of binary detection, measure the actual length of the wick:
pinescript
Kodu kopyala
float upper_wick_length = high - math.max(open, close)
float lower_wick_length = math.min(open, close) - low
This approach allows for thresholds to identify significant wicks:
pinescript
Kodu kopyala
bool significant_upper_wick = upper_wick_length > 10 // For wicks longer than 10 units.
bool significant_lower_wick = lower_wick_length > 10
2. Alerts for Long Wicks
Trigger alerts when significant wicks are detected:
pinescript
Kodu kopyala
alertcondition(significant_upper_wick, title="Long Upper Wick", message="A significant upper wick has been detected.")
alertcondition(significant_lower_wick, title="Long Lower Wick", message="A significant lower wick has been detected.")
3. Combined Wick Analysis
Analyze both upper and lower wicks to assess volatility:
pinescript
Kodu kopyala
float total_wick_length = upper_wick_length + lower_wick_length
bool high_volatility = total_wick_length > 20 // Combined wick length exceeds 20 units.
Conclusion
This script provides a compact and computationally efficient way to detect candlestick wicks and represent them as binary data. By visualizing the data with histograms, traders can easily identify wick formations and use them for technical analysis, signal generation, and volatility assessment. The approach can be extended further to measure wick length, detect significant wicks, and integrate these insights into automated trading systems.

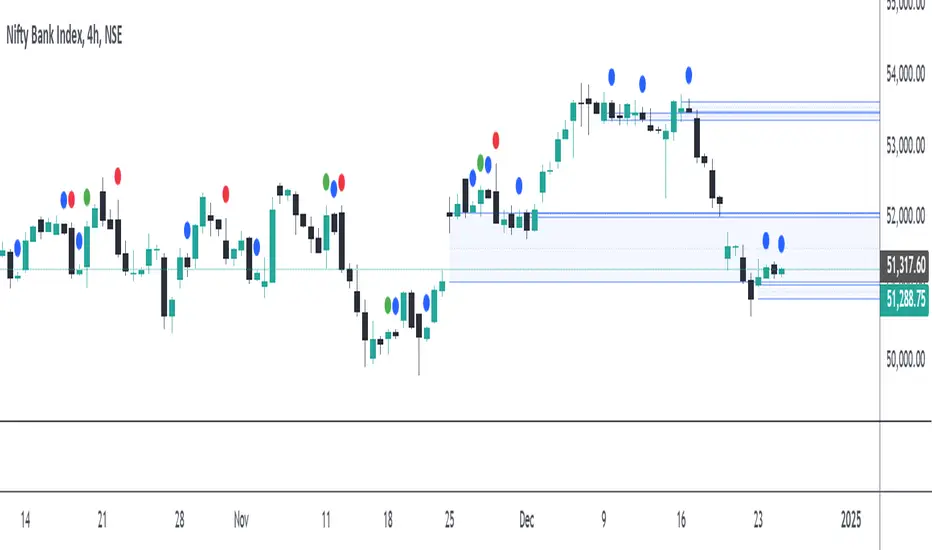
Bullish/Bearish Reversal Bars Indicator [Skyrexio]Introduction
Bullish/Bearish Reversal Bars Indicator leverages the combination of candlestick reversal bar pattern and the Williams Alligator indicator to help traders in understanding where there is a high probability of market reversal or correction. Indicator works for both bearish and bullish cases. It visualizes the bearish and bullish reversal bars with red and green dots and also plots the Alligator's lips to make it more convenient for traders to understand if price is above or below lips line (more information in "Methodology and it's justification" paragraph).
Features
Market Facilitation Index(MFI) filter: with the specified parameter in settings user can choose to filter bullish and bearish reversal bars which passed the MFI condition.
Awesome Oscillator(AO) filter: with the specified parameter in settings user can choose to filter bullish and bearish reversal bars which passed the AO condition.
Alerts: user can set up the alert and have notifications when bullish/bearish reversal bar has been printed.
Methodology and it's justification
In the script’s methodology, we apply the concepts of bullish and bearish reversal bars introduced by Bill Williams in his book Trading Chaos. So, what exactly is a bullish or bearish reversal bar? At its core, it’s a candlestick pattern. A bullish reversal bar is a bar that closes in its upper half, while a bearish reversal bar closes in its lower half.
Why is this type of bar significant? Let’s look at the bullish reversal bar as an example. When the price is trending upward, forming higher highs with each candle, and we suddenly see a bullish bar that makes a new high but ultimately closes in its lower half, it signals a shift in control. Bears have taken control toward the end of that candle's period, pushing the price back down. This can be interpreted as a sign of trend weakness and a potential reversal (or at least a correction).
An additional key point is that a reversal bar often indicates a possible end to the trend. Therefore, for a reversal bar to be valid, several preceding candles should show lower highs (for bullish bars) or higher lows (for bearish bars), reinforcing the likelihood of a trend change.
The second step on methodology is the location of the bar related to Williams Alligator. The Williams Alligator Indicator, developed by Bill Williams, is a technical analysis tool that helps traders identify trends and potential turning points in the market. It consists of three lines, often called the jaw, teeth, and lips of the alligator, each representing different moving averages:
Jaw (Blue Line): A slower moving average, typically a 13-period smoothed moving average shifted 8 bars into the future.
Teeth (Red Line): A medium moving average, typically an 8-period smoothed moving average shifted 5 bars into the future.
Lips (Green Line): A faster moving average, usually a 5-period smoothed moving average shifted 3 bars into the future.
When the three lines are spread out and moving in the same direction, it suggests a strong trend (the "alligator" is "awake and feeding"). When they intertwine, the indicator suggests that the market is moving sideways, or in a range, signaling a lack of clear trend (the "alligator" is "sleeping"). Traders use the Alligator Indicator to enter trades in trending markets and avoid trades in choppy, non-trending markets.
If bullish reversal bar's high is not below and bearish reversal bar's low is not above all three Alligator's lines (jaw, lips, teeth) they cannot be interpreted as these types of bars. It can be explained as following: if we are waiting for the bullish reversal bar it shall be reversal from downtrend. If price is not below all three lines it can't be interpret as the downtrend according to this method. The opposite is true for the bearish reversal bar.
All described above are obligatory conditions for reversal bar, now let's discuss two not obligatory conditions. The first one is Market Facilitation Index (MFI) restriction. Let's briefly look what is MFI. The Market Facilitation Index (MFI) is a technical indicator that measures the price movement per unit of volume, helping traders gauge the efficiency of price movement in relation to trading volume. Here's how you can calculate it:
MFI = (High−Low)/Volume
MFI can be used in combination with volume, so we can divide 4 states. Bill Williams introduced these to help traders interpret the interaction between volume and price movement. Here’s a quick summary:
Green Window (Increased MFI & Increased Volume): Indicates strong momentum with both price and volume increasing. Often a sign of trend continuation, as both buying and selling interest are rising.
Fake Window (Increased MFI & Decreased Volume): Shows that price is moving but with lower volume, suggesting weak support for the trend. This can signal a potential end of the current trend.
Squat Window (Decreased MFI & Increased Volume): Shows high volume but little price movement, indicating a tug-of-war between buyers and sellers. This often precedes a breakout as the pressure builds.
Fade Window (Decreased MFI & Decreased Volume): Indicates a lack of interest from both buyers and sellers, leading to lower momentum. This typically happens in range-bound markets and may signal consolidation before a new move.
For our purposes we are interested in squat bars. This is the sign that volume cannot move the price easily. This type of bar increases the probability of trend reversal. In this indicator we added to enable the MFI filter of reversal bars. If potential reversal bar or two preceding bars have squat state this bar can be interpret as a reversal one.
The second additional filter is Awesome Oscillator. The Awesome Oscillator (AO), developed by Bill Williams, is a momentum indicator that measures market momentum by comparing recent price action to a longer historical context. It helps traders identify potential trend reversals and the strength of trends. Formula:
AO = SMA5(Median Price) − SMA34(Median Price)
where:
Median Price = (High + Low) / 2
SMA5 = 5-period Simple Moving Average of the Median Price
SMA 34 = 34-period Simple Moving Average of the Median Price
If AO is decreasing momentum is bearish, if increasing - bullish. According to Bill Williams approach reversal bars are the potential trades against the trend. As a result we added second filter for bullish reversal bars AO shall be decreasing, for bearish increasing.
How to use indicator
Apply it to desired chart and time frame. It works on every time frame.
Setup the filters with the "Enable MFI" and "Enable AO" checkboxes in the settings. By default they are turned on.
Analyze the price action. Indicator plotted the white line, this is the lips of an Alligator. It will help you to understand how price is moving in comparison to lips line. Indicator will print the green dot and text "BULL" below it current bar is bullish reversal. It will print the red dot and text "BEAR" above it if current bar is interpreted by algorithm as a bearish reversal.
Set up the alerts if it's needed. Indicator has two custom alerts called "Bullish reversal bar has been printed" and "Bearish reversal bar has been printed"
Disclaimer:
Educational and informational tool reflecting Skyrex commitment to informed trading. Past performance does not guarantee future results. Test indicators before live implementation.

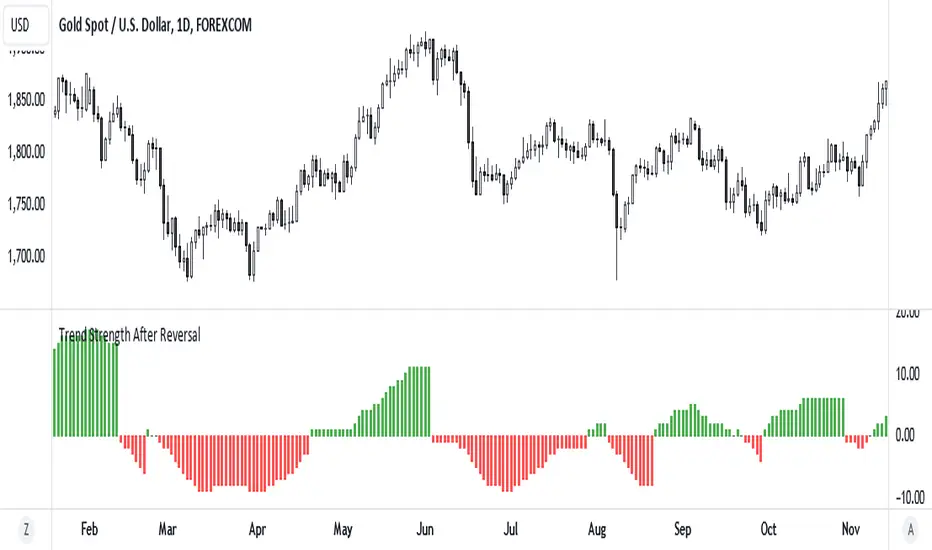
Trend Strength After Reversal
This indicator measures trend strength after the reversal.
It can catch early reversal based on engulfing candlestick pattern or just the regular reversal.
Every reversal have to be confirmed by a close above reversal pattern.
Trend strength is measured by counting subsequent closing confirming the reversal
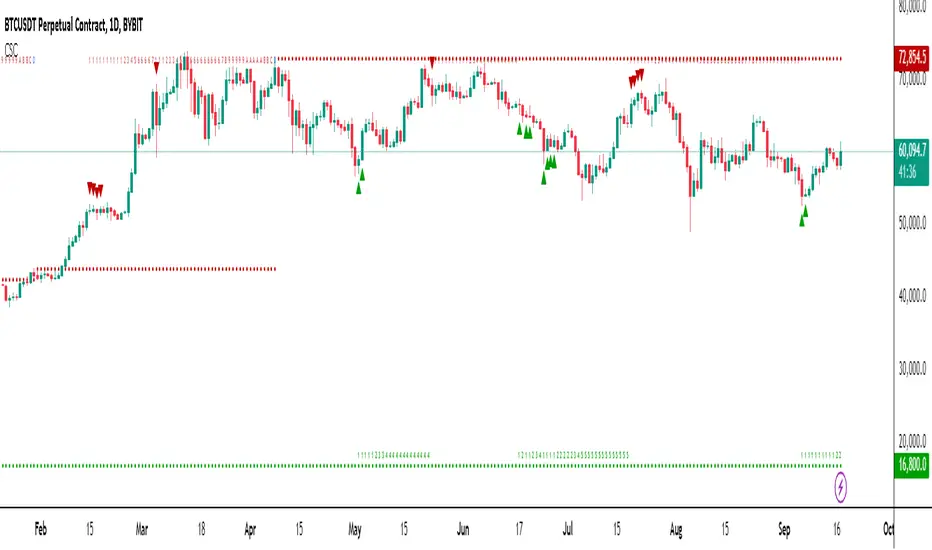
Chronos Sequential Compass (CSC)The Chronos Sequential Compass (CSC) is an advanced technical analysis tool used to identify potential price exhaustion points, trend reversals, and provide a framework for understanding market structure.
Key Components:
Setup Phase:
Bullish Setup: 9 consecutive closes lower than the close 4 bars earlier.
Bearish Setup: 9 consecutive closes higher than the close 4 bars earlier.
Visualized by green (bullish) or red (bearish) triangles on the chart.
Countdown Phase:
Starts after a Setup is completed.
Counts from 1 to 13(D), comparing the close to the low (for bullish) or high (for bearish) two bars earlier.
Displayed as numbers below (bullish) or above (bearish) the price bars.
Setups:
A Setup is complete when the low of bars 6 and 7 in a bullish Setup are exceeded by the low of bar 9.
For bearish Setups, the high of bars 6 and 7 must be exceeded by the high of bar 9.
Risk Levels:
Established when a Countdown reaches 13(D).
Acts as a reference point for potential trend reversals.
Countdown Delayed:
Indicated by a '+' symbol.
Occurs when a Countdown reaches 13(D) but doesn't meet specific criteria for completion.
Recycling:
Resets the Countdown if a strong opposite trend emerges during the Countdown phase.
How to Use the CSC:
Trend Identification:
Consecutive Setups in one direction indicate a strong trend.
Look for potential trend exhaustion when Setups start appearing in the opposite direction.
Potential Reversal Points:
Pay attention when a Countdown reaches 13, especially if it coincides with other technical factors (support/resistance, chart patterns, etc.).
A completed Countdown doesn't guarantee a reversal but suggests increased probability.
Risk Management:
Use Risk Levels as potential stop-loss points or profit-taking levels.
Be cautious of trades against the trend when price is far from the Risk Level.
Confluence with Price Action:
Look for candlestick patterns or chart formations at key Sequential levels for higher probability setups.
Timeframe Coordination:
Consider using CSC on multiple timeframes for a more comprehensive market view.
Higher timeframe signals often carry more weight.
Delayed Countdowns:
A delayed Countdown (indicated by '+') suggests the trend might continue.
It can provide opportunities for trend continuation trades.
Setup:
Setups often provide stronger signals and may lead to more significant moves.
Reversals should occur within 4 bars of setup signals
Completed Countdowns:
Reversals should occur within 12 bars of completed countdowns
Liquidity strategy tester [Influxum]This tool is based on the concept of liquidity. It includes 10 methods for identifying liquidity in the market. Although this tool is presented as a strategy, we see it more as a data-gathering instrument.
Warning: This indicator/strategy is not intended to generate profitable strategies. It is designed to identify potential market advantages and help with identifying effective entry points to capitalize on those advantages.
Once again, we have advanced the methods of effectively searching for liquidity in the market. With strategies, defined by various entry methods and risk management, you can find your edge in the market. This tool is backed by thorough testing and development, and we plan to continue improving it.
In its current form, it can also be used to test well-known ICT or Smart Money concepts. Using various methods, you can define market structure and identify areas where liquidity is located.
Fair Value Gaps - one of the entry signal options is fair value gaps, where an imbalance between buyers and sellers in the market can be expected.
Time and Price Theory - you can test this by setting liquidity from a specific session and testing entries as that liquidity is grabbed
Judas Swing - can be tested as a market reversal after a breakout during the first hours of trading.
Power of Three - accumulation can be observed as the market moving within a certain range, identified as cluster liquidity in our tool, manipulation occurs with the break of liquidity, and distribution is the direction of the entry.
🟪 Methods of Identifying Liquidity
Pivot Liquidity
This refers to liquidity formed by local extremes – the highest or lowest prices reached in the market over a certain period. The period is defined by a pivot number and determines how many candles before and after the high/low were higher/lower. Simply put, the pivot number represents the number of adjacent candles to the left and right, with a lower high for a pivot high and a higher low for a pivot low. The higher the number, the more significant the high/low is. Behind these local market extremes, we expect to find orders waiting for breakout as well as stop-losses.
Gann Swing
Similar to pivot liquidity, Gann swing identifies significant market points. However, instead of candle highs and lows, it focuses on the closing prices. A Gann swing is formed when a candle closes above (or below) several previous closes (the number is again defined by a strength parameter).
Percentage Change
Apart from ticks, percentages are also a key unit of market movement. In the search for liquidity, we monitor when a local high or low is formed. For liquidity defined by percentage change, a high must be a certain percentage higher than the last low to confirm a significant high. Similarly, a low must be a defined percentage away from the last significant high to confirm a new low. With the right percentage settings, you can eliminate market noise.
Session Range (3x)
Session range is a popular concept for finding liquidity, especially in smart money concepts (SMC). You can set up liquidity visualization for the Asian, London, or New York sessions – or even all three at once. This tool allows you to work with up to three sessions, so you can easily track how and if the market reacts to liquidity grabs during these sessions.
Tip for traders: If you want to see the reaction to liquidity grab during a specific session at a certain time (e.g., the well-known killzone), you can set the Trading session in this tool to the exact time where you want to look for potential entries.
Unfinished Auction
Based on order flow theory, an unfinished auction occurs when the market reverses sharply without filling all pending orders. In price action terms, this can be seen as two candles at a local high or low with very similar or identical highs/lows. The maximum difference between these values is defined as Tolerance, with the default setting being 3 ticks. This setting is particularly useful for filtering out noise during slower market periods, like the Asian session.
Double Tops and Bottoms
A very popular concept not only from smart money concepts but also among price pattern traders is the double bottom and double top. This occurs when the market stops and reverses at a certain price twice in a row. In the tool, you can set how many candles apart these bottoms/tops can be by adjusting the Length parameter. According to some theories, double bottoms are more effective when there is a significant peak between the two bottoms. You can set this in the tool as the Swing value, which defines how large the movement (expressed in ticks) must be between the two peaks/bottoms. The final parameter you can adjust is Tolerance, which defines the possible price difference between the two peaks/bottoms, also expressed in ticks.
Range or Cluster Liquidity
When the market stays within a certain price range, there’s a chance that breakout orders and stop-losses are accumulating outside of this range. Our tool defines ranges in two ways:
Candle balance calculates the average price within a candle (open, high, low, and close), and it defines consolidation when the centers of candles are within a certain distance from each other.
Overlap confirms consolidation when a candle overlaps with the previous one by a set percentage.
Daily, Weekly, and Monthly Highs or Lows
These options simply define liquidity as the previous day’s, week’s, or month’s highs or lows.
Visual Settings
You can easily adjust how liquidity is displayed on the chart, choosing line style, color, and thickness. To display only uncollected liquidity, select "Delete grabbed liquidity."
Liquidity Duration
This setting allows you to control how long liquidity areas remain valid. You can cancel liquidity at the end of the day, the second day, or after a specific number of candles.
🟪 Strategy
Now we come to the part of working with strategies.
Max # of bars after liquidity grab – This parameter allows you to define how many candles you can search for entry signals from the moment liquidity is grabbed. If you are using engulfing as an entry signal, which consists of 2 candles, keep in mind that this number must be at least 2. In general, if you want to test a quick and sharp reaction, set this number as low as possible. If you want to wait for a structural change after the liquidity grab, which may require more candles, set the number a bit higher.
🟪 Strategy - entries
In this section, we define the signals or situations where we can enter the market after liquidity has been taken out.
Liquidity grab - This setup triggers a trade immediately after liquidity is grabbed, meaning the trade opens as the next candle forms.
Close below, close above - This refers to situations where the price closes below liquidity, but then reverses and closes above liquidity again, suggesting the liquidity grab was a false breakout.
Over bar - This occurs when the entire candle (high and low) passes beyond the liquidity level but then experiences a pullback.
Engulfing - A popular price action pattern that is included in this tool.
2HL - weak, medium, strong - A variation of a popular candlestick pattern.
Strong bar - A strong reactionary candle that forms after a liquidity grab. If liquidity is grabbed at a low, this would be a strong long candle that closes near its high and is significantly larger compared to typical volatility.
Naked bar - A candlestick pattern we’ve tested that serves as a good confirmation of market movement.
FVG (Fair Value Gap) - A currently popular concept. This is the only signal with additional settings. “Pending FVG order valid” means if a fair value gap forms after a liquidity grab, a limit order is placed, which remains valid for a set number of candles. “FVG minimal tick size” allows you to filter based on the gap size, measured in ticks. “GAP entry model” lets you decide whether to place the limit order at the gap close or its edge.
🟪 Strategy - General
Long, short - You can choose whether to focus on long or short trades. It’s interesting to see how long and short trades yield different results across various markets.
Pyramiding - By default, the tool opens only one trade at a time. If a new signal arises while a trade is open, it won’t enter another position unless the pyramiding box is checked. You also need to set the maximum number of open trades in the Properties.
Position size - Simply set the size of the traded position.
🟪 Strategy - Time
In this section, you can set time parameters for the strategy being tested.
Test since year - As the name implies, you can limit the testing to start from a specific year.
Trading session - Define the trading session during which you want to test entries. You can also visualize the background (BG) for confirmation.
Exclude session - You can set a session period during which you prefer not to search for trades. For example, when the New York session opens, volatility can sharply increase, potentially reducing the long-term success rate of the tested setup.
🟪 Strategy - Exits
This section lets you define risk management rules.
PT & SL - Set the profit target (PT) and stop loss (SL) here.
Lowest/highest since grab - This option sets the stop loss at the lowest point after a liquidity grab at a low or at the highest point after a liquidity grab at a high. Since markets usually overshoot during liquidity grabs, it’s good practice to place the stop loss at the furthest point after the grab. You can also set your risk-reward ratio (RRR) here. A value of 1 sets an RRR of 1:1, 2 means 2:1, and so on.
Lowest/highest last # bars - Similar to the previous option, but instead of finding the extreme after a liquidity grab, it identifies the furthest point within the last number of candles. You can set how far back to look using the # bars field (for an engulfing pattern, 2 is optimal since it’s made of two candles, and the stop loss can be placed at the edge of the engulfing pattern). The RRR setting works the same way as in the previous option.
Other side liquidity grab - If this option is checked, the trade will exit when liquidity is grabbed on the opposite side (i.e., if you entered on a liquidity grab at a low, the trade will exit when liquidity is grabbed at a high).
Exit after # bars - A popular exit strategy where you close the position after a set number of candles.
Exit after # bars in profit - This option exits the trade once the position is profitable for a certain number of consecutive candles. For example, if set to 5, the position will close when 5 consecutive candles are profitable. You can also set a maximum number of candles (in the max field), ensuring the trade is closed after a certain time even if the profit condition hasn’t been met.
🟪 Alerts
Alerts are a key tool for traders to ensure they don’t miss trading opportunities. They also allow traders to manage their time effectively. Who would want to sit in front of the computer all day waiting for a trading opportunity when they could be attending to other matters? In our tool, you currently have two options for receiving alerts:
Liquidity grabs alert – if you enable this feature and set an alert, the alert will be triggered every time a candle on the current timeframe closes and intersects with the displayed liquidity line.
Entry signals alert – this feature triggers an alert when a signal for entry is generated based on the option you’ve selected in the Entry type. It’s an ideal way to be notified only when a trading opportunity appears according to your predefined rules.

Cutrim TheoryCutrim Theory
Created by Dalpiaz-BR , this indicator is based on the Probabilistic Theory developed by the renowned Brazilian trader Ronal Cutrim. The indicator aims to provide a detailed analysis of market imbalances and candlestick patterns across different timeframes, utilizing multi-timeframe data and dynamic information tables. It is designed to help traders identify favorable market conditions and make informed decisions in their trades.
Indicator Description
The Cutrim Theory is an advanced indicator that combines candlestick pattern analysis, and market imbalances to give a clear view of market conditions. The tool uses multi-timeframe data and displays dynamic tables to facilitate visual analysis on the main chart and histogram.
Key Features:
Multi-Timeframe Imbalance Analysis:
The indicator calculates buy and sell imbalances based on the number of green and red candles in different timeframes.
Users can choose to display all imbalances, only the last imbalance, or turn off this feature.
Dynamic and Flexible Tables:
Main Table: Shows detailed data for different timeframes, such as the percentage of bullish and bearish candles, the size of the last candle, and the average candle size.
Dynamic Table Position: The table on the main chart can be set to automatically move based on the current price position (upper or lower). Users can also manually set the position.
Histogram Table: Displays a summary of key information in an additional table on the histogram.
Visualization of Averages and Candle Sizes:
Displays histograms and moving average lines for candle sizes, providing a clear visualization of current market volatility.
Imbalance Signals:
The indicator also adds "Buy" and "Sell" labels directly on the main chart when an imbalance is detected, helping traders spot trading opportunities.
Customizable Settings:
Imbalance Options: "Turn Off All," "Last Imbalance," or "All Imbalances."
Main Table Positions: "top_left," "top_right," "bottom_left," "bottom_right," or "Dynamic."
Signal Messages: Customize the "Buy" and "Sell" messages.
Benefits:
Provides a clear and intuitive view of market conditions across multiple timeframes.
Facilitates the detection of imbalances and market shifts.
Highly configurable to meet the needs of different types of traders.
This script is a powerful addition to any trader's toolbox who seeks a detailed and multi-timeframe analysis based on Ronal Cutrim's Probabilistic Theory. Enjoy and adjust according to your trading style!

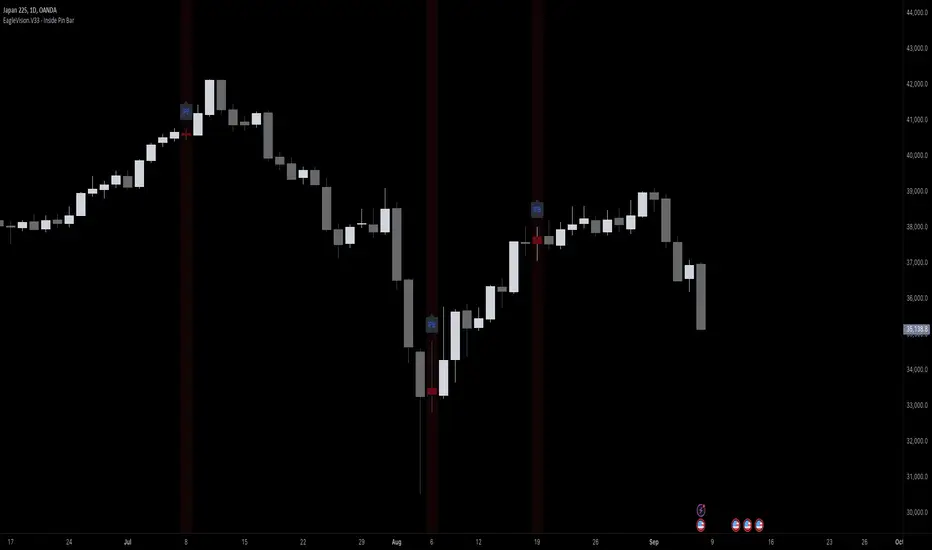
EagleVision.V33 - Inside Pin Bar EagleVision.V33 is a specialized indicator designed for traders who focus on price action. It detects and highlights the Inside Pin Bar candle pattern, a key signal that can indicate potential market reversals or trend continuations. This tool is invaluable for traders who rely on precise candlestick patterns to make data-driven decisions.
Features:
• Customizable Pattern Highlighting: EagleVision.V33 allows traders to choose custom colors to highlight Inside Pin Bar patterns directly on the chart. This makes identifying critical trading signals straightforward, even in busy market conditions.
• Pin Bar Candle Customization: Beyond just highlighting, the indicator enables users to change the color of the detected pin bar itself, ensuring that crucial patterns are immediately visible and easy to track.
• Versatile Timeframe Application: The indicator can be applied across various timeframes, from intraday (1 minute, 5 minutes) to longer-term charts (daily, weekly). Users can easily switch between timeframes within the settings, making it adaptable to different trading strategies.
• Enhanced Visual Clarity with Background Highlighting: For traders who prefer additional emphasis, EagleVision.V33 offers an option to apply a background color that highlights the entire region where the Inside Pin Bar pattern is detected.
How It Works:
• Inside Bar Identification: The indicator first identifies an Inside Bar, where a candle’s high and low fall within the range of the preceding candle (the mother bar). This is a foundational pattern in price action trading.
• Pin Bar Detection: It then checks if the candle is a Pin Bar, characterized by a small body and a prominent wick (either upper or lower), which typically signals potential market turning points.
• Pattern Highlighting & Visualization: Upon detecting both conditions (Inside Bar and Pin Bar), EagleVision.V33 highlights the pattern using customizable shapes and colors, and optionally applies a background shade to further enhance visibility.
Use Cases:
• Reversals at Key Levels: The Inside Pin Bar pattern often appears at significant support or resistance levels, signaling potential reversals. EagleVision.V33 helps traders spot these opportunities early.
• Trend Continuations: In trending markets, this pattern can confirm the continuation of a trend, providing traders with the confidence to hold positions or enter new ones.
Customization Options:
• Pattern Highlight Color: Choose a distinct color for the label or shape that marks the Inside Pin Bar pattern, making it stand out against other chart elements.
• Pin Bar Candle Color: Customize the color of the Pin Bar itself, ensuring that it is immediately recognizable on the chart.
• Background Highlighting: Optionally apply a background color to the chart area where the pattern is detected, further enhancing visual clarity and making it easier to spot potential trading opportunities.
Why EagleVision.V33 Stands Out:
EagleVision.V33 is not just another pattern detection tool; it’s engineered for precision and clarity, with highly customizable features that cater to the unique needs of price action traders. By combining both Inside Bar and Pin Bar detection, it offers a powerful edge, providing traders with actionable insights directly on their charts.
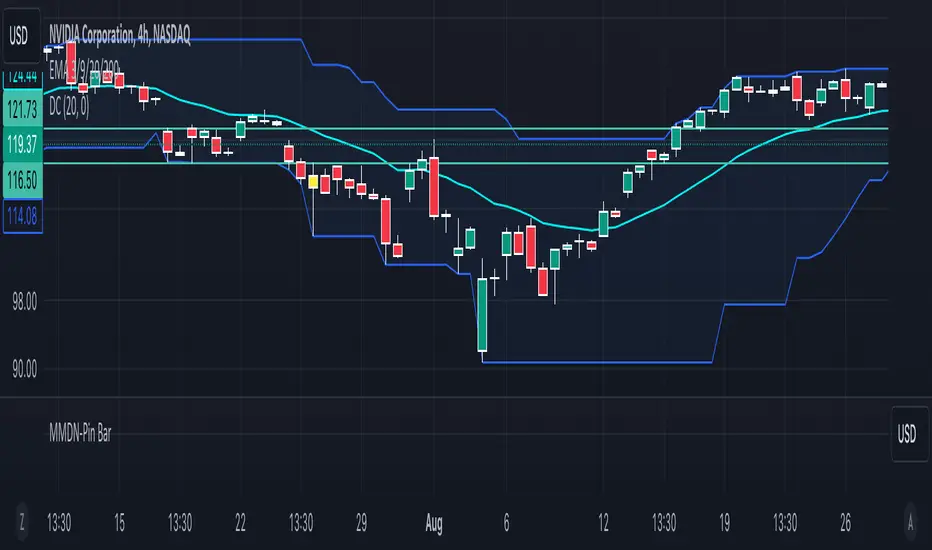
MMDN-Pin BarThis Pine Script code is designed to highlight Pin Bars on a TradingView chart by changing their color to yellow. A Pin Bar is a type of candlestick pattern that typically indicates a potential reversal in the market. The script uses specific conditions to identify bullish and bearish Pin Bars based on the size of the candlestick body and the length of the shadows (wicks).
1. Calculate Body and Shadows:
body: The absolute difference between the close and open prices.
upshadow: The upper shadow, calculated differently depending on whether the close is higher or lower than the open.
downshadow: The lower shadow, calculated similarly.
2. Define Pin Bar Conditions:
pinbar_h: Identifies a bullish Pin Bar if the previous candle's close is greater than its open, the previous candle's body is larger than the current candle's body, the upper shadow is more than half the size of the body, and the upper shadow is more than twice the size of the body.
pinbar_l: Identifies a bearish Pin Bar with similar conditions but for the lower shadow.
Set Pin Bar Color:
barcolor: Changes the color of the identified Pin Bars to yellow.
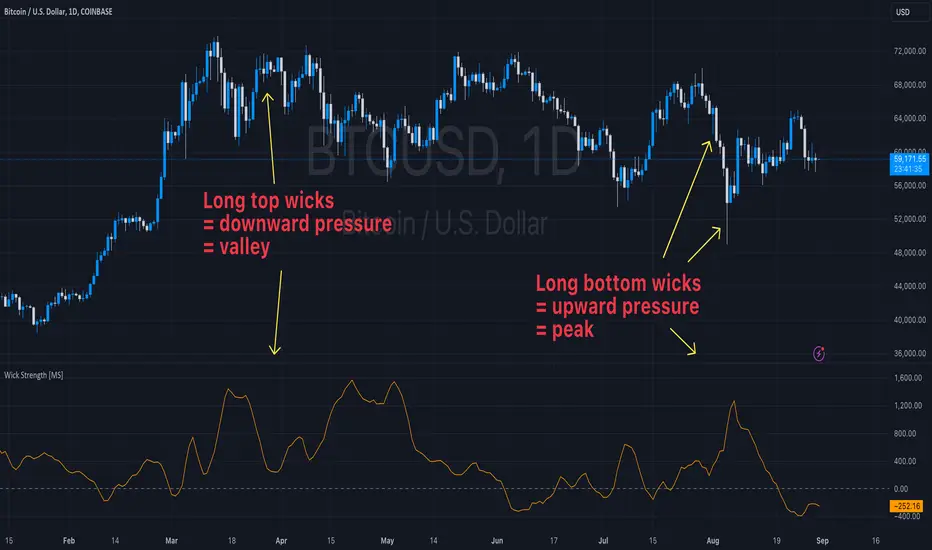
Wick Strength [MS]Overview
The Wick Strength indicator is a unique script designed to measure and visualize the relative strength of candlestick wicks over time. By analyzing the relationship between upper and lower wicks, this indicator provides insights into potential market dynamics and price action patterns.
How It Works
The Wick Strength indicator calculates the "strength" of candlestick wicks by comparing the upward and downward movements within each candle's range. This calculation results in a dynamic line plot that represents the evolving wick strength across your chosen timeframe.
Strength is not range-bound, allowing the score to reach extremes and be compared relatively across time.
Interpretation
Positive values indicate stronger upper wicks (potential bearish pressure)
Negative values suggest stronger lower wicks (potential bullish pressure)
Extreme readings might signal overextended moves or potential reversals
Key Features
Measures relative wick strength candle by candle
Smooths the values by summation based on user preference
Adaptable to all timeframes and markets
Potential Applications
While extensive backtesting has not been performed, the Wick Strength indicator may offer valuable insights for:
Identifying potential divergences between price action and wick strength
Spotting changes in market sentiment or volatility
Complementing other technical analysis tools for a more comprehensive trading approach
Developing unique trading strategies based on wick behavior
Artaking 2Components of the Indicator:
Moving Averages:
Short-Term Moving Average (MA): This is a 50-period Simple Moving Average (SMA) applied to the closing price. It is used to track the short-term trend of the market.
Long-Term Moving Average (MA): This is a 200-period SMA used to track the long-term trend.
Day Trading Moving Average: A 20-period SMA is used specifically for day trading signals, focusing on shorter-term price movements.
Purpose:
The crossing of these moving averages (short-term crossing above or below long-term) provides basic buy and sell signals, indicative of potential trend reversals or continuations.
ADX (Average Directional Index) for Trend Strength:
ADX Calculation: The ADX is calculated using a 14-period length with 14-period smoothing. The ADX value indicates the strength of a trend, regardless of direction.
Strong Trend Condition: The indicator considers a trend to be strong if the ADX value is above 25. This threshold helps filter out trades during weak or sideways markets.
Purpose:
To ensure that the strategy only generates signals when there is a strong trend, thus avoiding whipsaws in low volatility or range-bound conditions.
Support Levels:
Support Level Calculation: The indicator calculates the lowest close over the last 100 periods. This level is used to identify significant support zones where the price might find a floor.
Purpose:
Support levels are critical in identifying potential areas where the price might bounce, making them ideal for setting stop losses or identifying buy opportunities.
Volatility Spike (Proxy for News Trading):
ATR (Average True Range) Calculation: The indicator uses a 14-period ATR to measure market volatility. A volatility spike is identified when the ATR is greater than 1.5 times the 14-period SMA of the ATR.
Purpose:
This serves as a proxy for news events or other sudden market movements that could make the market unpredictable. The indicator avoids generating signals during these periods to reduce the risk of being caught in a volatile, potentially news-driven move.
Fibonacci Retracement Levels:
61.8% Fibonacci Level: Calculated from the highest high and lowest low over the long MA period, this retracement level is widely regarded as a significant support or resistance level.
Purpose:
Position traders often use Fibonacci levels to identify potential reversal points. The indicator incorporates the 61.8% level to fine-tune entries and exits.
Candlestick Patterns for Price Action Trading:
Bullish Engulfing Pattern: A bullish reversal pattern where a green candle fully engulfs the previous red candle.
Bearish Engulfing Pattern: A bearish reversal pattern where a red candle fully engulfs the previous green candle.
Purpose:
These patterns are classic signals used in price action trading to identify potential reversals at key levels, especially when they align with other conditions like support/resistance or Fibonacci levels.
Signal Generation:
The indicator generates buy and sell signals by combining the above elements:
Buy Signal:
A buy signal is triggered when:
The short-term MA crosses above the long-term MA (indicating a potential uptrend).
The trend is strong (ADX > 25).
The current price is near or below the 61.8% Fibonacci retracement level, suggesting a potential reversal.
No significant volatility spike is detected, ensuring the market isn’t reacting unpredictably to news.
Sell Signal:
A sell signal is triggered when:
The short-term MA crosses below the long-term MA (indicating a potential downtrend).
The trend is strong (ADX > 25).
The current price is near or above the 61.8% Fibonacci retracement level, suggesting potential resistance.
No significant volatility spike is detected.
Day Trading Signals:
Independent of the main trend signals, the indicator also generates intraday buy and sell signals when the price crosses above or below the 20-period day trading MA.
Price Action Signals:
The indicator can trigger buy or sell signals based purely on price action, such as the occurrence of bullish or bearish engulfing patterns. This is optional and can be enabled or disabled.
Alerts:
The indicator includes built-in alert conditions that notify the trader when a buy or sell signal is generated. This allows traders to act immediately without having to constantly monitor the charts.
Practical Application:
This indicator is versatile and can be used across various trading styles:
Position Trading: The long-term MA, Fibonacci retracement, and ADX provide a solid foundation for identifying long-term trends and potential entry/exit points.
Day Trading: The short-term MA and day trading MA offer quick signals for intraday trading.
Price Action: Candlestick pattern recognition allows for precise entry points based on market sentiment and behavior.
News Trading: The volatility spike filter helps avoid trading during periods of market instability, often driven by news events.
Conclusion:
The Comprehensive Trading Strategy Indicator is a robust tool designed to help traders navigate various market conditions by integrating multiple strategies into a single, coherent framework. It provides clear, actionable signals while filtering out potentially dangerous trades during volatile or weak market conditions. Whether you're a long-term trader, a day trader, or someone who relies on price action, this indicator can be a valuable addition to your trading toolkit.

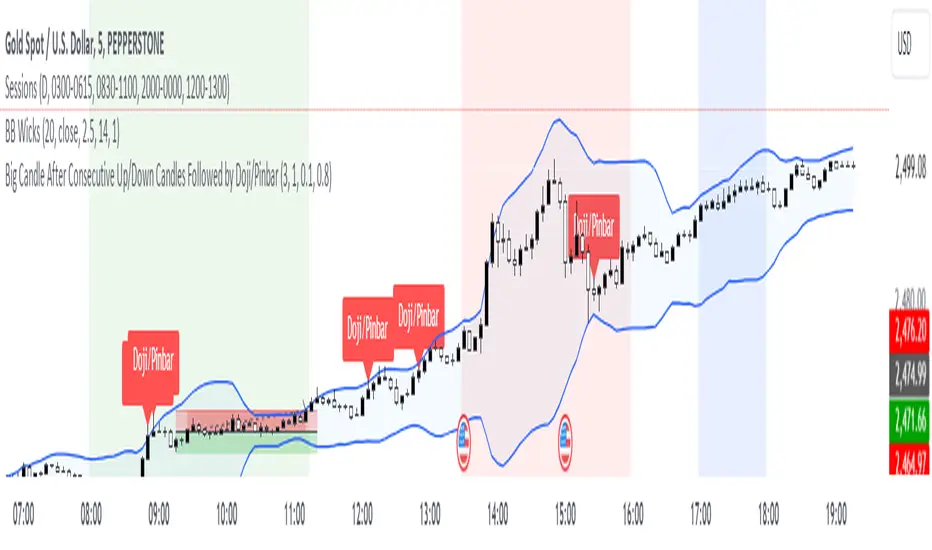
Big Bar Followed by Doji/PinbarUsed find doji/pinbars after a Big candle showing the potential Morning/Evening star formation after x amount of consecutive up moves.
1. Doji Threshold (dojiThreshold)
What is a Doji?: A doji is a candlestick pattern where the opening and closing prices are very close to each other. It represents indecision in the market.
Threshold Explanation: The dojiThreshold is used to define what qualifies as a doji by comparing the size of the candle's body (the difference between the opening and closing prices) to the total range of the candle (the difference between the high and low prices).
How it works:
The formula in the script checks if the absolute difference between the close and open is less than or equal to a percentage of the entire candle's range.
Example: If the dojiThreshold is set to 0.1 (or 10%), this means that for a candle to be considered a doji, the size of the body (the difference between the open and close) must be 10% or less of the total candle's range (the difference between the high and low prices).
In other words, if the body is small enough (based on the threshold), the candle is considered a doji.
2. Pinbar Body Size (pinbarBodySize)
What is a Pinbar?: A pinbar (short for "pinocchio bar") is a candlestick pattern with a small body and a long wick (or shadow) on one side, indicating a potential reversal. The longer wick represents a rejection of a certain price level.
Body Size Explanation: The pinbarBodySize defines the maximum proportion of the candle's total range that the body can occupy for the candle to be considered a pinbar.
How it works:
The script compares the size of the body to the total range of the candle.
Example: If pinbarBodySize is set to 0.3 (or 30%), the body of the candle must be 30% or less of the total range for it to be considered a pinbar. This ensures that the candle has a small body and, therefore, a relatively long wick on one side.
The script then checks whether the longer wick is on the upper or lower side of the candle to determine if it's a valid pinbar pattern.
Summary:
Doji: The dojiThreshold parameter sets how close the open and close prices need to be relative to the candle's range for the candle to be considered a doji.
Pinbar: The pinbarBodySize parameter sets the maximum size of the body relative to the candle's total range to qualify it as a pinbar.
Both of these thresholds are adjustable in the script, allowing you to fine-tune what qualifies as a doji or pinbar based on your trading style and the market conditions you're analyzing.
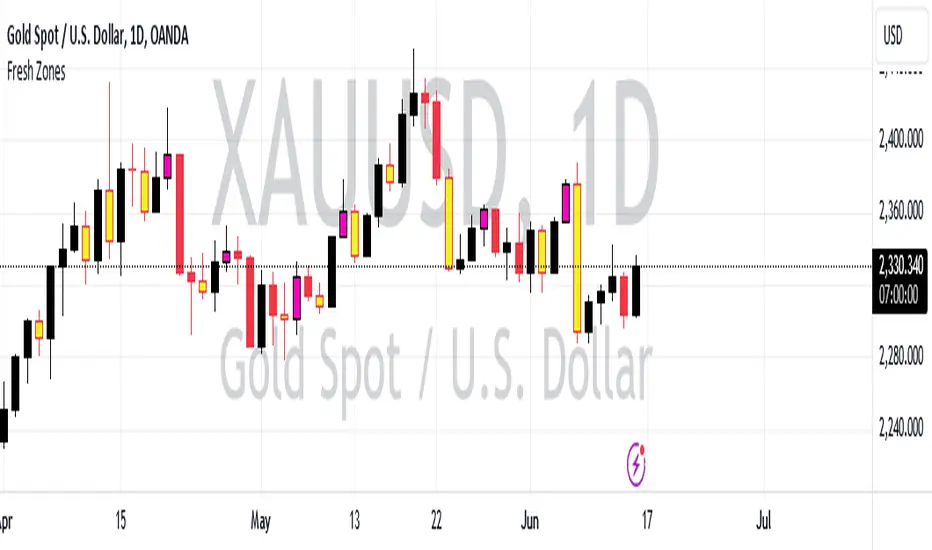
Fresh Zones The indicator is named "Fresh Zones"
Bullish Fresh Zone:
- This part looks for a specific pattern in the price movement that indicates a potential bullish (upward) trend.
- It checks if the current bar's low price is higher than the previous bar's opening price.
- It also checks if the previous bar's closing price was higher than its opening price.
- Additionally, it checks if the bar before the previous one had a closing price lower than its opening price.
- If all these conditions are met, it identifies a bullish fresh zone.
Bearish Fresh Zone:
- This part looks for a specific pattern in the price movement that indicates a potential bearish (downward) trend.
- It checks if the current bar's high price is lower than the previous bar's opening price.
- It also checks if the previous bar's closing price was lower than its opening price.
- Additionally, it checks if the bar before the previous one had a closing price higher than its opening price.
- If all these conditions are met, it identifies a bearish fresh zone.
Color Coding:
- When a bullish fresh zone is identified, it colors the candlestick from two bars ago with a specific yellowish color (`color.rgb(240, 243, 33)`).
- When a bearish fresh zone is identified, it colors the candlestick from two bars ago with a specific pink color (`color.rgb(255, 0, 191)`).
Alert:
- The script creates an alert condition.
- If either a bullish or bearish fresh zone pattern appears, it triggers an alert with the message "A Fresh zone has appeared!".