CandlesticksCandlesticks Patterns based on Encyclopedia of Candlestick Charts by Thomas N. Bulkowski
// Green = Bullish / Red = Bearish / Orange = Continuation //
ค้นหาในสคริปต์สำหรับ "Candlestick"

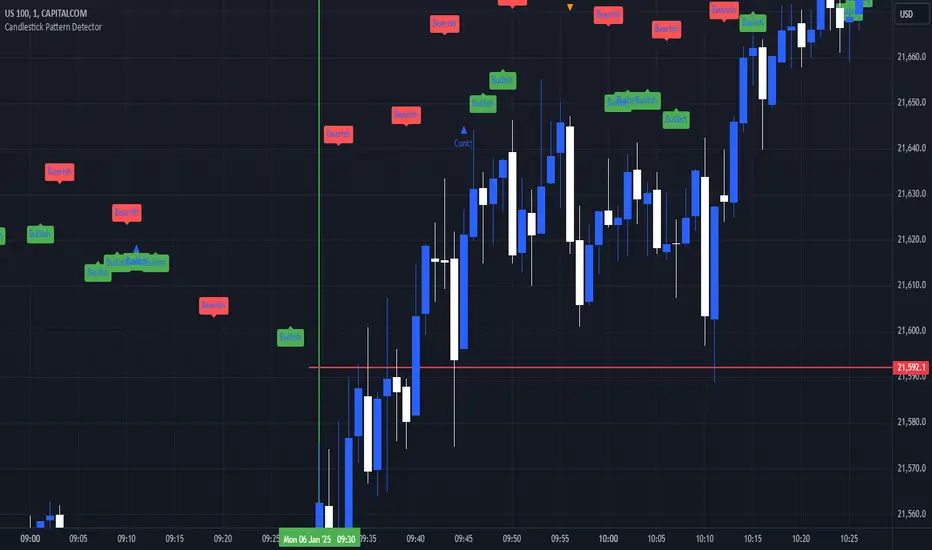
Candlestick Pattern DetectorCandlestick Pattern Detector
Overview
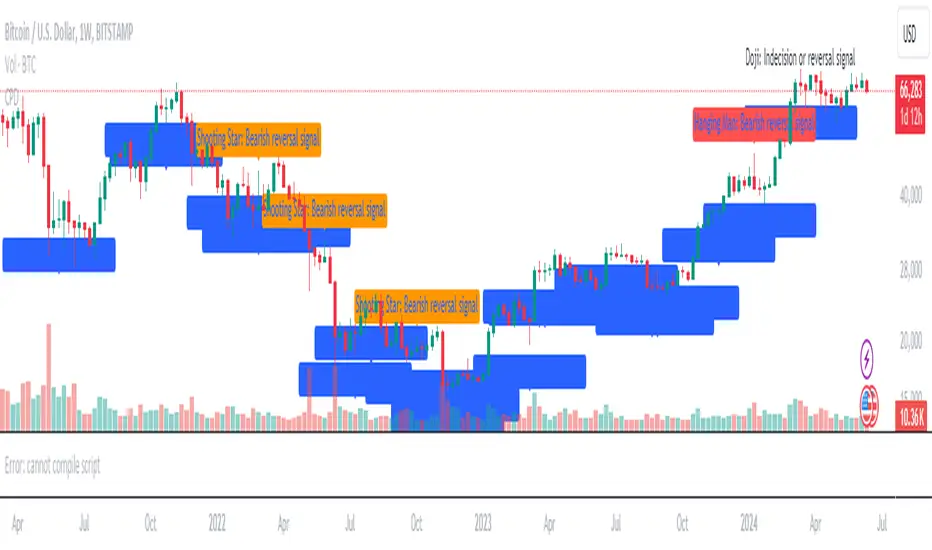
Welcome to the Candlestick Pattern Detector, a powerful tool designed to help traders identify key candlestick patterns on any chart. This indicator detects some of the most significant candlestick patterns and provides brief descriptions directly on the chart, making it easier for you to interpret market signals and make informed trading decisions.
Detected Patterns
Doji
Description: A Doji indicates market indecision. It occurs when the open and close prices are very close, suggesting a balance between bullish and bearish forces.
Signal: Possible trend reversal or continuation depending on the context.
Hammer
Description: A Hammer appears at the bottom of a downtrend, characterized by a small body and a long lower wick. It suggests that buyers are stepping in to push prices higher.
Signal: Bullish reversal.
Hanging Man
Description: The Hanging Man occurs at the top of an uptrend with a small body and a long lower wick. It indicates that selling pressure is starting to take over.
Signal: Bearish reversal.
Shooting Star
Description: The Shooting Star appears at the top of an uptrend with a small body and a long upper wick, indicating that buyers are losing control and sellers may push prices down.
Signal: Bearish reversal.
How to Use
Add to Chart: Click on the "Indicators" button in TradingView, search for "Candlestick Pattern Detector," and add it to your chart.
Visual Signals: The indicator will automatically mark detected patterns with labels on your chart.
Interpret Patterns: Use the brief descriptions provided with each detected pattern to understand market sentiment and potential price movements.
Conclusion
The Candlestick Pattern Detector is a helpful tool for traders of all levels, providing clear and concise information about key candlestick patterns. By integrating this indicator into your trading strategy, you can enhance your ability to read price action and make better trading decisions.
Candlestick Pattern Identifier (Extended + Alerts)Candlestick Pattern Identifier (Extended + Alerts)


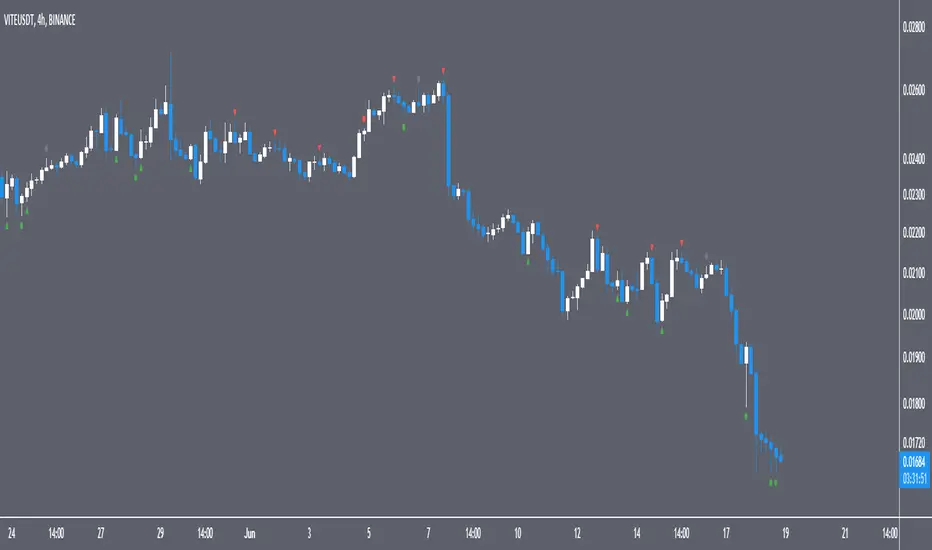
Candlesticks Not Touching EMA 3 & EMA 5 ScannerCandlesticks Not Touching EMA 3 & EMA 5 Scanner
Short Title: EMA Scanner
Overview
This indicator scans for candlesticks that do not touch the EMA 3 and EMA 5, highlighting potential trading opportunities where price action is significantly distanced from these moving averages. It identifies momentum-based entries and helps traders spot strong trends.
How It Works
It checks if the candle's high and low are completely above or below both EMAs (3 & 5).
It ensures that the distance between the candle and EMA 5 is at least a user-defined multiple of the candle range.
When a valid candle is detected, a triangle marker appears below (for long trades) or above (for short trades).
Trade Execution Strategy
Entry:
Long Entry → Break of the candle’s high
Short Entry → Break of the candle’s low
Stop Loss:
Long SL → Low of the same candle
Short SL → High of the same candle
Target: EMA 5
Additional Features
✅ Plots EMA 3 (Blue) and EMA 5 (Red) for reference
✅ Marks potential long and short trades with arrows
✅ Detects & plots when Target or Stop Loss is hit
✅ Alerts for valid signals, target hits, and stop loss hits
Best Use Cases
🔹 Suitable for intraday & swing traders looking for momentum-based trades
🔹 Works well in trending markets
🔹 Helps identify mean-reversion & breakout opportunities
🚀 Use this indicator to refine your trading setups & boost your market edge! 🚀

Candlestick Patterns Backtester [Optimized]Candlestick Patterns Backtester
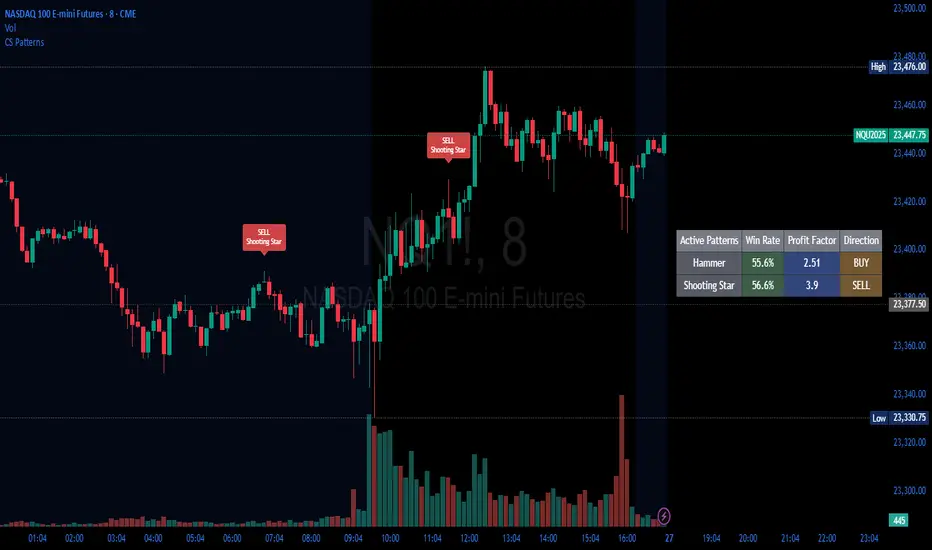
What this is: This indicator is based on a really cool candlestick pattern backtester that I found (I'll update this later when I remember where I got it from or find the actual author). The original had this massive table showing win/loss ratios for a bunch of candlestick patterns, and according to the built-in backtester, it was actually profitable - which was pretty impressive.
The Problem: I played around with the original for a while but honestly wasn't really able to get it to work well at all for actual trading. It was still pretty cool to look at though! The main issues were:
It was just a big static table - hard to do anything useful with it
Couldn't send signals out to other strategies
The code was a monster - like 2,000+ lines of repetitive mess
What I Did: I completely refactored this thing and got it down from 2,000+ lines to just a few hundred lines. Much cleaner now! Here's what it does:
45+ Candlestick Patterns - All the classics are in there
Dynamic Filtering - Set your own requirements (minimum win rate, profit factor, total trades, etc.)
Flexible Logic - Choose AND/OR logic for your filters
Signal Generation - Creates actual buy/sell signals you can use with other strategies
Visual Badges - Shows pattern badges on chart when they meet your criteria
Active Patterns Table - Only shows patterns that are currently profitable based on your settings
Settings You Can Adjust:
Minimum win rate threshold
Minimum profit factor
Minimum number of trades required
Whether to use AND or OR logic for filtering
Colors, badge display, debug options
Reality Check: Trading these patterns really wasn't for me, but it was still a great learning experience. The backtesting results look good on paper, but as always, past performance doesn't guarantee future results. Use this as a research tool and educational resource more than anything else.
Credit: This is based on someone else's original work that I heavily modified and optimized. I'll update this description once I track down the original author to give proper credit where it's due.
This introduction captures your casual, honest tone while explaining the technical improvements you made and setting realistic expectations about the indicator's practical use.
Candlestick Entry SystemCandlestick Entry System
Green: (dark green)
– Strong and growing trend, bullish momentum.
– This is the most favorable scenario for long trading.
Red:
– Strong trend but downward momentum.
– Possible correction within an uptrend or the start of weakness.
Blue:
– Weak or sideways trend but upward momentum.
– Typically a rebound or recovery without clear trend strength.
Yellow:
– Weak trend and bearish momentum.
– Market in a range or bearish consolidation.
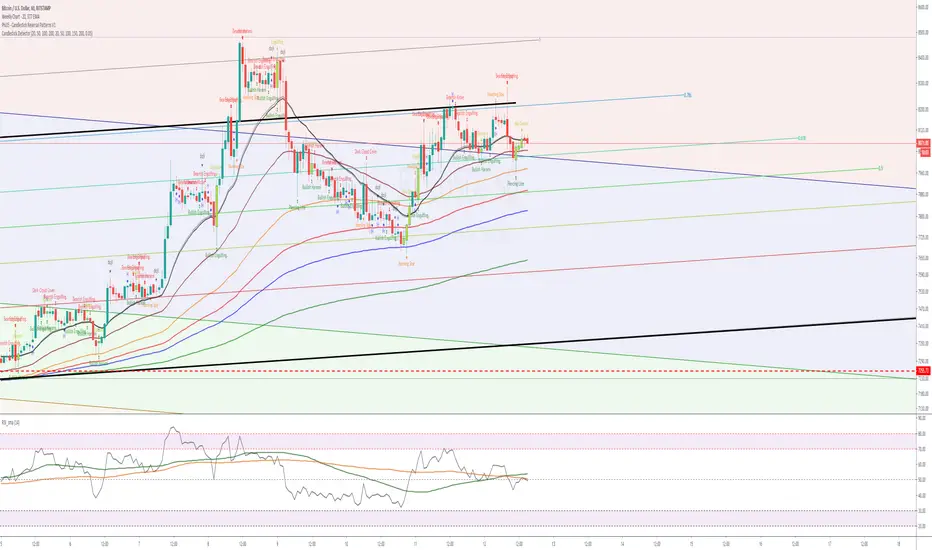
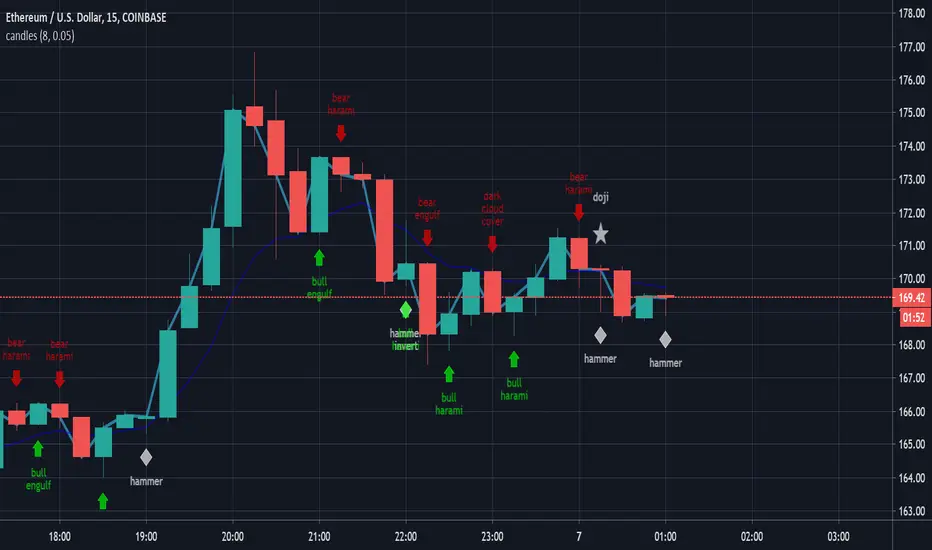
CandlesticksIndicator that identifies the classical candlestick patterns for markets that are open 24/7 like the crypto market.
Why? because those markets don't gap, so many patterns won't need to gap to be valid.
Also, the theoretical rules about the patterns are very strict but it is to the discretion of the trader or technical analyst to decide if the patterns are yet valid. This is how Steve Nison uses candlesticks, i.e. a hammer is still valid if it has a small upper shadow, a marubozu is still valid if it has tiny shadows, etc.
So, for each candlestick pattern there are tolerance parameters so you can decide what is an acceptable upper shadow size for a hammer etc. I have set them to my liking but you might want to adjust them which is totally fine.
Additional features:
-to avoid the clutter, decide how many candles have to be analyzed
-use a trend filter based on the ema 5 (you can change the value) so you only see reversal patterns relevant to the trend
-plot pivots (swings HL)
-volume confirmation: bearish signals don't need volume confirmation as prices fall off their own weight. But volume confirmation for bullish price action can serve as added confluence. You have a setting that allows you to decide how many times the volume needs to be bigger than the previous candle's volume : if you have a bullish candlestick pattern printed, if the volume is1.5 times bigger than the previous candle then you will have a shape plotted at the bottom of your chart
-there is a cheap vs expensive feature that colors the bars
-you can also color the background so you see the oversold/overbought RSI
-finally, there are a couple of custom signals
"RULES" ABOUT CANDLESTICKS
-this is not a system in itself, but combined with other candlesticks (cluster of candlesticks), volume, oscillators, trend lines, support and resistances, bollinger bands can give amazing results and that is where the magic is
-most candlesticks can establish a support or resistance or confirm one
-a reversal candlestick doesn't mean that market will shoot the other direction right away, trend changes occur usually slowly and the trend might not reverse but convert in a period of sideways. It shouldn't actually be named reversal patterns but rather trend change patterns.
-reversal patterns need a trend to reverse (or change), in ranging markets you should ignore the signals
-you might think that there are many false signals, you need to understand that they are early warnings and the next candle's close is of major importance. A hammer at the end of a downtrend isn't enough to enter a position, you will have to wait for the next candle to close above the high of the hammer to validate the bullish reversal and vice versa.
-some signals are based on 1 candle only (like the hammer) others on 2 candles (like the engulfing pattern), others on 3 and more (tower top, morning star, etc). Patterns based on multiple candles have more probability.
-you might want to wait for price to revisit the support created by the pattern (read below) to get a better entry
-candles do not provide price targets
-long lower shadows is bullish, long upper shadows is bearish, small bodies (spinning tops, stars, dojis) means indecision and market is vulnerable to a trend change and the color of the body is irrelevant, declining size of bodies means trend strength weakening
HAMMER
stop-loss under the lower shadow
lower shadow can become a potential support or confirm an existing support
ENGULFING
with bearish engulfing pattern use the highest high of the 2 candles as a resistance, and with bullish engulfing pattern use the lowest low as support
DARK CLOUD COVER
use the highest high of the 2 candles as resistance
PIERCING PATTERN
use the lowest low of the 2 candles as support
MORNING STAR
use the lowest low of the 3 candles as support
the smaller the body of the 2nd candle the more potent the signal
for traditional markets, an ideal morning star would have a gap between 2nd and 3rd candles' bodies
EVENING STAR
use the highest high of the 3 candles as resistance
the smaller the body of the 2nd candle the more potent the signal
HARAMI
the smaller the size of the candle the more potent the signal
TWEEZERS
very important signals by themselves on weekly and monthly charts
for daily and intraday signals, it is potent only if it meets additional criterias (1st candle long, 2nd short, a candle pattern with with same highs or lows)
BELT-HOLD
they are more important if they confirm a support or resistance or another belt-hold or if they have not appeared for a while.
3 BLACK CROWS AND 3 WHITE SOLDIERS
candles 1 and 2 should act as support for the 3WS and as resistance for the 3BC
RISING AND FALLING 3 METHODS
stop-loss is the low of the 1st candle that started the rising 3 methods
stop-loss is the high of the 1st candle that started the falling 3 methods
ideally 1st and last candles have the strongest volume
DOJI
signal is reinforced by subsequent candles, if market is oversold or overbought, if the market doesn't have many doji on the chart, if market is at an important junction, if there are other technical alerts
doji after a tall candle are especially potent, the highest high of the 2 candles is the resistance
doji are especially potent after an uptrend, less so after a downtrend
gavestone doji is a bearish signal
dragonfly doji is a bullish signal
long-legged doji is a confused market
CUSTOM
*1st signal is a continuation pattern based on the progression of bodies' sizes and/or shadows' sizes
*following ones are reversal patterns based on the progression of bodies' sizes and/or shadows' sizes
*early reversal is based on a "secret" excess signal
reversal confirmed is when the early reversal's excess resolves and price reintegrates the non-excess area + prints a custom reversal pattern
for both early reversal and reversal confirmed the same rule applies as with any candlestick signal: we wait for the next candle's close above the previous upper shadow (bullish reversal) or below the previous lower shadow (bearish reversal)
*swings are 3 candles fractals, they are not reversal or continuation patterns but serve to mark swing highs and lows
this is all based on Steve Nison's book Japanese candlestick charting techniques
and
Thomas N. Bulkowski's Encyclopedia of candlestick charts
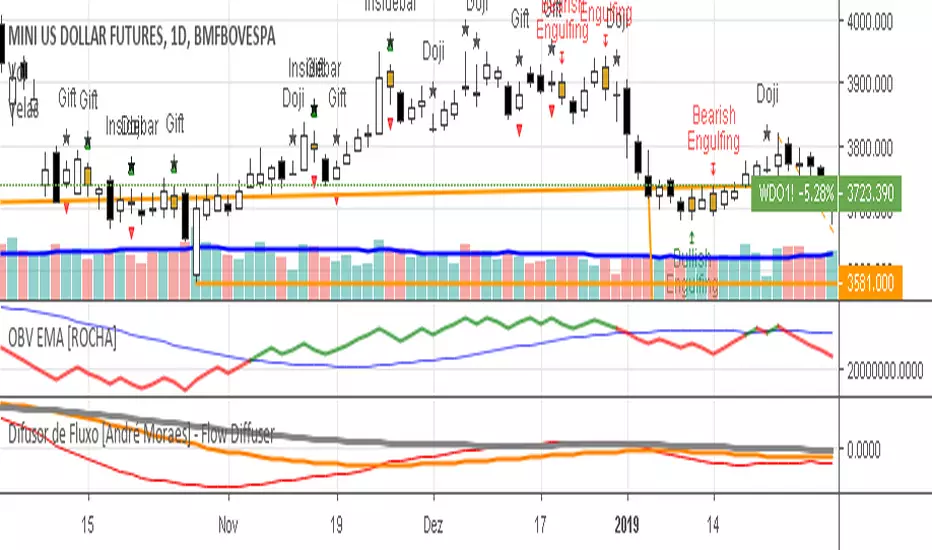
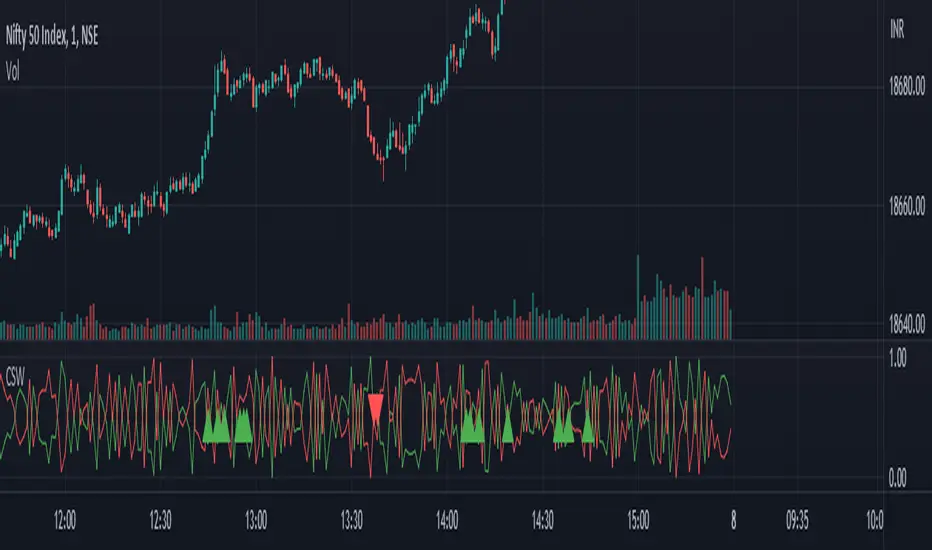
Candlestick Strength and Weakness with RSI and OBVThe "Candlestick Strength and Weakness with RSI and OBV" indicator, denoted as CSW, is a tool designed to assist traders in identifying potential trend reversals in financial markets. The CSW indicator combines the analysis of candlestick patterns, relative strength index (RSI), and on-balance volume (OBV) to provide traders with valuable insights into market dynamics.
The CSW indicator calculates the strength and weakness of each candlestick based on its open, close, high, and low prices. It considers the body range, upper shadow range, and lower shadow range of the candlestick to determine the distribution of strength and weakness within it. By quantifying the candlestick's strength and weakness, the indicator provides a visual representation of the balance between bullish and bearish forces in the market.
In addition to candlestick analysis, the CSW indicator incorporates RSI and OBV calculations to further validate potential trend reversals. The RSI is a widely-used momentum oscillator that measures the speed and change of price movements. The OBV, on the other hand, tracks the cumulative volume flow and helps identify periods of accumulation or distribution. By considering these indicators alongside candlestick strength and weakness, the CSW indicator enhances the accuracy of its signals.
To interpret the CSW indicator effectively, traders should consider the following:
Candlestick Strength and Weakness: The indicator plots two lines, "Candle Strength" and "Candle Weakness," representing the strength and weakness of each candlestick. The strength line indicates the bullish pressure, while the weakness line represents the bearish pressure.
Potential Reversal Signals: The CSW indicator identifies potential trend reversals based on the balance between candlestick strength and weakness, RSI readings, and OBV values. A bullish reversal signal occurs when the strength is higher than weakness, the RSI is below 30 (indicating oversold conditions), and the OBV is below its 20-period simple moving average (SMA). Conversely, a bearish reversal signal occurs when the weakness is higher than strength, the RSI is above 70 (indicating overbought conditions), and the OBV is above its 20-period SMA.
Trend Confirmation: The CSW indicator provides additional confirmation by comparing the closing price with the 20-period exponential moving average (EMA). If the closing price is above the EMA, it suggests an uptrend, while a closing price below the EMA indicates a downtrend.
Traders can add the indicator to their charts and customize its parameters based on their preferences. By monitoring the indicator's plots and observing the occurrence of potential reversal signals in alignment with the trend confirmation, traders can make informed decisions regarding entry or exit points in their trading strategies.
Candlestick.Detector.with.SMA.EMACandlestick Pattern Detector with
2 x MA optional (20, 200)
2 x EMA optional (50,200)
Incldudes
Doji = color > #050800
Shooting Star, color > orange, shape=arrow down
Evening Star, color > red, shape = diamond
Morning Star, color=orange, shape = diamond
Hammer, color=blue, shape = diamond, text="H"
Inverted Hammer, color=blue, shape = diamond, text="IH"
Bearish Harami", color=red, shape =arrowdown, text="Bearish Harami"
Bullish Harami", color=green, shape = arrowup, text="Bullish Harami"
Bearish Engulfing", color=red, shape = arrowdown, text="Bearish Engulfing"
Bullish Engulfing", color=green, shape.arrowup, text="Bullish Engulfing"
Piercing Line", color=green, shape = arrowup, text="Piercing Line"
Bullish Belt", color=green, shape = arrowup, text="Bullish Belt"
Bullish Kicker", color=green, shape.arrowup, text="Bullish Kicker"
Bearish Kicker", color=red, shape.arrowdown, text="Bearish Kicker"
Hanging Man", color=red, shape=arrowdown, text="Hanging Man"
Dark Cloud Cover", color=red, shape =arrowdown, text="Dark Cloud Cover."
Candlestick PatternsShort Description: Identify and visualize 16 key candlestick patterns in real-time.
Long Description:
The Candlestick Pattern Detector is a powerful indicator designed to help traders identify and visualize 16 key candlestick patterns in real-time. This indicator overlays the identified patterns on the chart, making it easy for traders to spot potential trend reversals, continuations, or significant price movements.
The indicator detects the following candlestick patterns:
Bullish Engulfing
Bearish Engulfing
Bullish Harami
Bearish Harami
Bullish Piercing
Dark Cloud Cover
Hammer
Hanging Man
Inverted Hammer
Shooting Star
Morning Star
Evening Star
Three White Soldiers
Three Black Crows
Bullish Marubozu
Bearish Marubozu
Each pattern is labeled on the chart with its respective name and color-coded to indicate whether it's a bullish (green) or bearish (red) signal. This makes it easy for traders to quickly spot patterns and make informed decisions based on the detected signals.
To use the Candlestick Pattern Detector, simply add it to your TradingView chart, and it will automatically highlight the identified patterns on the price chart. The patterns are identified based on well-established candlestick pattern recognition techniques, giving traders a reliable tool to aid their technical analysis.
Whether you're a seasoned trader or just starting, the Candlestick Pattern Detector can be a valuable addition to your trading toolkit, helping you to identify potential trading opportunities based on classic candlestick patterns.

AutoBots Trading - Candlestick Patterns 1.0Candlestick charts are a technical tool that packs data for multiple time frames into single price bars. This makes them more useful than traditional open-high, low-close bars or simple lines that connect the dots of closing prices. Candlesticks build patterns that predict price direction once completed. Proper color coding adds depth to this colorful technical tool, which dates back to 18th-century Japanese rice traders.
Candlestick Patterns: HAMMER & HANING MAN, ENGULFINGS, PIERCING & DARKCLOUD, DOJIS, STARS, SHOOTING & INVERTED, HARAMIS, TRI STARS, TWEEZERS, BELT HOLD, BLACK CROWS, COUNTER ATTACK, SOLDIERS, STICK, GAPS, RISING & FALLING, SEPARATING LINES, MAT HOLD, LINE STRIKE, NECKS.

Candlestick Pattern Detector (v8)Indicator Description – Candlestick Pattern Detector (v8)
This indicator automatically detects and highlights some of the most popular candlestick reversal and continuation patterns directly on the chart. It’s designed for traders who want clear visual signals for price action setups without having to scan every candle manually.
Patterns Included:
Bullish Engulfing – Strong bullish reversal when a green candle fully covers the previous red candle.
Bearish Engulfing – Strong bearish reversal when a red candle fully covers the previous green candle.
Morning Star – A 3-candle bullish reversal pattern, signalling exhaustion of selling pressure.
Evening Star – A 3-candle bearish reversal pattern, signalling exhaustion of buying pressure.
Three White Soldiers – Three consecutive strong bullish candles with small wicks, often showing trend continuation.
Three Black Crows – Three consecutive strong bearish candles with small wicks, often marking trend continuation.
Hammer – A bullish rejection candle with a small body and a long lower wick, usually after a downtrend.
Inverted Hammer – A potential bullish reversal candle with a small body and a long upper wick.
Features:
Labels on chart: Each detected pattern is marked with a label (e.g., Bull Engulf, Morning Star, 3WS, Hammer).
Colored candles: Optionally colors bars when patterns appear (green for bullish, red for bearish).
Engulfing mode toggle: Choose between strict wick-to-wick engulfing or body-only engulfing.
Customizable display: Toggle individual patterns on/off to focus on the setups you use.
Why use this indicator?
Candlestick formations provide insight into market psychology and momentum shifts. By automating the detection of these patterns, this tool helps traders:
Spot potential reversals early.
Confirm trade setups with clear visual cues.
Save time manually checking each candle.
⚠️ Disclaimer: This indicator is for educational and analysis purposes only. It does not provide financial advice or guarantee profitability. Always combine candlestick signals with broader technical/fundamental analysis and risk management.

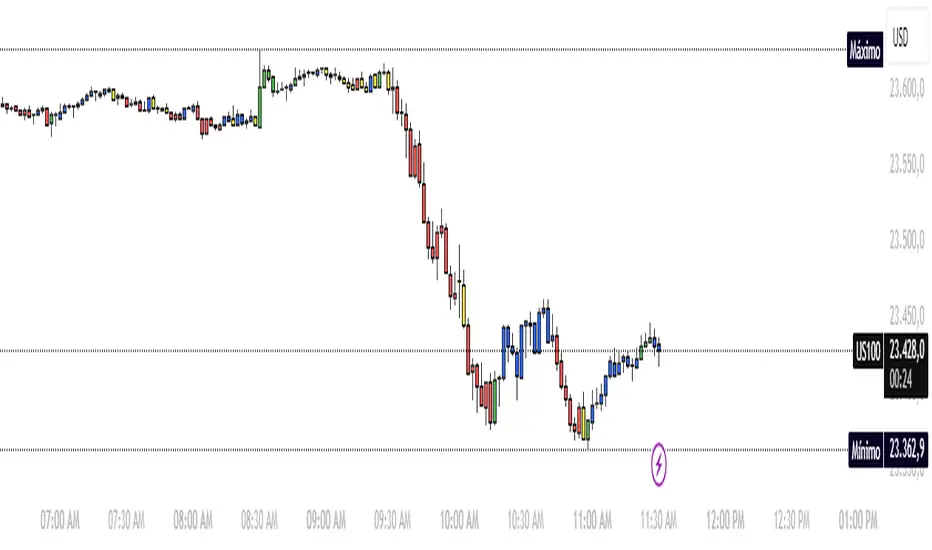
Candlestick High/Low Labels📌 Indicator Name:
Candlestick High/Low Labels
🧠 Author:
Precious Life Dynamics (@Precious_Life)
📋 Description:
The Candlestick High/Low Labels indicator highlights recent price extremes by placing labels above highs and below lows of previous candles.
Additionally, it displays a live OHLCV dashboard in the bottom-right corner, offering a quick overview of recent market data.
This tool is especially useful for:
Identifying support/resistance levels
Tracking candle behavior
Visualizing volume trends in context
⚙️ How It Works:
🔸 High/Low Labels:
Each of the most recent candles (based on Candle Lookback) is annotated as follows:
🔹 Red label above each candle’s high
🔹 Green label below each candle’s low
🔹 Price values are rounded (no decimals)
🔹 Labels are dynamically updated; old ones are removed
🔹 Label visibility can be toggled via the Show Labels input
🔸 OHLCV Dashboard:
A real-time data table appears in the bottom-right corner of the chart.
It displays the last N candles (based on Dashboard Lookback) with the following fields:
🔹 Candle Number (1 = most recent)
🔹 Open, High, Low, Close
🔹 Volume
🔹 Values are rounded for readability
🔹 White background with black text ensures high visual clarity
🔧 Customizable Inputs:
✅ Candle Lookback → Number of candles to label (default: 10)
✅ Show Labels → Toggle High/Low label display on/off
✅ Dashboard Lookback → Number of candles shown in the OHLCV table (default: 10)
🎯 Use Cases:
🔹 Identify recent price extremes and reaction zones
🔹 Spot dynamic support and resistance levels
🔹 Observe how candles behave at swing highs/lows
🔹 Monitor volume activity in relation to price
🔹 Use as a clean visual tool for scalping and intraday trading
📝 Notes:
🔹 This indicator is purely visual – it does not generate trade signals
🔹 Best suited for traders who value clear, real-time price structure feedback

candlestick patterns for scalping by lalocoutinoThis indicator will show you when a volume-based candlestick pattern forms.
It contains different candlestick patterns to be able to use it in scalping.
Each pattern has a specific name to identify it
It is recommended to use it in 1 minute charts.

Candlestick PatternsWhat It Does:
Automatically identifies and displays:
🟢 16+ Bullish patterns (Hammer, Engulfing ↑, Morning Star, etc.)
🔴 Bearish patterns (Shooting Star, Engulfing ↓, Evening Star, etc.)
🔵 Break & Retest signals (70-80% win rate setups)
⚪ Neutral patterns (Doji, Spinning Top - indecision)
🎯 Automatic alerts for all major patterns
Purpose: Shows you exactly when reversals are likely and identifies the highest-probability entry points (Break & Retest).Key Patterns:Bullish (Green labels above/below):
HAMMER - Long lower wick, small body (reversal from bottom)
ENGULF ↑ - Big green candle swallows previous red (strong reversal)
MORNING★ - Three candles: red, doji, green (major bottom)
3 BULLS - Three consecutive green candles (strong momentum)
PIERCE - Green closes above 50% of previous red
RETEST ↑ (BEST!) - Price broke resistance, pulled back, bounced (cyan circle)
Bearish (Red labels above/below):
SHOOT★ - Long upper wick, small body (reversal from top)
ENGULF ↓ - Big red candle swallows previous green (strong reversal)
EVENING★ - Three candles: green, doji, red (major top)
3 BEARS - Three consecutive red candles (strong momentum)
DARK☁ - Red closes below 50% of previous green
RETEST ↓ (BEST!) - Price broke support, bounced back, rejected (orange circle)
Neutral:
DOJI - Indecision, potential reversal coming
SPINNING TOP - Small body, long wicks (indecision)
Best Practices:✅ Wait for confirmation - Don't trade pattern alone, check context
✅ Combine patterns - Retest + Candlestick = 80%+ win rate
✅ Check trend - Bullish patterns in uptrend work best
✅ Volume matters - Larger patterns with volume = stronger
✅ Fresh retests - First retest after break = highest probability
✅ Use alerts - Set alerts for Engulfing, Retest, Morning/Evening Star
✅ Size matters - Bigger candles = stronger signals❌ Don't trade every pattern - Quality over quantity
❌ Don't ignore context - Hammer at resistance = weak signal
❌ Don't trade against trend - Bearish in strong uptrend = risky
❌ Don't skip stop loss - Always protect your trades
❌ Don't trade small patterns - Need clear, visible patterns

Candlestick Pattern DetectorFeatures
Reversal Patterns:
Bullish Patterns:
Bullish Engulfing: A strong reversal signal when a bullish candle completely engulfs the previous bearish candle.
Hammer: Indicates a potential bottom reversal with a small body and a long lower wick.
Morning Star: A three-candle pattern signaling a transition from a downtrend to an uptrend.
Bearish Patterns:
Bearish Engulfing: A bearish candle fully engulfs the prior bullish candle, indicating a potential downtrend.
Shooting Star: A potential top reversal with a small body and a long upper wick.
Evening Star: A three-candle pattern signaling a shift from an uptrend to a downtrend.
Continuation Patterns:
Bullish Continuation:
Rising Three Methods: A consolidation pattern within an uptrend, indicating the trend is likely to continue.
Bearish Continuation:
Falling Three Methods: A consolidation pattern within a downtrend, suggesting further downside movement.
Visual Highlights:
Bullish Reversal Patterns: Labeled below candles with a green "Bullish" marker.
Bearish Reversal Patterns: Labeled above candles with a red "Bearish" marker.
Bullish Continuation Patterns: Displayed as blue triangles pointing upward.
Bearish Continuation Patterns: Displayed as orange triangles pointing downward.
Real-Time Alerts:
Get notified when a specific candlestick pattern is detected, enabling you to act quickly in dynamic market conditions.
candlestick trendThis indicator is a basic candlestick pattern check.
If the current candle is close above the previous candle's high then it is considered a bullish sign and it is shown with green color. Now it would be green until one candle does not close below the previous candle low.
same for the bearish signal.
If the current candle is close below the previous candle's low then it is considered a bearish sign and it is shown with red color. Now it would be red until one candle does not close above the previous candle high.

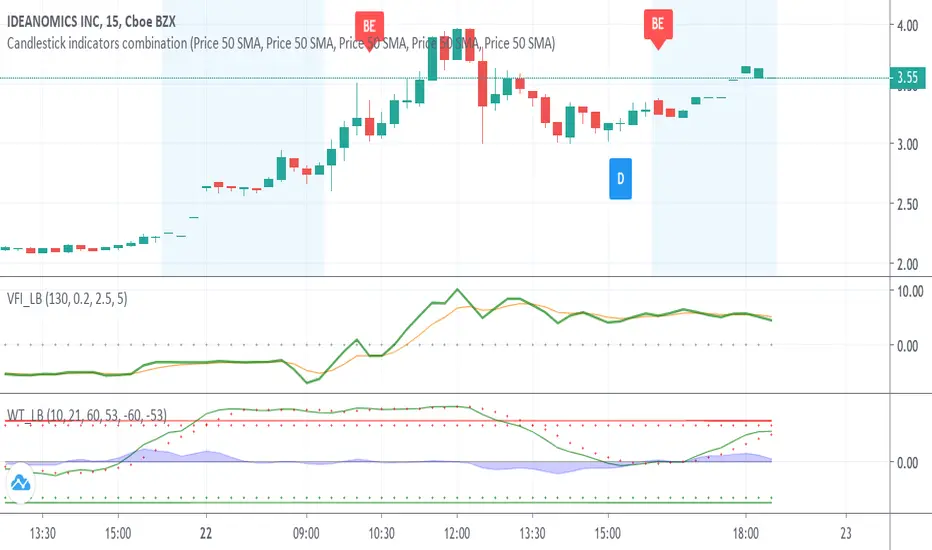
Candlestick indicators combinationWith the inclusion of the candlestick identifiers added to trading view today, I have compiled my favourite identifiers and put them together here. This way, you can see the following together instead of separately:
Bearish Engulfing
Bullish Engulfing
The Morning Star
The Three White Soldiers
The Hammer
The Inverted Hammer
See Investopedia for more on these indicators.
In addition, I have made the indicators to show green if indicating a bullish trend, red if indicating a bearish trend, and blue if indicating something else. Please validate these indicators with other factors like EMA before proceeding to make a trade.
Please let me know if there are other indicators you would like me to compile to this list.
Best wishes, and happy trading!
candlestick patternsCleaning up and updating vcsWo8mh-Candlestick-Patterns-Identified-updated-3-11-15 .
As I learn more candlestick patterns I'll add them in.
Please post requests and any potential implementations I could port to pine script.
I'm applying autopep8 as best I can for readability.
CandleStick [TradingFinder] - All Reversal & Trend Patterns🔵 Introduction
"Candlesticks" patterns are used to predict price movements. We have included 5 of the best candlestick patterns that are common and very useful in "technical analysis" in this script to identify them automatically. The most important advantage of this indicator for users is saving time and high precision in identifying patterns.
These patterns are "Pin Bar," "Dark Cloud," "Piercing Line," "3 Inside Bar," and "Engulfing." By using these patterns, you can predict price movements more accurately and therefore make better decisions in your trades.
🔵 How to Use
Pin Bar : This pattern consists of a Candle where "Open Price," "Close Price," "High Price," and "Low Price" form the "Candle Body," and it also has "Long Shadow" and "Short Shadow." In the visual appearance of the Pin Bar pattern, we have a candle body and a pin bar shadow, where the candle body is smaller relative to the shadow.
Just as the candle body plays an important role in analysis, the pin bar shadow can also be influential. The larger the pin bar shadow, the stronger the expectation of a trend reversal.
When a "bearish pin bar" occurs at resistance or the chart ceiling, it can be predicted that the price trend will be downward. Similarly, at support points and the chart floor, a "bullish pin bar" can indicate an upward price movement.
Additionally, patterns like "Hammer," "Shooting Star," "Hanging Man," and "Inverted Hammer" are types of pin bars. Pin bars are formed in two ways: bullish pin bars have a long lower shadow, and bearish pin bars have a long upper shadow. Important: Displaying "Bullish Pin Bar" is labeled "BuPB," and "Bearish Pin Bar" is labeled "BePB."
Dark Cloud : The Dark Cloud pattern is one type of two-candle patterns that occurs at the end of an uptrend. The 2-candle pattern indicates the shape of this pattern, which actually consists of 2 candles, one bullish and one bearish. This pattern indicates a trend reversal and is quite powerful.
The Dark Cloud pattern is seen when, after a bullish candle at the end of an uptrend, a bearish candle opens at a higher level (weakly, equal, or higher) than the closing point of the bullish candle and finally closes at a point approximately in the middle of the previous candle. In this indicator, the Dark Cloud pattern is identified as "Wick" and "Strong" .
The difference between these two lies in the strictness of their conditions. Important: Strong Dark Cloud is labeled "SDC," and Weak Dark Cloud is labeled "WDC."
Piercing Line : The Piercing candlestick pattern consists of 2 candles, the first being bearish and consistent with the previous trend, and the second being bullish. The conditions of the pattern are such that the first candle is bearish and a price gap is created between the two candles upon the opening of the next candle because its opening price is below (weakly equal to or less than) the closing price of the previous candle.
Additionally, its closing price must be at least 50% above the red candle.
This means that the second candle must penetrate at least 50% into the first candle. Important: Strong Piercing Line is labeled "SPL," and Weak Piercing Line is labeled "WPL."
3 Inside Bar (3 Bar Reversal) : The 3 Inside Bar pattern is a reversal pattern. This pattern consists of 3 consecutive candles and can be either bullish or bearish. In the bullish pattern (Inside Up) formed at the end of a downtrend, the last candle must be bullish, and the third candle from the end must be bearish.
Additionally, the close price must be more than 50% of the third candle from the end. In the bearish pattern (Inside Down) formed at the end of an uptrend, the last candle must be bearish, and the third candle from the end must be bullish. Additionally, the close price must be less than 50% of the third candle from the end. Important: Bullish 3 Inside Bar is labeled "Bu3IB," and Bearish 3 Inside Bar is labeled "Be3IB."
Engulfing : The Engulfing candlestick pattern is a reversal pattern and consists of at least two candles, where one of them completely engulfs the body of the previous or following candle due to high volatility.
For this reason, the term "engulfing" is used for this pattern. This pattern occurs when the price body of a candle encompasses one or more candles before it. Engulfing candles can be bullish or bearish. Bullish Engulfing forms as a reversal candle at the end of a downtrend.
Bullish Engulfing indicates strong buying power and signals the beginning of an uptrend. This pattern is a bullish candle with a long upward body that completely covers the downward body before it. Bearish Engulfing, as a reversal pattern, is a long bearish candle that engulfs the upward candle before it.
Bearish Engulfing forms at the end of an uptrend and indicates the pressure of new sellers and their strong power. Additionally, forming this pattern at resistance levels and the absence of a lower shadow increases its credibility. Important: Bullish Engulfing is labeled "BuE," and Bearish Engulfing is labeled "BeE."
🔵 Settings
This section, you can use the buttons "Show Pin Bar," "Show Dark Cloud," "Show Piercing Line," "Show 3 Inside Bar," and "Show Engulfing" to enable or disable the display of each of these candlestick patterns.

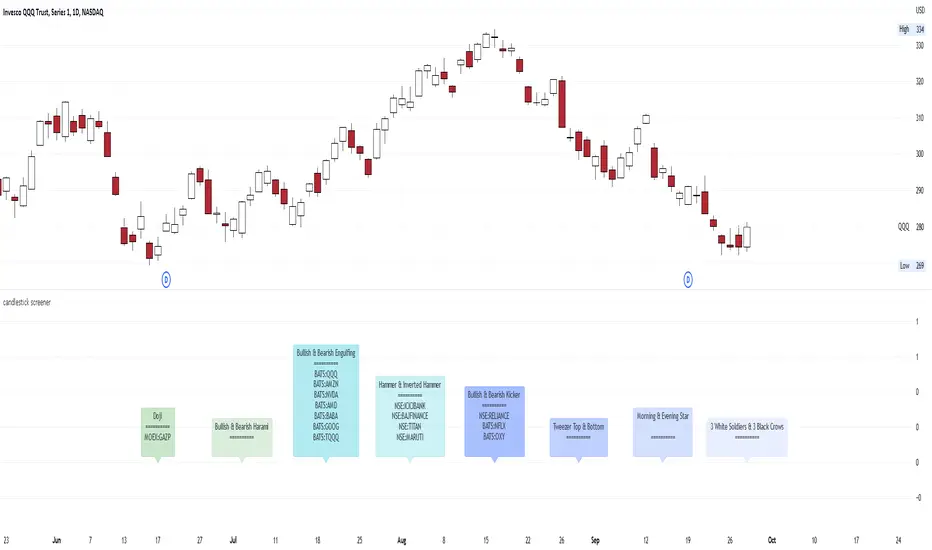
candlestick screenerhello traders..
I think it would be awesome if traders using a candlestick price action have a candlestick pattern screener.
so you just have to screen the securities, crypto, forex, commodities, spot the candlestick pattern easily and then you can set up trades..
This is a multi time frame candlestick screener, consist of:
1. Bullish & Bearish Kicker
2. Morning & Evening Star
3. Three White Soldiers & Three Black Crows
4. Tweezer Top & Bottom
5. Doji
6. Spinning Top & Bottom
7. Bullish & Bearish Harami
8. Bullish & Bearish Engulfing
9. Hanging Man & Shooting Star
10. Hammer & Inverted Hammer
the time frame of the screener, follows the Main Chart Time Frame;
- if your main chart in M5, then the result is in M5
- if your main chart in M15, then the result is in M15
- if your main chart in H1, then the result is in H1
- if your main chart in Daily, then the result is in Daily
- if your main chart in Weekly, then the result is in Weekly
- if your main chart in Monthly, then the result is in Monthly
Here are some the examples in multi time frame:
M5
M15
M30
H1
H4
Daily
Weekly
Monthly