M0PB (Momentum Pullback)Long/short strategy that identifies extreme readings on the rsi as a *momentum signal*, unlike most RSI strategies the script will look to buy or sell the first pullback in the direction of the extreme RSI reading.
Enters positions on the first pullback to the 5ema(low)/ 5ema(high) and exits at rolling 12 bar high/ low. The rolling high/ low feature means that if the price enters into a prolonged consolidation the profit target will begin to reduce with each new bar. The best trades tend to work within 2-6 bars.
Built for use on 5 min intervals on FX, Indexes, and Crypto. Lower than 5 minute time frames tend to be noisier and mean more commissions and a higher risk of slippage so the suggested timeframe is 5 mins.
Hard stop is X ATR (users can experiment with this) from the position entry price. This can be adjusted in user inputs.
There is a lot of slack left in entries and exits but the overall strategy is fairly robust across timeframes and markets and has between 60%-70% win rate with larger winners.
Signals that occur from economic news volatility are best avoided.
Relative Strength Index (RSI)

I11L - Meanreverter 4h---Overview---
The system buys fear and sells greed.
Its relies on a Relative Strength Index (RSI) and moving averages (MA) to find oversold and overbought states.
It seems to work best in market conditions where the Bond market has a negative Beta to Stocks.
Backtests in a longer Timeframe will clearly show this.
---Parameter---
Frequency: Smothens the RSI curve, helps to "remember" recent highs better.
RsiFrequency: A Frequency of 40 implies a RSI over the last 40 Bars.
BuyZoneDistance: Spacing between the different zones. A wider spacing reduces the amount of signals and icnreases the holding duration. Should be finetuned with tradingcosts in mind.
AvgDownATRSum: The multiple of the Average ATR over 20 Bars * amount of opentrades for your average down. I choose the ATR over a fixed percent loss to find more signals in low volatility environments and less in high volatility environments.
---Some of my thoughts---
Be very careful about the good backtesting performance in many US-Stocks because the System had a favourable environment since 1970.
Be careful about the survivorship bias as well.
52% of stocks from the S&P500 were removed since 2000.
I discount my Annual Results by 5% because of this fact.
You will find yourself quite often with very few signals because of the high market correlation.
My testing suggests that there is no expected total performance difference between a signal from a bad and a signal from a good market condition but a higher volatility.
I am sharing this strategy because i am currently not able to implement it as i want to and i think that meanreversion is starting to be taken more serious by traders.
The challange in implementing this strategy is that you need to be invested 100% of the time to retrieve the expected annual performance and to reduce the fat tail risk by market crashes.

RSI Divergence Strategywhat is "RSI Divergence Strategy"?
it is a RSI strategy based this indicator:
what it does?
it gives buy or sell signals according to RSI Divergences. it also has different variables such as "take profit", "stop loss" and trailing stop loss.
how it does it?
it uses the "RSI Divergence" indicator to give signal. For detailed information on how it works, you can visit the link above. The quantity of the inputs is proportional to the rsi values. Long trades are directly traded with "RSI" value, while short poses are traded with "100-RSI" value.
How to use it?
The default settings are for scalp strategy but can be used for any type of trading strategy. you can develop different strategies by changing the sections. It is quite simple to use.
RSI length is length of RSİ
source is source of RSİ
RSİ Divergence lenght is length of line on the RSI
The "take profit", "stop" and "trailing stop" parts used in the "buy" group only affect buys. The "sell" group is similarly independent of the variables in the "buy" group.
The "zoom" section is used to enlarge or reduce the indicator. it only changes the appearance, it does not affect the results of the strategy.

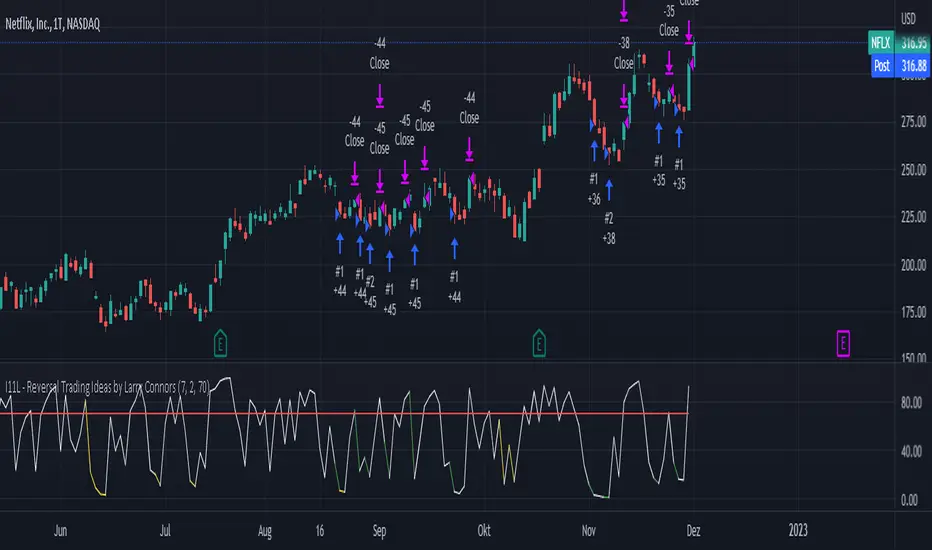
I11L - Reversal Trading Ideas by Larry ConnorsThis is my own Twist on Larry Connors Simple Tradingideas.
It Combines the RSI, Averaging In and the Lowest Bars in a Single System.
The current Configuration is designed for the Daily Timeframe.
Feel free to play with the Parameters and keep in mind that Larry Intended to buy fear and sell the greed!
The Rules are the following:
---Buy---
Buy, if the lowest Bar of your Configuration has been hit (default is set to 7).
---Average Down--
Buy, if the lowest Bar of your Configuration * Your open trades has been hit AND only if the buyin is atleast 1% cheaper.
---Close---
Close, if the RSI closes above a certain level (default is set to 70).
---TP---
There is no TP
---SL---
There is no SL, so be cautions of your tail Risk!
EMA RSI Strategy
Simple strategy
=============
If the last two closes are in ascending order, the rsi is below 50 and ascending, and the current candle is above 200 ema, then LONG. If the last two closes are in descending order, the rsi is above 50 and descending, and the current candle is below 200 ema, then SHORT.
LONG Exit strategy:
ATR: Last 14 day
Lowest: The lowest value of the last 14 candles
Limit points = (Trade Price - Lowest + ATR) * 100000
trail_points : Limit/2
trail_offset = Limit/2
SHORT Exit strategy:
ATR: Last 14 day
Highest: The higher value of the last 14 candles
Limit points = (Trade Price - Highest + ATR) * 100000
trail_points : Limit/2
trail_offset = Limit/2
Backtest results for the AUDUSD pair gave positive results over the last three months.
I am testing this strategy using a python bot in a real environment this week and will update the results at the end of the week.
Disclaimer
This is not financial advice. You should seek independent advice to check how the strategy information relates to your unique circumstances.
We are not liable for any loss caused, whether due to negligence or otherwise arising from the use of, or reliance on, the information provided directly or indirectly by this strategy.

Simple RSI and SMA Long and Short (by Coinrule)The relative strength index ( RSI ) is a momentum indicator used in technical analysis . RSI measures the speed and magnitude of a security's recent price changes to evaluate overvalued or undervalued conditions in the price of that security. The RSI is displayed as an oscillator (a line graph) on a scale of zero to 100. The RSI can do more than point to overbought and oversold securities. It can also indicate securities that may be primed for a trend reversal or corrective pullback in price. It can signal when to buy and sell. Traditionally, an RSI reading of 70 or above indicates an overbought situation. A reading of 30 or below indicates an oversold condition.
A simple moving average ( SMA ) calculates the average of a selected range of prices, usually closing prices, by the number of periods in that range.
The Strategy enters and closes the trade when the following conditions are met:
LONG
SMA100 is greater than SMA150
RSI is greater than 50
SHORT
SMA100 is less than SMA150
RSI is less than 50
When a long position is opened, it remains open until the conditions for a short are met at which point the long position is closed and the short position is opened. Then, when the conditions for the long position are met, the short will be closed and a long will be opened.
This strategy is back tested from 1 January 2022 to simulate how the strategy would work in a bear market. The strategy provides good returns.
The strategy assumes each order is using 30% of the available coins to make the results more realistic and to simulate you only ran this strategy on 30% of your holdings. A trading fee of 0.1% is also taken into account and is aligned to the base fee applied on Binance.

3Commas Bot DCA Backtester & Signals FREEThis is a DCA Strategy backtester + signals, built to emulate the 3Commas DCA bots. It uses your choice of 4 different buy signals, 2 of which can be adjusted in the settings. Everything is customizable so you can backtest specific settings with different buy signals and find the best performing strategy for your risk tolerance and capital. It can be used to backtest strategies on stocks as well, but just make sure your base order is larger than the share price for the entire backtesting range or it will not calculate properly.
You can use this template to code your own buy signals and then backtest them as a DCA strategy if you know some basic pine script.
The indicator shows all of your backtesting orders on the chart. The red line is your take profit level, the blue line is your average price level, the white line is your first order and the green lines are your average down orders. If you enable a stop loss in the settings your stop loss will be shown as an orange line once all of your average down orders have been hit, it will not be set until price has dipped below your covered trading range.
These levels update when things change during backtesting so you can visualize your strategy and how it would perform as well as see if your percentage deviation is large enough to cover dips. When backtesting trades are taken, the chart will show where they were taken(in backtesting) along with info on those trades such as the number each order is, the size of that order and the percentage deviation that order is from the initial buy.
SENDING SIGNALS TO 3COMMAS
Tradingview cannot sync this backtester to 3Commas and with the way alerts are setup for strategies on Tradingview, the best option for you to give signals to your bot would be to use this backtester to figure out what trigger you want to use and then setup that indicator separately to send alerts to your bot. All of the indicators used for signals in this backtester are available for free and can be configured to match this backtester and send alerts to 3Commas for you. Just make sure you set your alerts to once per bar close and don’t use less than a 15 second timeframe because then you could trigger the Tradingview threshold for alerts and get your alerts shut off.
You can also use this backtester with your own buy triggers if you know a little pine script. Just make copy of the script and code in your own buy signals and see how it backtests.
INFO PANEL FOR ANALYZING YOUR STRATEGY
The right hand side of the screen will show an info panel that shows a lot of different information so you can quickly see your bot settings and how it performed right on the screen.
In the top right corner you will see in purple your bot settings. These include your stoploss % if turned on, take profit %, average down order %, average down order % multiplier, volume multiplier, max number of orders allowed and size of your base order.
The top section of the first column “Current Trade” shows these stats: the open trade’s average price, the open trade’s take profit price, the open trade’s PNL, how far price is from your open tarde’s take profit level in percentage, your open position size and number of open orders.
The bottom section of the first column “Overall Performance” shows these stats: total number of trades taken during backtesting range, the largest amount of trades that were open at one time during backtesting, the max drawdown, the average number of bars per trade, gross profit, net profit, percent profit from your initial capital, current portfolio value and your initial capital.
CUSTOMIZABLE OPTIONS TO FIND THE PERFECT STRATEGY
Stoploss On/Off
This will turn your stoploss on or off. By default it is set to off and will not affect anything unless turned on.
Stoploss Percentage
This is the percentage below your final average down order price that will be set as a stoploss to keep your account from going too far in the red on big dips.
Take Profit Percentage - This is the percentage of profit you want the trade to hit before taking profit on your entire DCA trade. This level updates everytime you average down.
Average Down Percentage - This is the percentage that price has to drop from your initial order to initiate your first safety order. If the Average Down Percent Multiplier is set to 1 then this percentage will be the same for every average down order.
Average Down Percentage Multiplier - This multiplies your Average Down Percentage so each safety order needs a larger percentage deviation than the previous one. This keeps your buys closer together at the beginning and further apart when you hit more orders so you can extend your trading range but still be aggressive when price is going sideways.
Volume Multiplier Per New Order - This multiplies the size of each trade based on your base order. If you set it to a 2x multiplier then each average down order will be 2 times the size of the last one. So for example, a $100 base order with a 2x multiplier would have these values for the first 3 average down orders: 200, 400, 800.
Size Of Base Order - This is the size of your first position entry and will be used as a starting point for the volume multiplier. If your base order is $100 then it will buy $100 worth of whatever crypto you are backtesting this on. If you are looking at stock charts, you need to make sure your base order is higher than the share price across the entire backtesting range or it will not perform correctly.
Max Number Of Orders - This is the maximum number of orders the bot can take, including your base order. Adjust this to suit the amount of capital you are willing to allocate to your bot based on how much money it will require to run according to your bot settings.
TIPS ON HOW TO USE FOR BEST RESULTS
If you don’t have a lot of capital to work with, then use longer timeframes with a reasonable take profit percentage so that you don’t need a lot of average down orders. You can also try keeping the volume multiplier close to 1.
You can use the 3Commas dca bot settings page to see how much capital you will need for your strategy if you match it to the settings you have on this indicator. You can also check to see how much of a percentage deviation your bot is covering to make sure you have a reasonable range to trade in and orders to cover big dips. You can also check your coverage by seeing how far down the chart the green lines cover, which are your average down orders.
Make sure the initial capital in the properties tab of the settings has enough to cover all of your orders otherwise you will get unrealistic backtesting results. Also, make sure you leave the order size in the properties tab on contracts so it calculates your trades correctly. The only settings you need to touch in the properties tab is the initial capital. Unless you are trading somewhere that has lower commission fees, then you can change that to match, but leave all the other settings as is for it to function properly.
Increasing the volume multiplier will make your average price and take profit target follow the price action a lot closer as price falls, but it can also lead to having very large orders very quickly once you get into the 1.5-3x multiple range. Try using a high volume multiplier with less safety orders and you will get better results, however you need to have money on the sidelines to add on major dips to keep your bot turning a profit. Be very careful with this as greed and impatience will hurt your overall performance. This bot is meant to make money with lots of small wins so don’t get greedy and make sure you have enough money to cover large dips. If you are being aggressive with your bot, then I recommend only using 25% or less of your portfolio to trade aggressively and then use the smart trade feature on 3commas to add chunks of funds to your trades when price dips below your last safety order. Or if you want it to run without any supervision, then use lower volume multipliers and have lots of safety orders that can cover entire bear markets and still keep buying lower.
It’s a good idea to have some capital on the sidelines that you can add in when price dips quickly. This will help lower your average price and allow your bot to get out in profit quicker. 3Commas bot has a smart trade feature that will allow you to track your average price when adding extra funds and it will automatically update your other orders which is very convenient. Look at the longer timeframes when price dips and only add chunks at major areas where price is very likely to bounce. Or you can be aggressive when trading and add to your position when price dips and is at a likely bounce zone to maximize profits.
Only trade coins that have a good amount of liquidity as the larger your orders get, the harder it will be to sell if there isn’t much liquidity. Also, beware of how large your first order is as it will usually be a market order and can move the market if there is not much liquidity.
Since this bot takes a lot of trades and performs best when taking small profits consistently, you will need to factor in exchange fees. The bot is set to .5% commission(you can change this) on the buy and sell orders as most exchanges charge that amount. Some exchanges offer no fee trading on certain coins so be sure to look around for those so you can keep the commissions and maximize profits.
I strongly encourage you to try out a lot of different setting combinations across multiple different coins and do it across a few months to see how it would have performed under various market conditions. This will help you get a better idea of how much of a percentage deviation you’ll need to be able to cover to keep your bot running and making constant profits. You can also use the deep backtesting feature of the strategy panel to see how it would have done, but just beware that the info panel of the indicator will not reflect deep backtesting results, only the normal backtesting range.
MARKETS
This backtester can be used on any market including crypto, stocks, forex & futures. You just need to make sure your base order is larger than the share price when using this on things besides crypto.
TIMEFRAMES
This backtester can be used on all timeframes.

Catching the Bottom (by Coinrule)This script utilises the RSI and EMA indicators to enter and close the trade.
The relative strength index (RSI) is a momentum indicator used in technical analysis. RSI measures the speed and magnitude of a security's recent price changes to evaluate overvalued or undervalued conditions in the price of that security. The RSI is displayed as an oscillator (a line graph) on a scale of zero to 100. The RSI can do more than point to overbought and oversold securities. It can also indicate securities that may be primed for a trend reversal or corrective pullback in price. It can signal when to buy and sell. Traditionally, an RSI reading of 70 or above indicates an overbought situation. A reading of 30 or below indicates an oversold condition.
An exponential moving average (EMA) is a type of moving average (MA) that places a greater weight and significance on the most recent data points. The exponential moving average is also referred to as the exponentially weighted moving average. An exponentially weighted moving average reacts more significantly to recent price changes than a simple moving average simple moving average (SMA), which applies an equal weight to all observations in the period.
The strategy enters and exits the trade based on the following conditions.
ENTRY
RSI has a decrease of 3.
RSI <40.
EMA100 has crossed above the EMA50.
EXIT
RSI is greater than 65.
EMA9 has crossed above EMA50.
This strategy is back tested from 1 April 2022 to simulate how the strategy would work in a bear market and provides good returns.
Pairs that produce very strong results include ETH on the 5m timeframe, BNB on 5m timeframe, XRP on the 45m timeframe, MATIC on the 30m timeframe and MATIC on the 2H timeframe.
The strategy assumes each order is using 30% of the available coins to make the results more realistic and to simulate you only ran this strategy on 30% of your holdings. A trading fee of 0.1% is also taken into account and is aligned to the base fee applied on Binance.

RSI with Slow and Fast MA Crossing Strategy (by Coinrule)This strategy utilises 3 different conditions that have to be met to buy and 1 condition to sell. This strategy works best on the ETH/USDT pair on the 4-hour timescale.
In order for the strategy to enter the trade, it must meet all of the conditions listed below:
ENTRY
RSI increases by 5
RSI is lower than 70
MA9 crosses above MA50
To exit a trade, the below condition must be met:
EXIT
MA50 crosses above MA9
This strategy works well on LINK/USDT on the 1-day timeframe, MIOTA/USDT on the 2-hour timeframe, BTC/USDT on the 4-hour timeframe, and BEST/USDT on the 1-day timeframe (and 4h).
Back-tested from 1 January 2020.
The strategy assumes each order is using 30% of the available coins to make the results more realistic and to simulate you only ran this strategy on 30% of your holdings. A trading fee of 0.1% is also taken into account and is aligned to the base fee applied on Binance.

Risk Management Strategy TemplateThis strategy is intended to be used as a base template for building new strategies.
It incorporates the following features:
Risk management:
Configurable X% loss per stop loss
Configurable R:R ratio
Trade entry:
Calculated position size based on risk tolerance
Trade exit:
Stop Loss currently configurable ATR multiplier but can be replaced based on strategy
Take Profit calculated from Stop Loss using R:R ratio
Backtesting:
Configurable backtesting range by date
Trade drawings:
TP/SL boxes drawn for all trades. Can be turned on and off
Trade exit information labels. Can be turned on and off
NOTE: Trade drawings will only be applicable when using overlay strategies
Debugging:
Includes section with useful debugging techniques
Strategy conditions
Trade entry:
LONG
C1: Price is above EMA line
C2: RSI is crossing out of oversold area
SHORT
C1: Price is below EMA line
C2: RSI is crossing out of overbought area
Trade exit:
Stop Loss: Stop Loss ATR multiplier is hit
Take Profit: R:R multiplier * Stop Loss is hit
The idea is to use RSI to catch pullbacks within the main trend.
Note that this strategy is intended to be a simple base strategy for building upon. It was not designed to be traded in its current form.

RSI SMA Crossover StrategyOverview
RSI SMA Crossover Strategy works the same way as traditional MA crossover strategies, but using RSI instead of price. When RSI crosses over the SMA, a long position is opened (buy). When RSI crosses under the SMA, the long position is closed (sell).
This strategy can be very effective when the right inputs are used (see below). Be sure to use the backtesting tool to determine the optimal parameters for a given asset/timeframe.
Inputs/Parameters
RSI Length: length for RSI calculation (default = 50)
SMA Length: length for SMA calculation (default = 25)
Strategy Properties
Initial Capital = $1000
No default properties are defined for Slippage, Commission, etc, so be sure to set these values to get accurate backtesting results. This script is being published open-source for a reason - save yourself a copy and adjust the settings as you like!
Backtesting Results
Testing on Bitcoin (all time index) 1D chart, with all default parameters.
$1,000 initial investment on 10/07/2010 turns into almost $2.5 billion as of 08/30/2022 (compared to $334 million if the initial investment was held over the same period)
Remember, results can vary greatly based on the variables mentioned above, so always be sure to backtest.

Bitfinex Shorts StratOverview
This strat applies the data from BITFINEX:USDSHORTS to the RSI indicator in order to provide SHORT/LONG entries as the number of contracts goes up and down. Although Bitfinex has lost relevance over the years its generally considered an exchange dominated by smart money rather than retail. I'd like to see if any insights can be gained by following their trading behaviour.
How to use
Select the underlying security you wish to trade and load the indicator. Select the appropriate short security by searching in the Bitfinex Short Symbol. RSI settings apply to short symbol not the actual asset. Strategy shorts the underlying asset when shorts rise and longs when they drop. The shorts symbol will follow the value of the loaded chart. Works best on 4 hour chart.
Why use shorts only rather than both long/shorts?
Bitfinex longs seem to be on a long-term uptrend accounting for 25x the number of shorts. Might be enormous confidence on part of the whales, but more likely reflects selling spot and buying perp. Given the size disparity and price action I don't think longs info is adding much.
Problems with script:
a) We don't really know the intentions of short players (e.g. speculation or hedging spot)
b) The script uses a decline in shorts as a long signal
c) RSI is a blunt tool there are probably better options for calculating high/lows in shorts
d) Shorts are accumulated both at highs and also when BTC price is already heavily trending down. This suggests some are speculative (at the highs) or protective/hedging during a decline
Takeaways:
Based on this strat Bitfinex whales are more wrong than right.
Results don't carry across well into altcoins using the accompanying short symbol. However, what is interesting is that applying the BITFINEX:BTCUSDSHORTS to altcoin charts does work pretty well.
Strat needs some refinement to control for entries under different circumstances.
Probably not a great idea to use this as a strategy in isolation, but highlights how Bitfinex whale behaviour is a good gauge to follow.

Range Strat - MACD/RSIThis strategy uses a trend based indicator (MACD) for entry/exit signals with a momentum oscillator (RSI) to act as confirmation. Although relying on a trend based indicator this has been created for range bound crypto markets, which have been in a period of chop since June 2022.
Long/Short signals are generated from MACD with the RSI oscillator thresholds suppressing entries at price extremes. This is not a mean reversion RSI strategy! As the indicators are contrary to each other you will need to be generous with the RSI settings in order for signals to trigger.
Strategy is designed for use on the 4h timeframe, it may work well on higher timeframes, but lower time frames will lead to false signals. Use fixed percentage of equity for order size to capture the compounding effect. As a reversal strategy bear in mind that should market trend strongly in either direction stops will be required.
The RSI thresholds can be tailored to provide higher frequency or safer signals. Similarly tweaking MACD settings will provide earlier/more frequent or safer signals. As this is intended to enter near range high / low you should check the visual cues to ensure a ping-pong effect is observed, so that peaks and troughs are captured. Once an observable range is established the strategy works well across a range of crypto markets,
The script is open source, so feel free to amend as you wish. Using a different momentum oscillator may provide better results. I have prior coding experience, but first time using PineScript was last night, so it's not very tidy. I will update this with some additional customisation and TP/SL in the near future.
Usage: Range bound markets
Markets: Cryptocurrency Alts/BTC/ETH
Timeframe: 4h

Take Profit On Trend v2 (by BHD_Trade_Bot)The purpose of strategy is to detect long-term uptrend and short-term downtrend so that you can easy to take profit.
The strategy also using BHD unit to detect how big you win and lose, so that you can use this strategy for all coins without worry about it have different percentage of price change.
ENTRY
The buy order is placed on assets that have long-term uptrend and short-term downtrend:
- Long-term uptrend condition: ema200 is going up
- Short-term downtrend condition: 2 last candles are down price (use candlestick for less delay)
CLOSE
The sell order is placed when take profit or stop loss:
- Take profit: price increase 2 BHD unit
- Stop loss: price decrease 3 BHD unit
The strategy use $1000 for initial capital and trading fee is 0.1% for each order.
Pro tip: The 1-hour time frame for ETH/USDT has the best results on average.

Triple RSI strategyThis strategy is commonly used both in forex and stock markets for reversal trading. when the rsi line reaches and crosses simultaneously at 3 rsi setups i.e at 7, 14, and 21, a signal is generated.
This strategy works best in 1-hour timeframe. It provides over 60 to 80 percent accuracy in 1-hour timeframe.
In the stock market, this strategy provides an excellent entry point, if one is seeking small profits.
One can expect to make around 10 to 50 pips in the forex market easily. However, I advise seeking support from price action from the lower timeframe in the forex market.
I hope you like it.
Follow for more strategies and scripts like this.

Short Term RSI and SMA Percentage ChangeThis strategy utilises common indicators like RSI and moving averages in order to enter and exit trades. The Relative Strength Index (RSI) is a momentum indicator that has a value between 0 and 100, where a value greater than 70 is considered overbought and a value less than 30 is oversold. If the RSI value is above or below these values, then it can signal a possible trend reversal.
The second indicator used in this strategy is the Simple Moving Average (SMA). A SMA is an arithmetic moving average calculated by adding recent prices and then dividing that figure by the number of time periods in the calculation average. For example, one could add the closing price of a coin for a number of time periods and then divide this total by that same number of periods. Short-term averages respond quickly to changes in the price of the underlying coin, while long-term averages are slower to react.
Long/Exit orders are placed when three basic signals are triggered.
Long Position:
RSI is greater than 50
MA9 is greater than MA100
MA9 increases by 6%
Exit Position:
Price increases 5% trailing
Price decreases 5% trailing
The script is backtested from 1 May 2022 and provides good returns.
A trading fee of 0.1% is also taken into account and is aligned to the base fee applied on Binance.
This script also works well on AVAX 45m/1h, MATIC 15m/45m/1h and ETH 4h.

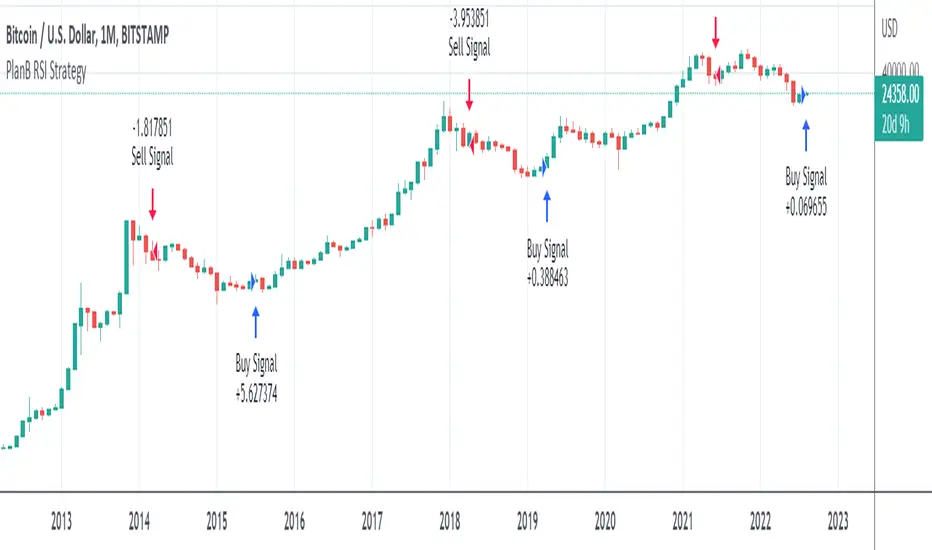
PlanB Quant Investing 101 v2This script has been Inspired by PlanB Article Quant Investing 101.
With this script, I implemented Plan B strategy outlined in that article, trying to reproduce his findings independently and allowing TradeView Users to do the same.
PlabB is aware of this effort, and he's positive about it, via Twitter commenting, liking and sharing of this resource .
Trading Idea:
This script uses RSI index to determine the Buy And Sell signal.
As per the original PlanB article:
IF ( RSI was above 90% last six months AND drops below 65%) THEN sell,
IF ( RSI was below 50% last six months AND jumps +2% from the low) THEN buy, ELSE hold
My simple code is aimed at replicating his study in Pine so that every TV user can check his signal.
Ichimoku Cloud with RSI (By Coinrule)The Ichimoku Cloud is a collection of technical indicators that show support and resistance levels, as well as momentum and trend direction. It does this by taking multiple averages and plotting them on a chart. It also uses these figures to compute a “cloud” that attempts to forecast where the price may find support or resistance in the future.
The Ichimoku Cloud was developed by Goichi Hosoda, a Japanese journalist, and published in the late 1960s. It provides more data points than the standard candlestick chart. While it seems complicated at first glance, those familiar with how to read the charts often find it easy to understand with well-defined trading signals.
The Ichimoku Cloud is composed of five lines or calculations, two of which comprise a cloud where the difference between the two lines is shaded in.
The lines include a nine-period average, a 26-period average, an average of those two averages, a 52-period average, and a lagging closing price line.
The cloud is a key part of the indicator. When the price is below the cloud, the trend is down. When the price is above the cloud, the trend is up.
The above trend signals are strengthened if the cloud is moving in the same direction as the price. For example, during an uptrend, the top of the cloud is moving up, or during a downtrend, the bottom of the cloud is moving down.
This strategy combines the Ichimoku Cloud with the RSI indicator to better enter trades.
Long/Short orders are placed when three basic signals are triggered.
Long Position:
Tenkan-Sen is above the Kijun-Sen
Chikou-Span is above the close of 26 bars ago
Close is above the Kumo Cloud
RSI is greater less than 50
Short Position:
Tenkan-Sen is below the Kijun-Sen
Chikou-Span is below the close of 26 bars ago
Close is below the Kumo Cloud
RSI is greater than 50
The script is backtested from 1 June 2022 and provides good returns.
The strategy assumes each order is using 30% of the available coins to make the results more realistic and to simulate you only ran this strategy on 30% of your holdings. A trading fee of 0.1% is also taken into account and is aligned to the base fee applied on Binance.
This script also works well on SOL (45m timeframe), BNB (1h timeframe), and ETH (1h timeframe).

RSI Improved strategySet a Horizontal Ray at the price that relates highest / lowest RSI .
It 's more clear to decide when to open long / short position manually.
It's a scalping strategy that works in 15min chart(basically works in most of timeframe , if you don't look it as a scalping strategy), when RSI hits Highest / Lowest value , the strategy will open a Long / Short position.
The Default Risk Reward Ratio was 1 (1600 points : 1600 points) you can adjust it in settings
You guys can look it as a RSI alert indicator
Think before you do , use it wisely. Thanks a lot!
There is a lot of useless words in Pine if you wanna look it please ignore it.

Bollinger Bands and RSI Short Selling (by Coinrule)The Bollinger Bands are among the most famous and widely used indicators. A Bollinger Band is a technical analysis tool defined by a set of trendlines plotted two standard deviations (positively and negatively) away from a simple moving average ( SMA ) of a security's price, but which can be adjusted to user preferences. They can suggest when an asset is oversold or overbought in the short term, thus provide the best time for buying and selling it.
The relative strength index ( RSI ) is a momentum indicator used in technical analysis . RSI measures the speed and magnitude of a security's recent price changes to evaluate overvalued or undervalued conditions in the price of that security. The RSI can do more than point to overbought and oversold securities. It can also indicate securities that may be primed for a trend reversal or corrective pullback in price. It can signal when to buy and sell. Traditionally, an RSI reading of 70 or above indicates an overbought situation. A reading of 30 or below indicates an oversold condition.
The short order is placed on assets that present strong momentum when it's more likely that it is about to decrease further. The rule strategy places and closes the order when the following conditions are met:
ENTRY
The closing price is greater than the upper standard deviation of the Bollinger Bands
The RSI is less than 70
EXIT
The trade is closed in profit when the RSI is less than 70
Upper standard deviation of the Bollinger Band is greater than the the closing price.
This strategy comes with a stop loss and a take profit, and as you can see by the results, it is well suited for a bear market.
This trade works very well with ETH (1h timeframe), AVA (4h timeframe), and SOL (3h timeframe) and is backtested from the 1 December 2021 to capture how this strategy would perform in a bear market.
To make the results more realistic, the strategy assumes each order to trade 30% of the available capital. A trading fee of 0.1% is taken into account. The fee is aligned to the base fee applied on Binance, which is the largest cryptocurrency exchange.

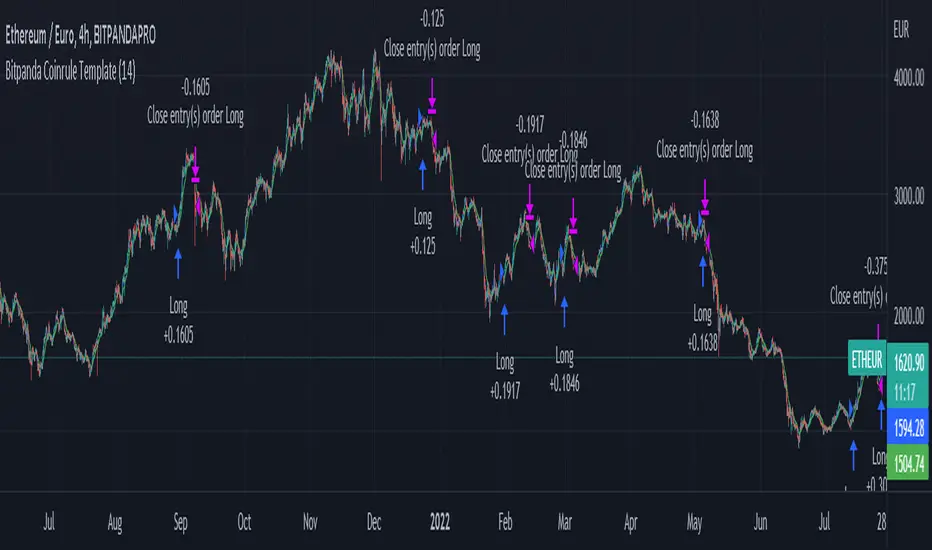
Bitpanda Coinrule TemplateThis strategy for Bitpanda on the Coinrule platform utilises 3 different conditions that have to be met to buy and 1 condition to sell. This strategy works best on the ETH/EUR pair on the 4 hour timescale.
In order for the strategy to enter the trade it must meet all of the conditions listed below.
ENTRY
RSI increases by 5
RSI is lower than 70
MA9 crosses above MA50
EXIT
MA50 crosses above MA9
This strategy works well on LINK/EUR on the 1 day timeframe, MIOTA/EUR on the 2 hour timeframe, BTC/EUR on the 4 hour timeframe and BEST/EUR on the 1 day timeframe (and 4h).
Back tested from 1 January 2020.
The strategy assumes each order is using 30% of the available coins to make the results more realistic and to simulate you only ran this strategy on 30% of your holdings. A trading fee of 0.1% is also taken into account and is aligned to the base fee applied on Binance.
Fib and RSI Strategy PineconnectorUse on 1m only For best results
strategy check for RSI overbought or oversold when key Fib levels are hit
Optimisez to use with Pineconnector using alerts with {{strategy.order.alert_message}}
Feel free to comment or DM if you want to improve
Enjoy

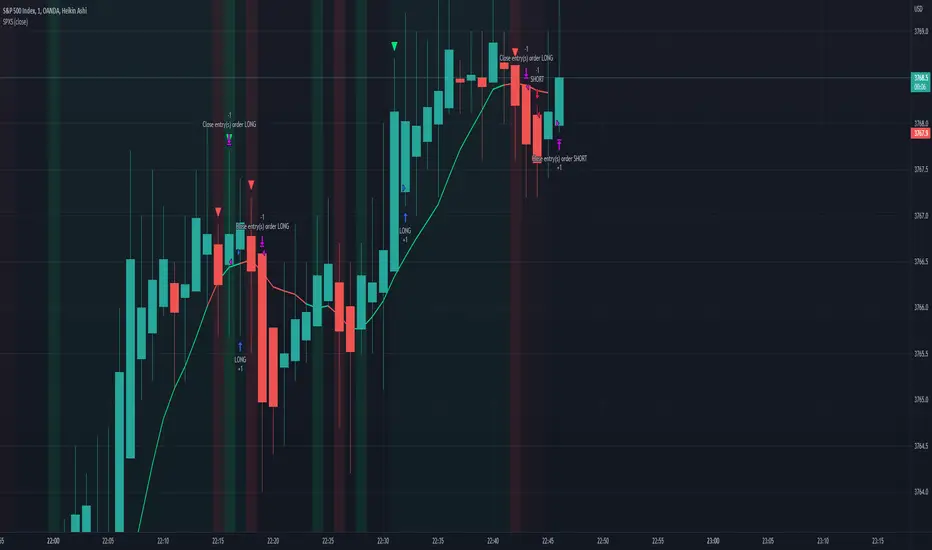
SPX Scalping StrategyThis strategy points out good entries and exits to go with the direction of SPY
Used with:
Ticker: SPX 500 USD
Heiken Ashi Candles
1, 3, 5 min timeframe