Market Structure DashboardThis indicator displays a **multi-timeframe dashboard** that helps traders track market structure across several horizons: Monthly, Weekly, Daily, H4, H1, M15, and M5.
It identifies the current trend (Bullish, Bearish, or Neutral) based on the progression of **swing highs and lows** (HH/HL, LH/LL).
For each timeframe, the dashboard shows:
* The **current structure** (Bullish, Bearish, Neutral) with a clear color code (green, red, gray).
* **Pivot information**:
* either the latest swing high/low values,
* or the exact date and time of their occurrence (user-selectable in the settings).
An integrated **alert system** notifies you whenever the market structure changes (e.g., "Daily: Neutral → Bullish").
### Key Features:
* Clear overview of multi-timeframe market structures.
* Customizable pivot info display (values or timestamps).
* Built-in alerts on trend changes.
* Compact and readable dashboard, displayed in the top-right corner of the chart.
This tool is ideal for traders who want to quickly assess the **overall market structure** across multiple timeframes and be instantly alerted to potential reversals.
Multitimeframe

Swing Dashboard - Pro Trader Metrics with MTF & Enhanced VolumeDESCRIPTION:
A comprehensive real-time dashboard designed for swing traders and active investors trading US equities. Displays all critical metrics in one customizable panel overlay - no need to clutter your chart with multiple indicators.
KEY FEATURES:
📊 Relative Strength Analysis:
Stock vs Market (SPY/QQQ/IWM/DIA)
Stock vs Sector (automatic sector ETF detection)
Sector vs Market comparison
Customizable lookback period (5-60 days)
📈 Price & Range Metrics:
Daily range, change, and gap percentages
Distance from SMA20, SMA50, VWAP
52-week position percentage
ATR% and ADR% for volatility assessment
Range/ADR ratio for breakout detection
💪 Advanced Volume Analysis:
RVOL (full day volume vs 20-day average)
Volume Strength (bar-by-bar analysis)
Volume Trend (5-day vs 20-day momentum)
Customizable RVOL alert thresholds
Non-repainting volume calculations
⚙️ Multi-Timeframe (MTF) Mode:
View daily charts with 5-min or 15-min metric updates
Perfect for monitoring positions without switching timeframes
All calculations remain accurate across timeframes
🎨 Fully Customizable:
Choose which metrics to display
9 position options for the dashboard
Adjustable text size and colors
Toggle individual metrics on/off
Sector-specific ETF mapping for accurate RS calculations
TECHNICAL SPECIFICATIONS:
✅ Non-repainting - all calculations use confirmed bar data
✅ No lookahead bias or future data
✅ Optimized for US stocks with proper sector mapping
✅ Works on any timeframe (best on 5m-Daily)
✅ Pine Script v6 with best practices
✅ Handles edge cases and missing data gracefully
IDEAL FOR:
Swing traders monitoring multiple positions
Day traders needing quick metric overview
Investors tracking relative strength and momentum
Anyone who wants institutional-grade metrics in one place
SECTOR ETF MAPPING:
Automatically maps to correct sector ETFs: XLK, XLF, XLV, XLY, XLP, XLE, XLB, XLI, XLRE, XLC, XLU
HOW TO USE:
Green = Positive/Strong | Red = Negative/Weak | White = Neutral
RS > 0 = Outperforming benchmark/sector
RVOL > 1.5x = High volume day
VWAP% negative = Price below VWAP (mean reversion opportunity)
R/ADR > 100% = Extended range (potential exhaustion)
Perfect for traders who need professional-grade analysis without chart clutter.
TAGS:
dashboard, swing, relativestrengrh, sectoranalysis, volume, rvol, multitimeframe, mtf, tradingdashboard, metrics, daytrading, swingtrading, momentum, vwap, atr, volatility, volumeanalysis

Predicted Funding RatesOverview
The Predicted Funding Rates indicator calculates real-time funding rate estimates for perpetual futures contracts on Binance. It uses triangular weighting algorithms on multiple different timeframes to ensure an accurate prediction.
Funding rates are periodic payments between long and short position holders in perpetual futures markets
If positive, longs pay shorts (usually bullish)
If negative, shorts pay longs (usually bearish)
This is a prediction. Actual funding rates depend on the instantaneous premium index, derived from bid/ask impacts of futures. So whilst it may imitate it similarly, it won't be completely accurate.
This only applies currently to Binance funding rates, as HyperLiquid premium data isn't available. Other Exchanges may be added if their premium data is uploaded.
Methods
Method 1: Collects premium 1-minunute data using triangular weighing over 8 hours. This granular method fills in predicted funding for 4h and less recent data
Method 2: Multi-time frame approach. Daily uses 1 hour data in the calculation, 4h + timeframes use 15M data. This dynamic method fills in higher timeframes and parts where there's unavailable premium data on the 1min.
How it works
1) Premium data is collected across multiple timeframes (depending on the timeframe)
2) Triangular weighing is applied to emphasize recent data points linearly
Tri_Weighing = (data *1 + data *2 + data *3 + data *4) / (1+2+3+4)
3) Finally, the funding rate is calculated
FundingRate = Premium + clamp(interest rate - Premium, -0.05, 0.05)
where the interest rate is 0.01% as per Binance
Triangular weighting is calculated on collected premium data, where recent data receives progressively higher weight (1, 2, 3, 4...). This linear weighting scheme provides responsiveness to recent market conditions while maintaining stability, similar to an exponential moving average but with predictable, linear characteristics
A visual representation:
Data points: ──────────────>
Weights: 1 2 3 4 5
Importance: ▂ ▃ ▅ ▆ █
How to use it
For futures traders:
If funding is trending up, the market can be interpreted as being in a bull market
If trending down, the market can be interpreted as being in a bear market
Even used simply, it allows you to gauge roughly how well the market is performing per funding. It can basically be gauged as a sentiment indicator too
For funding rate traders:
If funding is up, it can indicate a long on implied APR values
If funding is down, it can indicate a short on implied APR values
It also includes an underlying APR, which is the annualized funding rate. For Binance, it is current funding * (24/8) * 365
For Position Traders: Monitor predicted funding rates before entering large positions. Extremely high positive rates (>0.05% for 8-hour periods) suggest overleveraged longs and potential reversal risk. Conversely, extreme negative rates indicate shorts dominance
Table:
Funding rate: Gives the predicted funding rate as a percentage
Current premium: Displays the current premium (difference between perpetual futures price and the underlying spot) as a percentage
Funding period: You can choose between 1 hour funding (HyperLiquid usually) and 8 hour funding (Binance)
APR: Underlying annualized funding rate
What makes it original
Whilst some predicted funding scripts exist, some aren't as accurate or have gaps in data. And seeing as funding values are generally missing from TV tickers, this gives traders accessibility to the script when they would have to use other platforms
Notes
Currently only compatible with symbols that have Binance USDT premium indices
Optimal accuracy is found on timeframes that are 4H or less. On higher timeframes, the accuracy drops off
Actual funding rates may differ
Inputs
Funding Period: Choose between "8 Hour" (standard Binance cycle) or "1 Hour" (divides the 8-hour rate by 8 for granular comparison)
Plot Type: Display as "Funding Rate" (percentage per interval) or "APR" (annualized rate calculated as 8-hour rate × 3 × 365)
Table: Toggle the information table showing current funding rate, premium, funding period, and APR in the top-right corner
Positive Colour: Sets the colour for positive funding rates where longs pay shorts (default: #00ffbb turquoise)
Negative Colour: Sets the colour for negative funding rates where shorts pay longs (default: red)
Table Background: Controls the background colour and transparency of the information table (default: transparent dark blue)
Table Text Colour: Sets the colour for all text labels in the information table (default: white)
Table Text Size: Controls font size with options from Tiny to Huge, with Small as the default balance of readability and space

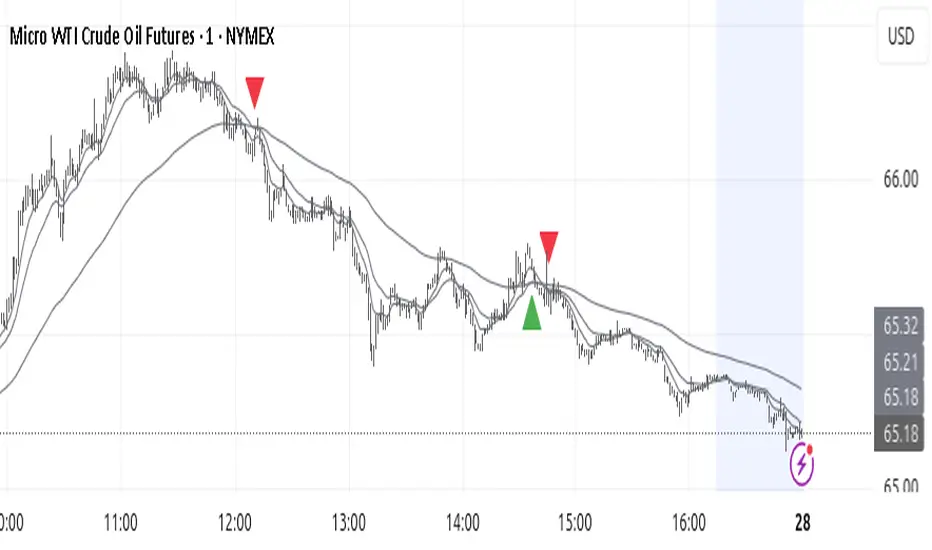
HTF Candle Highs and Lows with Labels + High Probability Signals█ OVERVIEW
This indicator overlays Weekly, Daily, and H4 High/Low levels directly onto your chart, allowing traders to visualize key support and resistance zones from higher timeframes. It also includes high probability breakout signals that appear one candle after a confirmed breakout above or below these levels, filtered by volume and candle strength.
Use this tool to identify breakout opportunities with greater confidence and clarity.
█ FEATURES
• Plots Weekly, Daily, and H4 High and Low levels using request.security. • Customizable line colors, widths, and label sizes. • Toggle visibility for each timeframe independently. • Signals appear one candle after a confirmed breakout: • Bullish: Close above HTF High, strong candle, high volume. • Bearish: Close below HTF Low, strong candle, high volume. • Signal shapes match the color of the broken level for visual clarity.
█ HOW TO USE
1 — Enable the timeframes you want to track using the input toggles. 2 — Watch for triangle-shaped signals: • Upward triangle = Bullish breakout. • Downward triangle = Bearish breakout. 3 — Confirm the breakout: • Candle closes beyond the HTF level by at least 0.1%. • Candle body shows momentum (close > open for bullish, close < open for bearish). • Volume exceeds 20-period average. 4 — Enter trade on the candle after the signal. 5 — Use the HTF level as a reference for stop-loss placement. 6 — Combine with other indicators (e.g., RSI, EMA) for confluence.
█ LIMITATIONS
• Signals may lag by one candle due to confirmation logic. • Not optimized for low-volume assets or illiquid markets. • Best used in trending environments; avoid during consolidation. • Does not include automatic alerts (can be added manually).
█ BEST PRACTICES
• Use on H1 or higher timeframes for cleaner signals. • Avoid trading during news events or low volatility. • Backtest thoroughly before live trading. • Adjust breakout percentage and volume filter based on asset volatility. • Maintain a trading journal to track performance.

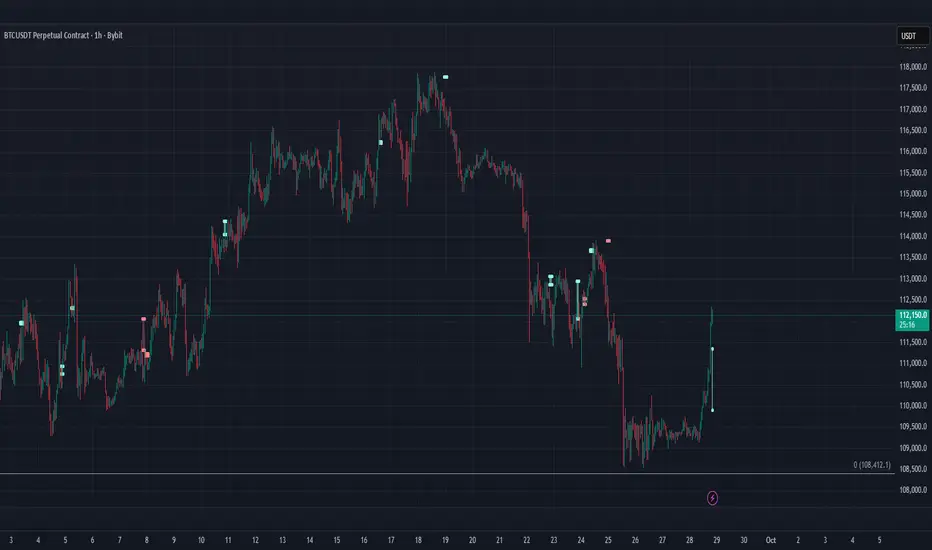
CME Gap Finder - BTC (Adjustable TF)This is a CME Futures gap finder that has a variable timeframe. Great for finding long term trades or short term depending on the time frame. 1hr chart to 3 hr gaps. 4 hr chart to 3 day on gaps.
Trend TraderThe Trend Trader indicator is a trend-following tool based on a triple EMA (Exponential Moving Average) setup designed to help traders identify market direction and potential reversal zones. It plots three customizable EMAs on the chart to highlight bullish and bearish momentum, then generates trade signals when price shows a strong likelihood of continuing in the direction of the prevailing trend.
EMA Alignment: The indicator checks for bullish stacking (fast EMA above medium, medium above slow) and bearish stacking (fast EMA below medium, medium below slow). This alignment defines the prevailing market trend.
Trend Validation: A user-defined lookback period ensures signals are only taken if the market recently displayed a stacked trend, thus filtering false entries during consolidations.
Signal Generation: Buy signals appear when price dips into the zone between the fast and medium EMAs during a bullish trend. Sell signals appear when price rallies into the zone between the fast and medium EMAs during a bearish trend.
Alerts: Built-in alerts notify traders of new trade opportunities without having to constantly watch the chart.
This indicator is suitable for swing trading and intraday strategies across multiple markets, including forex, stocks, indices, and crypto.
Suggested Strategy for Profitability
This tool is best used as part of a structured trend-trading plan. Below is a suggested framework:
Entry Rules
Long (Buy Trade):
Confirm that EMA alignment is bullish (EMA1 > EMA2 > EMA3).
Wait for a Buy Signal (triangle up below price).
Ensure the higher timeframe (e.g., 4H if trading 1H) trend is also bullish to filter trades.
Short (Sell Trade):
Confirm EMA alignment is bearish (EMA1 < EMA2 < EMA3).
Wait for a Sell Signal (triangle down above price).
Higher timeframe should also be bearish to increase probability.
Stop Loss
For long positions, place the stop loss just below EMA3 or the most recent swing low.
For short positions, place the stop loss just above EMA3 or the most recent swing high.
Take Profit
Conservative: Set TP at 1.5x to 2x the stop loss distance.
Aggressive: Trail stop loss below EMA2 (for longs) or above EMA2 (for shorts) to capture larger trends.
Risk Management
Use no more than 1–2% of account risk per trade.
Trade only when the signal aligns with overall market context (higher timeframe, support/resistance, or volume confirmation).
This indicator is very similar to the indicator "Trend Scalper" by the same developer, the difference is this indicator is used to just find the trade and hold the trade or to find the reversal of a trend instead of triggering alerts every time price enters between EMA1 and EMA2.
CVD Divergences (cdikici71 x tncylyv)CVD Divergence
Summary
This indicator brings the powerful and creative divergence detection logic from @cdikici71's popular "cd_RSI_Divergence_Cx" script to the world of volume analysis.
While RSI is a fantastic momentum tool, I personally choose to rely on volume as a primary source of truth. This script was born from the desire to see how true buying and selling pressure—measured by Cumulative Volume Delta (CVD)—diverges from price action. It takes the brilliant engine built by @cdikici71 and applies it to CVD, offering a unique look into market conviction.
What is Cumulative Volume Delta (CVD)?
CVD is a running total of volume that transacted at the ask price (buying) minus volume that transacted at the bid price (selling). In simple terms, it shows whether buyers or sellers have been more aggressive over a period. A rising CVD suggests net buying pressure, while a falling CVD suggests net selling pressure.
Core Features
• Divergence Engine by @cdikici71: The script uses the exact same two powerful methods for finding divergences as the original RSI version:
o Alignment with HTF Sweep: The default, cleaner method for finding high-probability divergences.
o All: A more sensitive method that finds all possible divergences.
• Anchored CVD Periods: You can choose to reset the CVD calculation on a Daily, Weekly, or Monthly basis to analyze buying and selling pressure within specific periods. Or, you can leave it on Continuous to see the all-time flow.
• Automatic Higher Timeframe (HTF) Alignment: To remove the guesswork, the "Auto-Align HTF" option will automatically select a logical higher timeframe for divergence analysis based on your current chart (e.g., 15m chart uses 4H for divergence, 1H chart uses 1D, etc.). You can also turn this off for full manual control.
• Fully Customizable Information Table: An on-screen table keeps you updated on the divergence status. You can easily adjust its Position and Size in the settings to fit your chart layout.
• Built-in Alerts: Alerts are configured for both Bullish and Bearish divergences to notify you as soon as they occur.
How to Use This Indicator
The principle is the same as any divergence strategy, but with the conviction of volume behind it.
• 🔴 Bearish Divergence: Price makes a Higher High, but the CVD makes a Lower High or an equal high. This suggests that the buying pressure is weakening and may not be strong enough to support the new price high.
• 🟢 Bullish Divergence: Price makes a Lower Low, but the CVD makes a Higher Low or an equal low. This suggests that selling pressure is exhausting and the market may be ready for a reversal.
Always use divergence signals as a confluence with your own analysis, support/resistance levels, and market structure.
Huge Thanks and Credit
This script would not exist without the brilliant and creative work of @cdikici71. The entire divergence detection engine, the visualization style, and the core logic are based on his original masterpiece, "cd_RSI_Divergence_Cx". I have simply adapted his framework to a different data source.
If you find this indicator useful, please go and show your support for his original work!
________________________________________
Disclaimer: This is a tool for analysis, not a financial advice signal service. Please use it responsibly as part of a complete trading strategy.

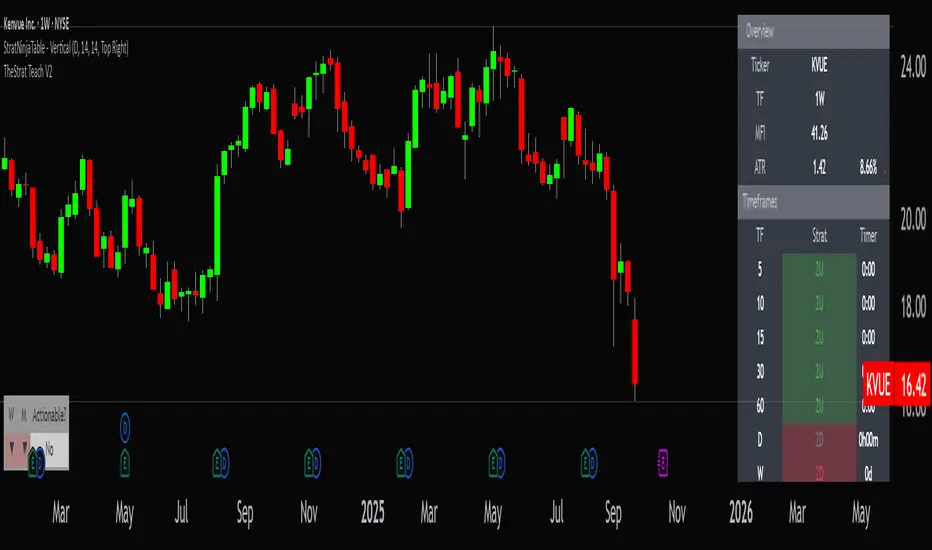
StratNinjaTable - VerticalA Pine Script v6 indicator that displays a vertical table with key The Strat data and supporting metrics.
✦ Table Structure:
Overview:
Ticker – the stock symbol.
TF – the chart’s main timeframe.
MFI – Money Flow Index with selectable timeframe.
ATR – Average True Range with color coding:
Green – below 3%.
Yellow – between 3% and 6%.
Red – above 6%.
Timeframes:
Displayed vertically (5m, 15m, 1H, D, W, M, etc.).
Each shows the current bar type according to The Strat (1, 2U, 2D, 3).
Text color reflects candle direction (green = close above open, red = close below open).
Includes a countdown timer to bar close.
Fundamentals:
Market Cap – in billions.
Sector – stock sector.
SMA20 Δ – distance from the 20-period SMA (in %).
Avg Volume (30d) – average 30-day volume (in millions).
✦ Adjustments Made:
Removed the Strat Pattern section completely.
Removed the DIR column – direction is now represented by Strat cell text color.
Reordered Overview section: Ticker → TF → MFI → ATR.
ATR now has three levels of coloring (Green/Yellow/Red) for >3% and >6%
EMA KitEMA Kit delivers multiple 1D EMA's wrapped into a single indicator.
I was annoyed with having a bunch of EMA indicators on the left side of my chart for each individual EMA I rely on, so I created a single indicator with all of them.
This EMA kit allows you to select any combination of the following EMA's: 3D, 5D, 8D, 21D, 34D, 50D, 100D, 200D, and 200W. They are all based on the 1D timeframe regardless of the timeframe you're currently viewing on your chart - for example, if you toggle from a Daily chart to a 15 minute chart, the EMA's won't change to reflect the 15 minute timeframe. EMA Kit smoothes the lines to prevent staggering on lower timeframes. You can change the color scheme and line thickness and even toggle between different line types like area, histogram, etc. You also have the option to turn end-of-line price labels on/off. Current price level for each EMA is highlighted on the price scale.

Trend ScalperThe Trend Scalper is a simple EMA-based trend-following and scalping indicator designed to help traders identify potential long and short trading opportunities on any timeframe. It uses a three-EMA strategy to filter trades in the direction of the prevailing trend while refining entry signals based on price reactions to the EMAs.
Here’s how it works:
It calculates three Exponential Moving Averages (EMA) with customizable lengths (default: 9, 21, and 89).
A long signal is generated when the EMAs align in bullish order (EMA1 > EMA2 > EMA3) and the price low dips into the zone between EMA1 and EMA2. This indicates a pullback into short-term support while the broader trend remains bullish.
A short signal is generated when the EMAs align in bearish order (EMA1 < EMA2 < EMA3) and the price high rises into the zone between EMA1 and EMA2. This indicates a pullback into resistance within a bearish trend.
The EMAs are plotted on the chart for visual guidance, while buy and sell signals are displayed as up and down triangles directly on price bars.
Best use practices:
The indicator works best as a trend continuation scalping tool, aiming to join established market direction after minor pullbacks.
It is most effective on liquid assets and in trending market conditions. Avoid relying on signals during sideways or choppy markets.
For confirmation, combine with volume, momentum oscillators, or higher timeframe trend analysis.
Risk management is critical: consider setting stop losses beyond EMA zones or recent swing highs/lows, and use take profits that match your risk-reward plan.
This indicator provides clean, rule-based signals that help traders time entries within the broader context of the trend. It is not a standalone strategy but a tool to assist in disciplined trade execution.

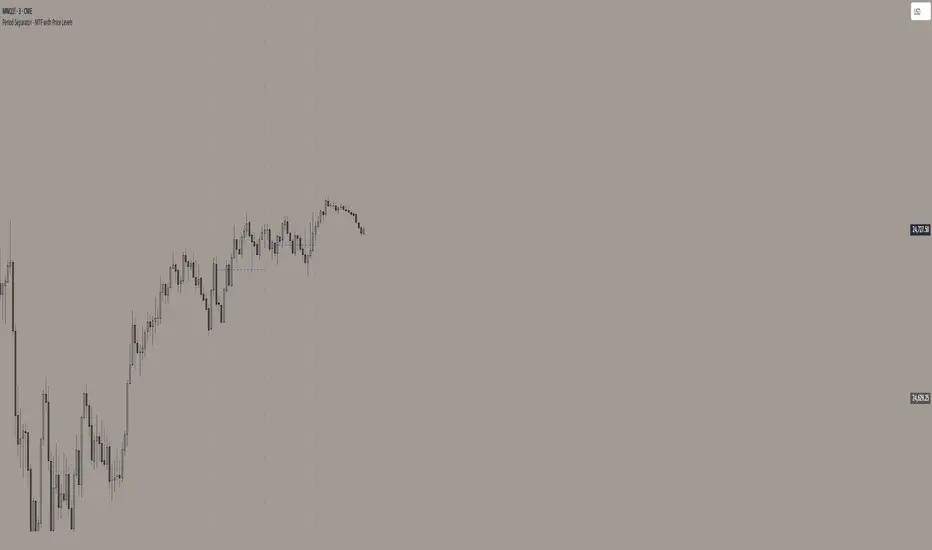
Period Separator - MTF with Price LevelsPeriod Separator - MTF with Price Levels
A customizable multi-timeframe period separator indicator that displays a user-defined number of vertical lines with corresponding horizontal price levels.
Key Features:
Multi-Timeframe Support: Works with all timeframes from 1-minute to yearly (12M, 3M, M, W, D, 4H, 1H, 15m, 5m, 1m)
Complete Price Level Analysis: Shows horizontal lines for High, Low, 0.75, 0.50, 0.25, and Open levels for all visible periods between vertical separators
Seconds Chart Compatibility: Special 1-minute separator option for seconds timeframes
Full Customization: Independent color, style, and width settings for all lines
Smart Alerts: Optional price break alerts for high/low levels with sound options
Clean Memory Management: Automatically manages line objects to prevent chart clutter
Sliding Window Display: Set exactly how many vertical separator lines to show (1-20), with older lines automatically removed as new periods begin
Perfect for:
Session/period analysis with controlled visual complexity
Support/resistance level identification across multiple periods
Fibonacci-style level trading between defined time periods
Clean chart presentation with limited historical data display
Settings:
Number of Vertical Lines: Controls exactly how many period separators are visible
All price levels can be toggled on/off independently
Comprehensive styling options for professional chart presentation
Ideal for traders who want period-based analysis without overwhelming their charts with too many historical lines.

10MAs + BB10 MAs riboon + Bollinger Bands
I used two basic Multiple MA ribbons. so I just merge them to one indicaotor

Disparity Index with 4 EMAsDisparity Index with 4 EMAs
(ema - close ) / ema * 100
or
(ema - close0 / close * 100

Opening Range TraderThis indicator, "Opening Range Trader," provides visual tools for defining and tracking two customizable intraday ranges plus today’s open, high, and low. It is designed for day traders to identify support, resistance, and breakout opportunities by automatically marking key price levels that often shape the day's momentum.
It offers:
Customizable start and end times for two independent time ranges.
Toggle options to display lines for the selected ranges and for today’s open, high, and low.
Automatic adaptation for New York market hours.
Real-time updates for session highs/lows and today’s evolving levels.
Traders use this to watch for breakouts above or below the opening range (ORB strategy), to fade false moves when price returns inside the range, or to participate in trending moves after volatility begins. A common setup is entering long on closes above the range high, or short on closes below the range low, with stops and targets based on the range’s width or the opposite boundary.
Risk management approaches include placing stop losses at the midpoint or at the opposite end of the range, and adjusting targets for measured moves. Volume confirmation can help filter valid breakouts, while adapting times for specific assets and trading styles maximizes flexibility.
The second range allows traders to repeat similar strategies later in the session for evolving momentum windows, making this indicator useful for multiple intraday setups.

Bullish_1Hour_entry_Indicator with AlertsIt uses EMAs convergence & VWAP confirmation along with multi Time frame analysis

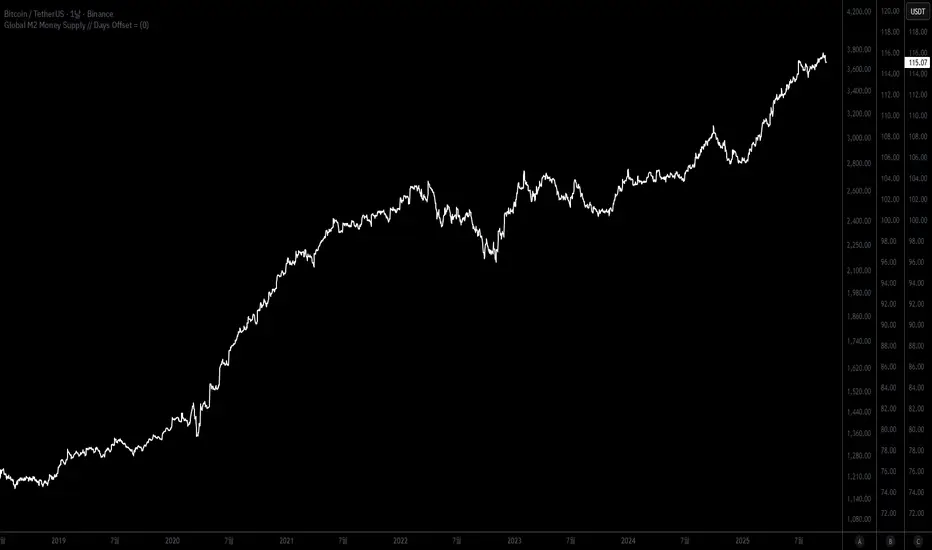
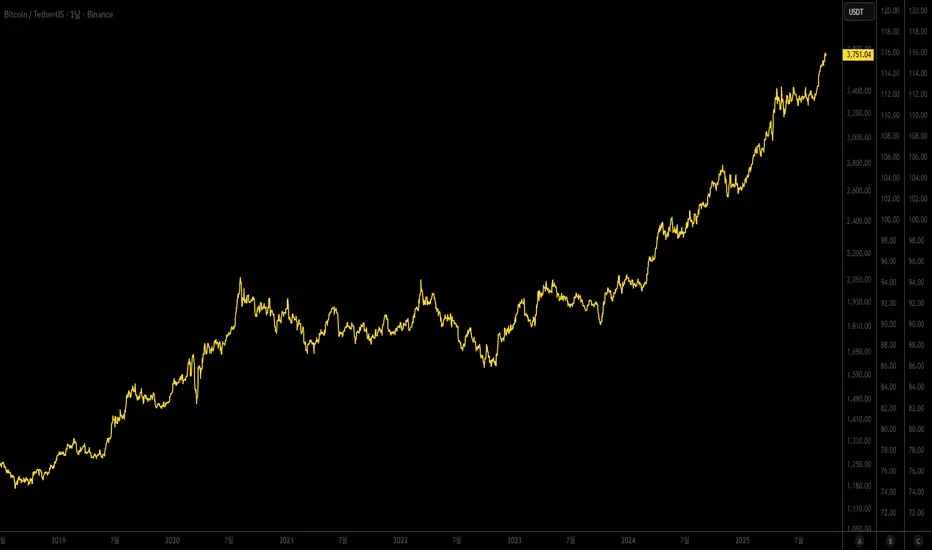
Global M2 Money SupplyThis indicator calculates and plots an aggregated estimate of the Global M2 money supply, expressed in U.S. dollar terms. It combines M2 data from major economies and regions—including the U.S., Eurozone, Canada, the U.K., Switzerland, China, Japan, India, Brazil, and others—and adjusts each by its respective FX rate to USD. By summing these series, the script provides a broad view of worldwide liquidity conditions in one line.
A user-defined offset in days allows you to shift the global M2 line forward or backward, making it easier to visually compare liquidity trends against asset prices such as Bitcoin, gold, or equities. This tool is designed for traders and macro observers who want to study how global money supply growth or contraction correlates with financial markets over time.
이 지표는 전 세계 주요 국가와 지역의 M2 통화량을 달러 기준으로 합산하여 글로벌 유동성 지표로 보여줍니다. 미국, 유로존, 캐나다, 영국, 스위스, 중국, 일본, 인도, 브라질 등 여러 지역의 M2 데이터를 각 통화의 환율(USD 환산)로 조정한 뒤 합산해 하나의 흐름으로 표현합니다. 이를 통해 글로벌 차원의 통화 공급 변화를 한눈에 파악할 수 있습니다.
또한 사용자가 지정한 일 단위 오프셋 기능을 통해 글로벌 M2 라인을 앞뒤로 이동시켜, 비트코인·금·주식 등 다양한 자산 가격과의 시차적 관계를 직관적으로 비교할 수 있습니다. 거시경제 환경과 자산시장 간의 상관성을 연구하거나 시장 유동성 추이를 모니터링하려는 투자자에게 유용한 도구입니다.
Gold Lagging (N days)This indicator overlays the price of gold (XAUUSD) on any chart with a customizable lag in days. You can choose the price source (open, high, low, close, hlc3, ohlc4), shift the series by a set number of daily bars, and optionally normalize the values so that the first visible bar equals 100. The original gold line can also be displayed alongside the lagged series for direct comparison.
It is especially useful for analyzing delayed correlations between gold and other assets, observing shifts in safe-haven demand, or testing hypotheses about lagging market reactions. Since the lag is calculated on daily data, it remains consistent even if applied on intraday charts, while the indicator itself can be plotted on a separate price scale for clarity.
이 지표는 금(XAUUSD) 가격을 원하는 차트 위에 N일 지연된 형태로 표시합니다. 가격 소스(시가, 고가, 저가, 종가, hlc3, ohlc4)를 선택할 수 있으며, 지정한 일 수만큼 시리즈를 뒤로 이동시킬 수 있습니다. 또한 첫 값 기준으로 100에 맞춰 정규화하거나, 원래 금 가격선을 함께 표시해 비교할 수도 있습니다.
금과 다른 자산 간의 지연 상관관계를 분석하거나 안전자산 수요 변화를 관찰할 때 유용하며, 시장 반응의 시차 효과를 검증하는 데에도 활용할 수 있습니다. 지연은 일봉 데이터 기준으로 계산되므로 단기 차트에 적용해도 일 단위 기준이 유지되며, 별도의 가격 스케일에 표시되어 가독성을 높일 수 있습니다.
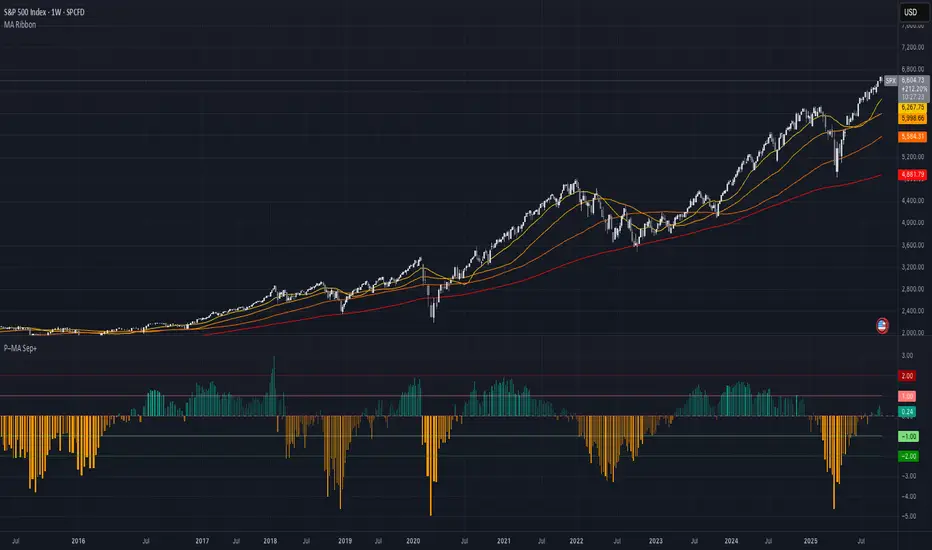
Price–MA Separation (Z-Score)Price–MA Separation (Z-Score + Shading)
This indicator measures how far price is from a chosen moving average and shows it in a separate pane.
It helps traders quickly spot overextended moves and mean-reversion opportunities.
⸻
What it does
• Calculates the separation between price and a moving average (MA):
• In Points (Price − MA)
• In Percent ((Price / MA − 1) × 100%)
• Converts that separation into a Z-Score (statistical measure of deviation):
• Z = (Separation − Mean) ÷ StdDev
• Highlights when price is unusually far from the MA relative to its recent history.
⸻
Visuals
• Histogram bars:
• Green = above the MA,
• Orange = below the MA.
• Intensity increases with larger Z-Scores.
• Zero line: red baseline (price = MA).
• Z threshold lines:
• +T1 = light red (mild overbought)
• +T2 = dark red (strong overbought)
• −T1 = light green (mild oversold)
• −T2 = dark green (strong oversold)
• Default thresholds: ±1 and ±2.
⸻
Settings
• MA Type & Length: Choose between SMA, EMA, WMA, VWMA, or SMMA (RMA).
• Units: Show separation in Points or Percent.
• Plot Mode:
• Raw = distance in points/percent.
• Z-Score = standardized deviation (default).
• Absolute Mode: Show only magnitude (ignore direction).
• Smoothing: Overlay a smoothed line on the histogram.
• Z-Bands: Visual guides at ± thresholds.
⸻
How to use
• Look for large positive Z-Scores (red zones): price may be stretched far above its MA.
• Look for large negative Z-Scores (green zones): price may be stretched far below its MA.
• Use as a mean-reversion signal or to confirm trend exhaustion.
• Works well with:
• Swing entries/exits
• Overbought/oversold conditions
• Filtering other signals (RSI, MACD, VWAP)
⸻
Notes
• Z-Scores depend on the lookback window (default = 100 bars). Adjust for shorter/longer memory.
• Strong deviations don’t always mean reversal—combine with other tools for confirmation.
• Not financial advice. Always manage risk.
⸻
Try adjusting the MA length and Z-Score thresholds to fit your trading style.
Nadaraya-Watson Multi-TF DashboardThis script is a Multi-Timeframe Flip State Dashboard based on Nadaraya-Watson: Rational Quadratic Kernel (Non-Repainting) indicator. It visualizes trend "flip" states across up to 8 custom timeframes using a consistent, non-repainting methodology. Built on 1-minute data, each timeframe row in the table updates only after its bar fully closes, ensuring accuracy and eliminating repainting issues.
Key features:
✅ Based on the Nadaraya-Watson Rational Quadratic Kernel, used to estimate trend direction
🧠 Each timeframe uses the same base 1-minute data for consistency across resolutions
🔄 Flip state detection is defined by slope reversals in the kernel regression
🧱 Fully supports non-repainting, close-confirmed states using lookahead=off
🧮 Configurable lookback window, kernel weighting, lag, and timeframes
🎨 Visual dashboard plots each TF’s state as a colored cell (green for bullish, red for bearish)
🛠️ Includes inline plots and debug traces to help visualize regression and flip logic
This dashboard is ideal for traders who want a compact visual overview of confirmed trend shifts across multiple timeframes, all using a mathematically grounded, TF-consistent model.

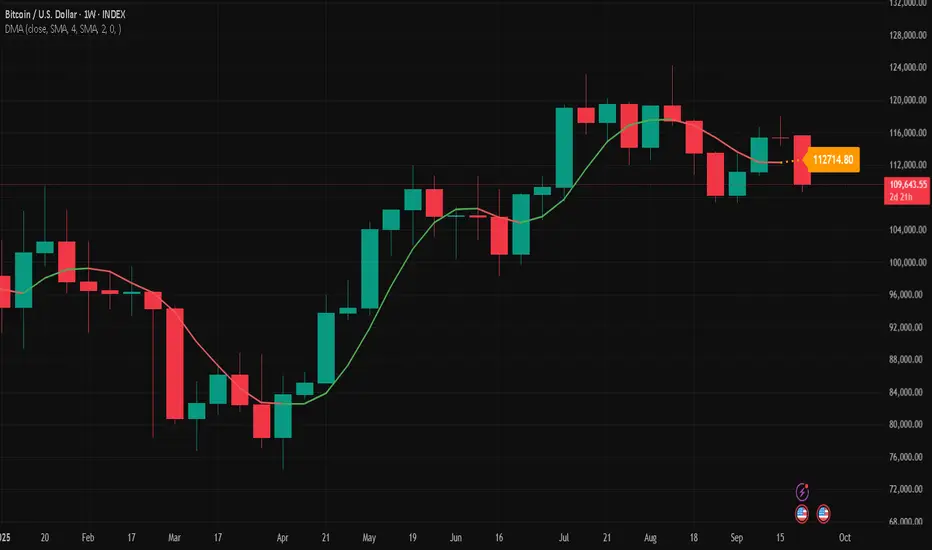
Double Moving Average█ OVERVIEW
The Double Moving Average (DMA) smooths one moving average with a second moving average.
Includes moving average type, higher timeframe, offset, alerts, and style settings for all of the indicator's visual components. This indicator includes an optional line and label to indicate the latest value of the DMA that repaints.
█ CONCEPTS
Shorter term moving averages, especially in choppy markets, can rapidly increase and decrease their slope. Which could lead some traders into assuming that the series trend may continue at that steeper slope. By smoothing a moving average with another one, the magnitude of rapid choppy movements is mitigated.
█ FEATURES
DMA Customization
Most inputs have a tooltip that can be read by interacting with the information icon to guide users.
For both moving averages in the DMA, users can set the lookback length and moving average type independently. Available moving average types include:
Simple Moving Average
Exponential Moving Average
Hull Moving Average
Weighted Moving Average
Volume Weighted Moving Average
A bar offset setting is included for shifting the indicator's placement. Using different lookback combinations for both averages alongside an offset can create equivalent values of other types of moving averages not included in this indicator. For example, if the default lookback settings are offset by 1 bar, this duplicates a 4 period centered moving average.
Colors for the DMA's plot can toggle between a single "base" color, or using increasing and decreasing colors. Changing the plot's style, line style, and width is also supported.
Latest Value Line and Label
The latest value of the DMA plot is replaced by default with a feature called the Latest Value Line and Label: a stylized line and label to help indicate the part of the indicator that can repaint from the parts that don't repaint. Data used to draw this feature is calculated separately from the indicator's confirmed historical calculations.
A label is included to display the latest value of the DMA which includes complete style settings. The style of both the line and label are completely customizable; every style feature that can be included has a corresponding input you can set.
Toggling off the Latest Value Line and Label feature will cause all the respective style inputs to deactivate so that they're no longer in focus or editable until the feature is toggled on again.
Higher Timeframes
Users can plot the DMA from higher timeframes on their chart.
As new bars print, the non-repainting DMA historical plot uses the last confirmed higher timeframe value. The repainting Latest Value Line and Label will update with the most recent higher timeframe value only for the latest bar. If the Latest Value Line feature is toggled off, the last confirmed higher timeframe DMA value is plotted up to the latest bar.
The built-in Moving Average Simple (SMA) indicator includes several of the features in this indicator, like an option for using higher timeframe. However, by default, it plots no values except on bars with higher timeframe close updates. Disabling "Wait for timeframe closes" to get values between updates causes repainting in both replay mode and realtime bars.
Since the calculations that repaint are separate and optional in the DMA indicator, historical plotted values will not repaint in replay mode or on realtime bars while using higher timeframes.
Alerts
There are two DMA value options when creating an alert:
DMA Latest Value: Use the latest updating DMA Value. The same value as the Latest Value Line.
DMA Last Confirmed Value: Use the last historical closed DMA value.
The default alert option is DMA Latest because most users expect alerts when the price crosses the latest updating DMA value. The Last Confirmed Value alert option uses the DMA value from the latest confirmed historical bar.
When creating an alert you should see a "Caution!" warning saying, "This is due to calculations being based on an indicator or strategy that can get repainted." This warning is intentional because the DMA indicator's Latest Value Line and Label feature is supposed to repaint in order to display the latest value.
█ FOR Pine Script™ CODERS
StyleLibrary is used to create user-friendly plot, line, and label style enum type inputs. The library's functions then take those user inputs and convert them into the appropriate values/built-in constants to customize styles for plot, line, and label functions.
Titles for #region blocks are included after #endregion statements for clarity when multiple #endregion statements occur.
This indicator utilizes the new active parameter for style inputs of togglable features.
Multi-TF 👀### Multi-Timeframe Analysis (MTF-Analysis)
**Overview**
The Multi-Timeframe Analysis indicator is a powerful visualization tool designed for traders who incorporate multi-timeframe (MTF) strategies into their decision-making process. It overlays compact, customizable candle representations from up to four higher timeframes directly on your chart, positioned to the right of the last bar for quick reference. This allows you to monitor price action, momentum via EMAs, and key levels like Fair Value Gaps (FVGs) across multiple resolutions without switching charts. Built with efficiency in mind, it supports automatic timeframe detection, real-time updates, and a clean, non-intrusive design that enhances your trading workflow.
Ideal for day traders, swing traders, and scalpers, this indicator helps identify alignments between timeframes, spot potential reversals or continuations, and validate entries/exits based on higher-timeframe context. It leverages Pine Script v6 for smooth performance, with optimizations to handle up to 5000 bars back and extensive drawing limits.
**Key Features**
- **Multi-Timeframe Candle Display**: Renders recent candles (configurable from 5 to 100 per timeframe) from selected higher timeframes (e.g., 5m, 15m, 1H, 4H) as compact bars with customizable width, spacing, and padding. Bullish and bearish candles are color-coded for instant recognition.
- **Automatic Timeframe Adaptation**: When enabled, the indicator intelligently selects complementary timeframes based on your chart's resolution (e.g., on a 1m chart, it might show 5m, 15m, and 1H). Manual overrides are available for full control.
- **EMA Overlays**: Plots EMA9, EMA21, and EMA50 on each MTF section using a user-defined source (e.g., OHLC/4, close). EMAs can be dashed for clarity and enabled/disabled per timeframe, helping to gauge momentum and trend strength.
- **Fair Value Gaps (FVGs)**: Detects bullish (+FVG) and bearish (-FVG) gaps with a configurable lookback length (5-50 bars). Gaps are visualized as dotted boxes extending from the candle, highlighting potential support/resistance zones or imbalances.
- **Time Labels and Debugging**: Displays timestamp labels under every fourth candle for chronological context. A debug mode expands spacing and adds detailed labels (e.g., OHLC, volume, EMA values) for testing and verification.
- **Customization Options**: Extensive inputs for colors (bodies, wicks, EMAs, FVGs), label sizes/styles, and layout ensure seamless integration with your chart theme. Supports futures symbols with a time offset adjustment.
- **Performance Optimizations**: Uses arrays for efficient data management, clears drawings on realtime updates or timeframe changes, and limits buffer sizes to prevent overload.
**How to Use**
1. Add the indicator to your chart via TradingView's "Indicators" menu.
2. Configure timeframes: Enable/disable up to four TFs and set the number of candles to display. Use "Auto Timeframe" for smart defaults.
3. Adjust EMAs: Select the source type and toggle per TF to focus on relevant momentum signals (e.g., EMA9 crossovers for short-term trades).
4. Enable FVGs: Activate per TF and tweak the length to suit your market (shorter for volatile assets, longer for trends).
5. Fine-tune appearance: Modify padding, candle width, and colors to avoid clutter. Use debug mode during setup.
6. Interpret: Align your chart's price action with MTF candles—look for confluence in trends, FVGs filling as support/resistance, or EMA alignments for high-probability setups.
**Input Settings**
- **General**: Hour offset for time adjustments (useful for futures).
- **Timeframes**: Enable TFs 1-4, select resolutions (e.g., "5m"), and set candle counts. Auto mode simplifies this.
- **FVG/iFVG**: Toggle per TF, customize colors and detection length.
- **EMA**: Enable per TF, choose source, colors, and dashed style.
- **Candle Appearance**: Bull/bear colors for bodies/wicks, width/spacing/padding, label size/color.
- **Debug**: Expands view for detailed inspection.
**Notes**
- This indicator is non-repainting and updates in realtime, but performance may vary on lower timeframes with many candles—reduce counts if needed.
- FVGs are calculated locally on recent bars for efficiency; historical gaps beyond the buffer aren't shown.
- Compatible with all symbols, but best on volatile markets like forex, crypto, or indices.
- Feedback welcome—updates may include more MA types or advanced FVG filters.
Enhance your edge with multi-timeframe insights—try MTF-Analysis today!

Multi Timeframe BOS & rBOSThis is the same Multi-Timeframe Break of Structure and Market Structure Shift posted by Lenny_Kiruthu. However, the only difference is the naming of Market Structure Shift to rBOS (Break of Structure Reverse). To me, they are all break of structures when previous peaks or valleys are violated. The only difference is in sequence. Once a sequence of BOS reverses, then a new sequence begins. To me, this simplifies the various terminology incorporated by different systems such as ICT or SMT which adds unnecessary complexity.
eT
