Exponential Moving Average + ATR MTF [YSFX]Description:
This indicator is a reupload of a previously published EMA + ATR tool, updated and enhanced after a house rule violation to provide additional features and a cleaner, more versatile experience for traders.
It combines trend analysis and volatility measurement into one intuitive tool, allowing traders to visualize market direction, dynamic support and resistance, and adaptive risk levels—all in a clean, minimal interface.
The indicator calculates a customizable moving average (MA) type—EMA, SMA, WMA, HMA, RMA, DEMA, TEMA, VWMA, LSMA, or KAMA—and surrounds it with ATR-based bands that expand and contract with market volatility. This creates a dynamic envelope around price, helping traders identify potential breakouts, pullbacks, or high-probability entry/exit zones.
Advanced Features:
Multiple MA types: Supports all major moving averages, including advanced options like KAMA, DEMA, and TEMA.
KAMA customization: Adjustable fast and slow lengths for precise tuning.
Dual timeframe support: Optionally use separate timeframes for the MA and ATR, or a global timeframe for both.
Dynamic ATR bands: Automatically adjust to market volatility, useful for setting adaptive stop-loss levels.
Optional fill: Shade the area between upper and lower ATR bands for a clear visual representation of volatility.
Flexible for all markets: Works across any timeframe or asset class.
Who It’s For:
This indicator is ideal for trend-following traders, swing traders, and volatility-focused analysts who want to:
Confirm trend direction while accounting for volatility
Identify high-probability trade entries and exits
Implement dynamic, ATR-based stop-loss strategies
Keep charts clean and uncluttered while still capturing key market information
This reuploaded version ensures compliance with platform rules while offering enhanced flexibility and clarity for modern trading workflows.
Multitimeframe

Asset vs Total Market Cap & Relative Strength Purpose
This indicator allows traders to compare a selected asset to the major market benchmarks:
BTC – primary crypto market leader
ETH – secondary crypto market leader
USDT.D – shows market risk-on vs risk-off sentiment
TOTAL – total crypto market capitalization, useful for overall market trends
It also provides relative strength calculations:
Rel. Strength = Asset % change - USDT.D % change
Rel. Strength vs Total = Asset % change - Total % change
This allows you to see if your asset is outperforming or underperforming broader benchmarks.
The table covers multiple timeframes, making it easy to scan both short-term and longer-term trends:
Row Timeframe
0 Current
1 15m
2 1H
3 4H
4 1D
Selected Asset / BTC / ETH:
Green for positive % change
Red for negative % change
Gradient intensity proportional to magnitude (maxAbsChange input)
USDT.D:
Orange if rising (risk-off)
Teal if falling (risk-on)
Total Market Cap / Rel. Strength:
Gradient reflects asset performance relative to total market, independent of USDT.D.
Positives
Compact dashboard: Everything is in one table for quick scanning.
Multi-timeframe comparison: Traders can instantly see short-term vs long-term strength.
Relative performance visualization: Gradients immediately highlight outperformers and underperformers.
Benchmark comparisons: Asset vs BTC, ETH, USDT.D, and Total Market Cap.
Independent Rel. Strength: Highlights whether the asset is outperforming even if the total market moves.
Customizable gradient sensitivity: maxAbsChange and maxRelChange allow tuning how “strong” the colors appear.
Chart plotting: Rel. Strength vs total market is plotted for further visual reference.
How to Use
Green table cells → strong positive movement
Red table cells → negative movement
Rel. Strength > 0 → asset outperforming
Rel. Strength < 0 → asset underperforming
Use table to compare relative performance vs BTC, ETH, and total market for informed trading decisions.

VPG – MTF PrevClose Dashboard (Horizontal 6TF, Bottom Right, VPG – MTF PrevClose Dashboard is a lightweight, real-time visual indicator that displays the current price position across six key timeframes — Weekly (W), Daily (D), 4H, 1H, 30m, and 15m.
It compares the current market price to the previous candle close and shows whether the price is:
🟢 RALLY → higher than the previous close
🔵 BASE → roughly equal (sideways / consolidation)
🔴 DROP → lower than the previous close
Designed as a clean, horizontal dashboard fixed at the bottom-right corner of your chart, it provides instant multi-timeframe insight without cluttering your workspace.
⚙️ Key Features
🔹 Real-time monitoring of six key timeframes (W, D, 4H, 1H, 30m, 15m)
🔹 Clear and intuitive color scheme: Green = RALLY, Blue = BASE, Red = DROP
🔹 Fixed bottom-right placement for consistent visibility
🔹 Horizontal layout for compact, at-a-glance analysis
🔹 Adjustable tolerance to define how “equal” prices are classified as BASE
🔹 No alerts or labels — clean, fast, and resource-light
📊 Best For
Multi-timeframe traders who need quick directional context
Scalpers, intraday, and swing traders doing top-down analysis
Dashboard lovers who want a minimalist, data-driven overview
Confirming short-term price moves against higher-timeframe trends
💡 How to Use
Add VPG – MTF PrevClose Dashboard to any chart (Forex, Crypto, Stocks, Gold, Indices, etc.).
Adjust the tolerance parameter if you want a wider or stricter “BASE” range.
Watch the table in the bottom-right corner — it updates live with every price move.
🧠 About the Author
Nizar M — Developer of VPG indicators focused on clarity, momentum visualization, and fast market interpretation for real-time decision-making.

Market Profile Dominance Analyzer# Market Profile Dominance Analyzer
## 📊 OVERVIEW
**Market Profile Dominance Analyzer** is an advanced multi-factor indicator that combines Market Profile methodology with composite dominance scoring to identify buyer and seller strength across higher timeframes. Unlike traditional volume profile indicators that only show volume distribution, or simple buyer/seller indicators that only compare candle colors, this script integrates six distinct analytical components into a unified dominance measurement system.
This indicator helps traders understand **WHO controls the market** by analyzing price position relative to Market Profile key levels (POC, Value Area) combined with volume distribution, momentum, and trend characteristics.
## 🎯 WHAT MAKES THIS ORIGINAL
### **Hybrid Analytical Approach**
This indicator uniquely combines two separate methodologies that are typically analyzed independently:
1. **Market Profile Analysis** - Calculates Point of Control (POC) and Value Area (VA) using volume distribution across price channels on higher timeframes
2. **Multi-Factor Dominance Scoring** - Weights six independent factors to produce a composite dominance index
### **Six-Factor Composite Analysis**
The dominance score integrates:
- Price position relative to POC (equilibrium assessment)
- Price position relative to Value Area boundaries (acceptance/rejection zones)
- Volume imbalance within Value Area (institutional bias detection)
- Price momentum (directional strength)
- Volume trend comparison (participation analysis)
- Normalized Value Area position (precise location within fair value zone)
### **Adaptive Higher Timeframe Integration**
The script features an intelligent auto-selection system that automatically chooses appropriate higher timeframes based on the current chart period, ensuring optimal Market Profile structure regardless of the trading timeframe being analyzed.
## 💡 HOW IT WORKS
### **Market Profile Construction**
The indicator builds a Market Profile structure on a higher timeframe by:
1. **Session Identification** - Detects new higher timeframe sessions using `request.security()` to ensure accurate period boundaries
2. **Data Accumulation** - Stores high, low, and volume data for all bars within the current higher timeframe session
3. **Channel Distribution** - Divides the session's price range into configurable channels (default: 20 rows)
4. **Volume Mapping** - Distributes each bar's volume proportionally across all price channels it touched
### **Key Level Calculation**
**Point of Control (POC)**
- Identifies the price channel with the highest accumulated volume
- Represents the price level where the most trading activity occurred
- Serves as a magnetic level where price often returns
**Value Area (VA)**
- Starts at POC and expands both upward and downward
- Includes channels until reaching the specified percentage of total volume (default: 70%)
- Expansion algorithm compares adjacent volumes and prioritizes the direction with higher activity
- Defines the "fair value" zone where most market participants agreed to trade
### **Dominance Score Formula**
```
Dominance Score = (price_vs_poc × 10) +
(price_vs_va × 5) +
(volume_imbalance × 0.5) +
(price_momentum × 100) +
(volume_trend × 5) +
(va_position × 15)
```
**Component Breakdown:**
- **price_vs_poc**: +1 if above POC, -1 if below (shows which side of equilibrium)
- **price_vs_va**: +2 if above VAH, -2 if below VAL, 0 if inside VA
- **volume_imbalance**: Percentage difference between upper and lower VA volumes
- **price_momentum**: 5-period SMA of price change (directional acceleration)
- **volume_trend**: Compares 5-period vs 20-period volume averages
- **va_position**: Normalized position within Value Area (-1 to +1)
The composite score is then smoothed using EMA with configurable sensitivity to reduce noise while maintaining responsiveness.
### **Market State Determination**
- **BUYERS Dominant**: Smooth dominance > +10 (bullish control)
- **SELLERS Dominant**: Smooth dominance < -10 (bearish control)
- **NEUTRAL**: Between -10 and +10 (balanced market)
## 📈 HOW TO USE THIS INDICATOR
### **Trend Identification**
- **Green background** indicates buyers are in control - look for long opportunities
- **Red background** indicates sellers are in control - look for short opportunities
- **Gray background** indicates neutral market - consider range-bound strategies
### **Signal Interpretation**
**Buy Signals** (green triangle) appear when:
- Dominance crosses above -10 from oversold conditions
- Previous state was not already bullish
- Suggests shift from seller to buyer control
**Sell Signals** (red triangle) appear when:
- Dominance crosses below +10 from overbought conditions
- Previous state was not already bearish
- Suggests shift from buyer to seller control
### **Value Area Context**
Monitor the information table (top-right) to understand market structure:
- **Price vs POC**: Shows if trading above/below equilibrium
- **Volume Imbalance**: Positive values favor buyers, negative favors sellers
- **Market State**: Current dominant force (BUYERS/SELLERS/NEUTRAL)
### **Multi-Timeframe Strategy**
The auto-timeframe feature analyzes higher timeframe structure:
- On 1-minute charts → analyzes 2-hour structure
- On 5-minute charts → analyzes Daily structure
- On 15-minute charts → analyzes Weekly structure
- On Daily charts → analyzes Yearly structure
This higher timeframe context helps avoid counter-trend trades against the dominant force.
### **Confluence Trading**
Strongest signals occur when multiple factors align:
1. Price above VAH + positive volume imbalance + buyers dominant = Strong bullish setup
2. Price below VAL + negative volume imbalance + sellers dominant = Strong bearish setup
3. Price at POC + neutral state = Potential breakout/breakdown pivot
## ⚙️ INPUT PARAMETERS
- **Higher Time Frame**: Select specific HTF or use 'Auto' for intelligent selection
- **Value Area %**: Percentage of volume contained in VA (default: 70%)
- **Show Buy/Sell Signals**: Toggle signal triangles visibility
- **Show Dominance Histogram**: Toggle histogram display
- **Signal Sensitivity**: EMA period for dominance smoothing (1-20, default: 5)
- **Number of Channels**: Market Profile resolution (10-50, default: 20)
- **Color Settings**: Customize buyer, seller, and neutral colors
## 🎨 VISUAL ELEMENTS
- **Histogram**: Shows smoothed dominance score (green = buyers, red = sellers)
- **Zero Line**: Neutral equilibrium reference
- **Overbought/Oversold Lines**: ±50 levels marking extreme dominance
- **Background Color**: Highlights current market state
- **Information Table**: Displays key metrics (state, dominance, POC relationship, volume imbalance, timeframe, bars in session, total volume)
- **Signal Shapes**: Triangle markers for buy/sell signals
## 🔔 ALERTS
The indicator includes three alert conditions:
1. **Buyers Dominate** - Fires on buy signal crossovers
2. **Sellers Dominate** - Fires on sell signal crossovers
3. **Dominance Shift** - Fires when dominance crosses zero line
## 📊 BEST PRACTICES
### **Timeframe Selection**
- **Scalping (1-5min)**: Focus on 2H-4H dominance shifts
- **Day Trading (15-60min)**: Monitor Daily and Weekly structure
- **Swing Trading (4H-Daily)**: Track Weekly and Monthly dominance
### **Confirmation Strategies**
1. **Trend Following**: Enter in direction of dominance above/below ±20
2. **Reversal Trading**: Fade extreme readings beyond ±50 when diverging with price
3. **Breakout Trading**: Look for dominance expansion beyond ±30 with increasing volume
### **Risk Management**
- Avoid trading during NEUTRAL states (dominance between -10 and +10)
- Use POC levels as logical stop-loss placement
- Consider VAH/VAL as profit targets for mean reversion
## ⚠️ LIMITATIONS & WARNINGS
**Data Requirements**
- Requires sufficient historical data on current chart (minimum 100 bars recommended)
- Lower timeframes may show fewer bars per HTF session initially
- More accurate results after several complete HTF sessions have formed
**Not a Standalone System**
- This indicator analyzes market structure and participant control
- Should be combined with price action, support/resistance, and risk management
- Does not guarantee profitable trades - past dominance does not predict future results
**Repainting Characteristics**
- Higher timeframe levels (POC, VAH, VAL) update as new bars form within the session
- Dominance score recalculates with each new bar
- Historical signals remain fixed, but current session data is developing
**Volume Limitations**
- Uses exchange-provided volume data which varies by instrument type
- Forex and some CFDs use tick volume (not actual transaction volume)
- Most accurate on instruments with reliable volume data (stocks, futures, crypto)
## 🔍 TECHNICAL NOTES
**Performance Optimization**
- Uses `max_bars_back=5000` for extended historical analysis
- Efficient array management prevents memory issues
- Automatic cleanup of session data on new period
**Calculation Method**
- Market Profile uses actual volume distribution, not TPO (Time Price Opportunity)
- Value Area expansion follows traditional Market Profile auction theory
- All calculations occur on the chart's current symbol and timeframe
## 📚 EDUCATIONAL VALUE
This indicator helps traders understand:
- How institutional traders use Market Profile to identify fair value
- The relationship between price, volume, and market acceptance
- Multi-factor analysis techniques for assessing market conditions
- The importance of higher timeframe structure in trade planning
## 🎓 RECOMMENDED READING
To better understand the concepts behind this indicator:
- "Mind Over Markets" by James Dalton (Market Profile foundations)
- "Markets in Profile" by James Dalton (Value Area analysis)
- Volume Profile analysis in institutional trading
## 💬 USAGE TERMS
This indicator is provided as an educational and analytical tool. It does not constitute financial advice, investment recommendations, or trading signals. Users are responsible for their own trading decisions and should conduct their own research and due diligence.
Trading involves substantial risk of loss. Past performance does not guarantee future results. Always use proper risk management and never risk more than you can afford to lose.

Hourly High Low Short LinesDraws short horizontal lines at the previous hour’s high and low, aligned perfectly with the candle’s top and bottom.
It’s concise, clear, and fits well for the public script description box.

Breakout ScannerThis is a Breakout Scanner that shows you the immediate trend across 4 higher timeframes for up to 10 different tickers. It calculates a score from 1 to 3 for bullish and -1 to -3 for bearish based on where price is currently at compared to the previous higher timeframe’s candle levels.
When price is breaking out of the previous higher timeframe candle’s range, then it will have a score of 3 for bullish breakout or -3 for bearish breakout. When price is above the high or below the low of multiple different higher timeframe candles, you can expect price to continue the breakout and move to a new area of price range.
The brighter red or green the color is, the stronger the trend is on that timeframe. When it shows a bright green or red box on the far right side of a ticker, it is notifying you that the ticker is bullish or bearish on all timeframes and trending strongly, so switch over to that chart and look to trade in the direction of that trend.
The tickers, colors and time frames can be customized to suit your preference and you can also turn off as many tickers or time frames as you’d like if you want less tickers or time frames to show up on the indicator. It also includes alerts for when all timeframes are bullish or all timeframes are bearish for one ticker.
Make sure to keep each timeframe set to a timeframe that is higher than your chart timeframe.
Bullish Scoring & Colors
If the current candle close is above the midline of the higher time frame candle, it is given a score of 1 and a dark green background. If the current candle close is above the higher timeframe candle body, then it is given a score of 2 and a medium green background. If the current candle close is above the high of the higher time frame candle, it is given a score of 3 and a bright green background.
The higher the score the stronger the bullish trend and the brighter green the color will be.
Bearish Scoring & Colors
If the current candle close is below the midline of the higher timeframe candle, it is given a score of -1 and a dark red background. If the current candle close is below the higher timeframe candle body, then it is given a score of -2 and a medium red background. If the current candle close is below the low of the higher timeframe candle, it is given a score of -3 and a bright red background.
The lower the score, the stronger the bearish trend and the brighter red the color will be.
Total Score Display
On the right side of the indicator table, there is a column that displays the total score by adding all the scores together so you can easily tell the overall strength of the trend across all timeframes. Wait for the trend score to be at least 75% of the possible score to trade so you can ensure you are only trading very strong trends and increase your probability of winning your trade. The total score will update according to how many time frames you have enabled in the settings. You can also turn on or off the total score count if you prefer. The default setting is off.
All Timeframe Trends Agree
When all of the timeframes that you have turned on are in the same direction at the same time, a green or red box will appear on the far right side of the scanner. This is a visual cue that lets you know the strongest trending markets without having to read any of the numbers. Make sure to check out the charts for the markets that have a green or red box on the far right side and look for potential trend trading opportunities.
Alerts
You can set alerts for when all time frames for a certain ticker are bullish or bearish. If you have some time frames turned off at the time of creating your alerts, then it will only require all time frames that are on to be all bullish or bearish to generate an alert. Make sure to set your alerts to once per bar close to ensure you don’t get premature alerts that aren’t yet valid.
Best Way To Use The Scanner
For best results, make sure you wait for the trend to show all bullish or all bearish at the same time and then look to trade in the direction of the strong trend. If you can be patient enough to do that, you will increase the probability of winning your trade because you are trading with the direction of the overall higher timeframe trend when the market is trending strongly and making new highs or lows.
When one of the markets in the scanner shows all timeframes trending, go to that chart and see how price action is reacting to the previous higher timeframe candle levels. You can see those levels easily by adding our Higher Timeframe Candle Levels indicator to your chart and using the same timeframes as your Breakout Scanner is using.
If price is holding the higher timeframe candle levels well, then look to place trades in the direction of the trend that the Breakout Scanner is showing.
Other Indicators To Pair This With
Use this in combination with our Higher Timeframe Candle Levels indicator so you can see all of these levels being used to calculate the trend strength scores and watch how price reacts to those levels. You should also use our Trend Strength Indicator to easily read the historical trends of price compared to the higher timeframes and use those trends to guide you on when to trade and which direction to trade.
Trend Strength Indicator, Higher Timeframe Candle Levels and the Breakout Scanner all use the same levels to calculate the trend scores so they are designed to work all together to help you quickly be able to read a chart and find what direction to trade in.

Trend Strength IndicatorThis is a Trend Strength Indicator that shows you the immediate trend and historical trend of price for up to 7 higher timeframes.
It shows the strength of each timeframe by showing a red or green dot based on where price is at compared to the previous higher timeframe candle. The brighter red or green the dot is, the stronger the trend is compared to that higher timeframe candle.
The colors and timeframes can be customized to suit your preference and you can also turn off as many timeframes as you’d like if you want less time frames to show up on the indicator.
It also includes alerts for when all timeframes are bullish or all timeframes are bearish.
Keep these timeframes set to higher time frames than your chart so you can trade in the direction of the overall higher timeframe trend.
Bullish Scoring & Colors
If the current candle close is above the midline of the higher time frame candle, it is given a score of 1 and a dark green dot. If the current candle close is above the higher timeframe candle body, then it is given a score of 2 and a medium green dot. If the current candle close is above the high of the higher time frame candle, it is given a score of 3 and a bright green dot.
The higher the score the stronger the bullish trend and the brighter green the dot will be.
Bearish Scoring & Colors
If the current candle close is below the midline of the higher timeframe candle, it is given a score of -1 and a dark red dot. If the current candle close is below the higher timeframe candle body, then it is given a score of -2 and a medium red dot. If the current candle close is below the low of the higher timeframe candle, it is given a score of -3 and a bright red dot.
The lower the score, the stronger the bearish trend and the brighter red the dot will be.
Trend Scoring Modes
We gave you the option to set the trend scoring mode to either score based on price above or below the midline for quick and easy trend identification, or using the midline, candle body and highs and lows to give you a more detailed view of the trend strength. You can switch between these modes by selecting your preferred mode in the settings panel. The default is Open, High, Low, Close + Midline.
Sending Trend Direction To External Indicators
We coded in the ability to use the trend strength score as a signal that you can use to filter other indicators. This feature is great for notifying signal generating indicators what direction the market is trending in so that the signal generating indicator only gives signals in the direction of the trend.
This feature works by providing a data output of 1, 0 or -1. 1 means the trend is bullish, 0 means the trend is neutral and -1 means the trend is bearish.
This score is calculated by using the score of each timeframe that is turned on and checking if all timeframes are in the same direction or not. So if 3 timeframes are turned on and they are all bullish, the indicator will provide a data output of 1. This tells your external indicators that the trend is bullish.
This data output can be found in the data window and is labeled Trend Direction To Send To External Indicators.
At the bottom of the settings panel, there is a setting called Trend Score Threshold For External Indicators. This setting is the score threshold that all timeframes will need to meet to allow a trend strength signal to go through. So if set to 1, then all timeframes must be scored 1 or higher for bullish or -1 or lower for bearish. If set to 2, then all timeframes must be 2 or higher for bullish or -2 or lower for bearish. If set to 3, then all timeframes must be 3 for bullish or -3 for bearish. If all timeframes have met this threshold, then a bullish or bearish signal can be sent to your external indicator as a trend filter.
Labels
There are labels to the right of each row of dots, telling you which timeframe is which so you can easily identify what timeframe each row is showing the trend for.
Alerts
You can set alerts for when all timeframes are bullish or when all timeframes are bearish. If you have some time frames turned off at the time of creating your alerts, then it will only require all timeframes that are on to be all bullish or bearish to generate an alert. Make sure to set your alerts to once per bar close to ensure you don’t get premature alerts that aren’t yet valid.
Backtesting
This indicator helps you quickly identify and backtest the trend direction, how strong that trend is on multiple timeframes and helps you spot reversals and trend continuations. Make sure you look back at a lot of historical data to see how price moves when trend changes take place and how well price continues in each direction compared to the overall trend. This will help you gain confidence in reading the indicator and using it to your advantage when trading.
Best Way To Use The Indicator
This indicator is designed to help you quickly identify the trend on various different timeframes. The brighter the green dots are, the stronger the bullish trend is. The brighter the red dots are, the stronger the bearish trend is.
Trade in the direction of the trend. If the colors are mixed green and red, then price is likely to chop back and forth, so only trade the extremes of the ranges when that happens.
When most of the lower timeframe dots are the same color, that means it is a strong trend and you should place trades in the direction of the trend to be safe. The lower timeframes will start trending before the higher timeframes, so take notice of the lower timeframe colors starting to agree with each other and then take advantage of the trend that is forming.
You can also spot reversals with this indicator by watching for the lower timeframes to start changing color after a strong trend in one direction. The lower timeframes will start to change color one by one, indicating that the trend is actually changing direction.
For best results, make sure you wait for the trend to show all bullish or all bearish at the same time before you place any trades. If you can be patient enough to do that, you will increase the probability of winning your trade because you are trading with the direction of the overall higher timeframe trend which is typically an easy way to win more trades. Of course wait for pullbacks during the trend so you can keep a tight stop loss after entering your trade.
If you are scalping, you can turn off the higher timeframes and just use the 1 hour through 1 day. This won’t be as reliable as using all timeframes and waiting for them to align, but it is suitable for scalping quick intraday movements.
Other Indicators To Pair This With
Use this in combination with our Higher Timeframe Candle Levels indicator so you can see all of these levels being used to calculate the trend strength scores and watch how price reacts to those levels. You should also use our Breakout Scanner to find other markets with strong trends so you always know which market is trending the strongest and can trade those. Trend Strength Indicator, Higher Timeframe Candle Levels and the Breakout Scanner all use the same levels and calculate the trend scores the same way so they are designed to work all together to help you quickly be able to read a chart and find what direction to trade in.
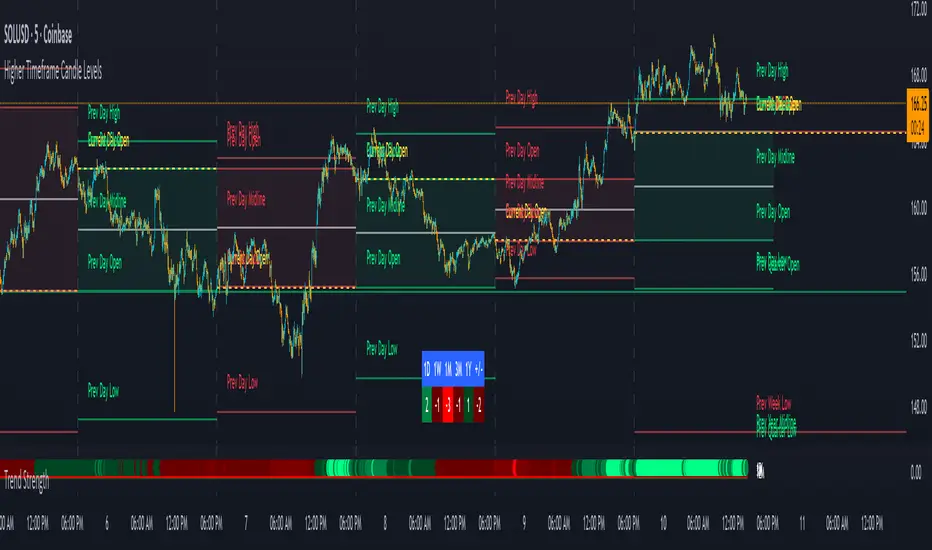
Higher Timeframe Candle LevelsThis is an indicator that shows higher time frame candle levels from various preset timeframes. These higher time frame candles act as support and resistance levels, so look for reversals and continuations off of these levels. When price exceeds the high or low of these levels, you should look for breakouts in the same direction and trade with the trend.
It includes candle levels for the following timeframes: 1 hour, 4 hour, 1 day, 1 week, 1 month, 1 quarter and 1 year. The indicator also includes a trend candle coloring feature, trend strength scoring table, stop loss feature, line identification labels, alerts for trend changes, alerts for level touches and full customization of all options.
How To Trade With This Indicator
These higher timeframe candle levels will act as support and resistance levels, so look for price to react at any of the levels you have turned on and then look for potential bounce or reversal signs at those levels so you can trade those direction changes. Price outside of the higher timeframe candle highs and low typically signals a breakout as well, so look for price to continue after passing the highs or lows.
You can use the direction of the higher timeframe candles as your trend as well. Try to only trade in the direction of the trend of the higher timeframes to increase the likelihood of your trade going in your favor.
The highs and lows of daily and up levels are excellent levels to find quick reversal off of. Watch for price action to struggle to break through these levels and then trade the reversal. If price breaks through these levels easily, watch for price to retest the level and then continue beyond that level. Trade the retest in the direction of the trend.
The open, close and midline levels are excellent for trading bounces. Watch for price to form wicks beyond these levels and close on the other side and use that as a sign that price may bounce there. Use that with price action to confirm your trade and then take trades off of those level bounces.
Use the alerts for daily and up timeframe level touches across all of your favorite markets so that way you are always notified in real time when price is at a level that could provide a potential trading opportunity.
Higher Time Frame Candle Levels
The indicator shows the current candle open, previous open, previous high, previous low, previous close and previous candle body midline levels of each candle for each time frame. This helps you easily see what is going on with the higher time frame candles and read the price action from your lower time frame charts.
Each candle level will paint red if it was a down candle or green if it was an up candle, except the midlines and current candle open lines, those are a different color for easy differentiation. The line colors can be customized to your preferences in the settings and you can also toggle the candle body coloring on or off, as well as change the color of the candle body background.
Each timeframe can be adjusted to your preferences, allowing you to turn all of the levels on or off. You can also adjust how many previous candles show up on your chart so you can backtest it and see for yourself how accurate these levels are.
When adjusting the number of candles, you will get a notification if you have more than 500 lines turned on, so just turn down the number of levels for whatever timeframe you can’t see on your chart to lower that number below 500. The notification will go away once you are under 500 lines again. Each candle has 6 lines if all levels are turned on for that timeframe: open, current candle open, close, high, low and midline. The default settings keep you under 500 lines total, so just be aware of that limitation when adjusting those numbers and adjust the number of levels down on the timeframes that are not useful on the current chart bar.
You can also extend the levels right on any time frame from the daily levels and above. This is useful when price is breaking above or below all levels and you need to know if there are any other previous candle levels in the way as price moves away from the most recent higher time frame candles.
To understand the intraday trend of each higher time frame, look to see where price is at according to each higher time frame candle. If the price is above the midline of the candle, it is bullish. If the price is above the candle body it is more bullish. If the price is above the high, it is very bullish. If the price is below the midline of the candle, it is bearish. If the price is below the candle body it is more bearish. If the price is below the low, it is very bearish. Make sure you backtest this yourself and go through lots of historical data to get a feel for how price reacts to these levels and establishes the trend. Then use that trend information to your advantage and trade in the direction of the trend.
Since users are limited to a certain amount of historical bars based on which Tradingview plan you have, some longer timeframe levels won’t show up because the start of that candle is too far back in history. You will get a notification at the top of that chart if that happens. It will tell you to lower the display timeframe for that timeframe until that notification goes away, which means it was able to plot the most recent candle for that timeframe on your chart.
Trend Candle Coloring
The indicator includes a feature that paints the candles based on whether the current time frame candles are above or below the most recent midline, candle body or high & low of a higher time frame candle of your choice. This helps you see the overall trend of the higher timeframe so you can trade with the trend.
The candle coloring will have an up color, down color and neutral color which can all be customized to suit your preferences. If the current time frame candle close is above the setting you choose, it will show the up color. If the current time frame candle close is below the setting you choose, it will show the down color. If the current time frame candle close is equal to or in the middle of the setting you chose, it will show the neutral color.
So, for example if you set it to candle body, then it will show the up color if the current candle is above the top of the candle body, down color if it is below the bottom of the candle body and neutral color if it is inside the candle body. This helps you wait for price action to move beyond the inside of the previous higher time frame candle before taking a position when price is breaking out of that previous candle so you can trade the momentum of that move. The candle coloring is fully customizable, but make sure to turn off your candle coloring on other indicators and your chart settings for it to show up properly.
Trend Strength Scoring Table
The trend strength scoring table displays a table at the bottom of the screen(table position is customizable), showing a score for the trend strength of each higher time frame. If the current candle close is above the midline, its strength is 1. If the current candle close is above the midline, but below the top of the candle body, its strength is 2. If the current candle close is above the high, its strength is 3. The same goes for below the midline, bottom of the candle body and below the low, but the scores would be negative 1, 2 or 3 instead.
This trend strength table allows you to quickly identify the trend on each higher time frame so you can wait until the trend is the same across all time frames before placing a trade in the direction of the trend. It also shows a total score on the far right side that adds all of the current trend scores together to give you a total strength score. Try to only trade when that number is very high compared to how many time frames you have turned on. Each time frame can have up to a maximum score of 3 if bullish and -3 if bearish. Each time frame in the table can be turned on or off to suit your preferences.
Stop Loss Feature
There is also a stop loss feature that you can set to whatever time frame you choose and whatever direction you chose, such as long or short. It will follow the most recent higher time frame candle’s trend using one of the following settings: candle body, high & low or midline. Once a new higher time frame candle is created, the stop loss will update to the most recent candle’s levels so you can use these levels as a trailing stop loss to maximize your wins.
If you have it set to use the candle body and it is set to long mode, then the stop loss will use the previous higher time frame candle’s lowest candle body level. So if it was an up candle previously, it will use the open. If it was a down candle previously, it will use the close. The opposite is true for short positions.
The stop loss will start working once you turn it on in the settings and will update automatically as new higher time frame candles are formed. It also shows a line of where the stop loss was previously since it was turned on.
I recommend using the high & low setting, especially when the market starts trending.
Candle Level Identification Labels
There are labels for each level starting with the 4 hour time frame and above so you can easily tell what level of each candle you are looking at, even if the rest of the candle is not showing within the chart pane. You can customize the label coloring for up candles and down candles and midlines as well as adjust the number of bars that the labels are offset from the current bar so they are visible on your chart without overlapping the current price action or other indicator labels. Labels for each time frame can be turned on or off as needed. The 1 hour labels were not included because it clogs up the chart, but it has labels for all time frames from the 4 hour candles and up.
Alerts
The indicator includes alerts for when the trend has changed to the opposite direction. The trend change alert is based on your settings for the Trend Candle Coloring. Whatever settings you have the trend candle coloring set to, will be used to set up your alerts. The Trend Candle Coloring setting must be turned on as well when creating your alerts for it to work properly. Make sure to backtest your settings and then create your alerts.
It also has alerts for when price is touching an open or close, high or low, midline or any of those levels for each timeframe. This allows you to be notified when price touches one of these levels so you can check the chart and look for potential trade opportunities if price wants to bounce off of that level. To make it easy for you to get alerts on many different tickers, just use the alert for any level touch on whatever timeframes you want.
Other Indicators To Pair This With
Use this in combination with our Trend Strength Indicator so you can visually see the historic and current trend for all of these levels. You should also use our Breakout Scanner to find other markets with strong trends so you always know which market is trending the strongest and can trade those. Trend Strength Indicator, Higher Timeframe Candle Levels and the Breakout Scanner all use the same levels and calculate the trend scores the same way so they are designed to work together to help you quickly be able to read a chart and find what direction to trade in.

Dual EMA Status Table (15m & 30m)It checks whether the 9 EMA is above or below the 21 EMA on:
the 15-minute chart, and
the 30-minute chart,
and then displays their alignment in a table:
Timeframe 9 vs 21 Status
15 min 9 > 21 Bullish
30 min 9 > 21 Bullish
CONFIRM ✅ Bullish
✅ “Bullish Confirm” → 9 EMA > 21 EMA on both → uptrend bias
❌ “Bearish Confirm” → 9 EMA < 21 EMA on both → downtrend bias
⚠️ “Mixed” → 15 m and 30 m disagree → stay neutral or wait
💡 How to Use It as a Trading Signal
You can treat it as a buy/sell framework with confirmation rules:
🔹 Buy (Long) bias
Table shows ✅ Bullish confirmation
9 EMA > 21 EMA on both timeframes
Ideally, price pulls back near one of the EMAs and then bounces
You could enter after a bullish candle close above the EMAs
📍 Example entry rule:
Enter long when “✅ Bullish” appears and price closes above both EMAs on the 15 min chart.
Stop-loss below the 21 EMA or recent swing low.
🔹 Sell (Short) bias
Table shows ❌ Bearish confirmation
9 EMA < 21 EMA on both timeframes
Price retraces upward and rejects near EMAs
📍 Example entry rule:
Enter short when “❌ Bearish” appears and price closes below both EMAs on the 15 min chart.
Stop-loss above 21 EMA or recent swing high.

RSI Multi-Timeframe HeatmapThe RSI Multi-Timeframe Heatmap displays the Relative Strength Index (RSI) across multiple timeframes in a single, easy-to-read visual grid.
It allows traders to instantly assess RSI conditions (overbought, oversold, neutral) across short-, medium-, and long-term perspectives — all at once.
Each column represents a different timeframe, and each cell is color-coded based on the RSI value.
The active cell in each column shows the current RSI for that timeframe, with both the numerical value and a background color that corresponds to RSI intensity.
Features
Displays RSI values for multiple timeframes simultaneously.
Includes the following timeframes:
5m, 15m, 30m, 45m, 1h, 2h, 3h, 4h, 6h, 8h, 12h, 23h, 1d, 1w, and the current chart timeframe.
Color-coded RSI heatmap with intuitive gradient from cold (oversold) to hot (overbought).
Uses closing prices for RSI calculation.
Table layout updates in real-time on every bar.
Highly visual and ideal for multi-timeframe momentum analysis.
Each timeframe has 3 values - current, 7 bars ago and 14 bars ago.

Rage of UltronRage of Ultron - Multi-Timeframe Smart Money Trading System
Advanced Confluence-Based Trading Indicator
Rage of Ultron is a comprehensive multi-timeframe trading system that combines Smart Money Concepts (SMC) with macro market context, RSI divergences, liquidity sweeps, and volume analysis to identify high-probability setups across all markets.
Key Features
Multi-Timeframe Alignment
* Weekly Bias - Directional trend context
* Daily Structure - Order Blocks and Fair Value Gaps
* 4H Confirmation - Entry timing and execution
* Real-time MTF alignment scoring (🟢 Bull Aligned / 🔴 Bear Aligned / 🟡 Mixed)
Smart Money Concepts
* Order Blocks (OB) - Institutional entry zones with visual clarity
* Fair Value Gaps (FVG) - Price imbalances and retracement magnets
* Change of Character (CHoCH) - Market structure breaks (▲▼)
* Liquidity Sweeps - Stop hunt detection before reversals (💧)
Technical Analysis
* RSI Divergences - Regular and hidden divergences with zones (◆)
* RSI Swing Failure Patterns - Grade-A reversal setups (★)
* Automatic Fibonacci - Dynamic retracements and extensions
* Volume Impulse Detection - Weighted confirmation signals
Macro Market Radar
* DXY - Dollar strength assessment
* BTC Dominance - Crypto market risk gauge
* USDT Dominance - Stablecoin flow analysis
* Combined risk environment scoring
Confluence Scoring System (0-7)
Quantified setup quality with three alert tiers:
* Tier 1 (Score 6-7): Full confluence + sweep + volume + MTF alignment
* Tier 2 (Score 5): High confluence + volume or sweep
* Tier 3 (Score 4): Standard confluence setups
"Rage" Volume State
* 🟢 RAGE PULSE - Explosive volume spike (score 6+ trigger)
* ⚡ Active - Strong volume with good confluence
* 🟡 Stable - Moderate volume conditions
* 🔴 Dormant - Low volume, wait for confirmation
Visual Design
* Clean Zone Rendering - Persistent OB/FVG boxes with limited extension
* Signal Bar Highlighting - Colored fills and contrasting borders for instant recognition
* Dynamic Symbol Placement - ATR-based offset prevents overlap
* Comprehensive Panel - Real-time macro + trade metrics in one view
* Toggleable Legend - Learn signals, hide once familiar
How to Use
1. Set Your Timeframes - Default 1W/1D/4H works for swing trading
2. Monitor Macro Environment - Check risk-on/off context
3. Wait for Confluence ≥4 - Let multiple signals align
4. Enter on Tier 1/2 Alerts - Best probability setups
5. Use Fib Extensions for Targets - Systematic profit taking
Customizable Settings
* Multi-timeframe periods
* RSI length and divergence sensitivity
* Liquidity sweep parameters
* Fibonacci swing lookback
* Volume thresholds
* Shape offset multiplier
* Visual toggles (Fibs, extensions, legend)
Built-in Alert System
Three-tier alert structure lets you filter by setup quality. Set alerts for Tier 1 only for highest conviction trades, or include Tier 2 for more opportunities.
Best Practices
* Use on clean timeframes - 1H+ for less noise
* Combine with support/resistance - Zones near key levels = highest probability
* Respect the macro - Don't fight extreme risk-off environments
* Wait for the full stack - Best trades have 4+ aligned signals
* Practice on demo first - Learn signal behavior in your market
Works On
* Cryptocurrency (spot & futures)
* Forex pairs
* Stock indices
* Individual stocks
* Commodities
Note: This indicator identifies potential setups but does not guarantee profits. Always use proper risk management, position sizing, and stops. Past performance does not predict future results.
Created by cdotgnz | For educational purposes

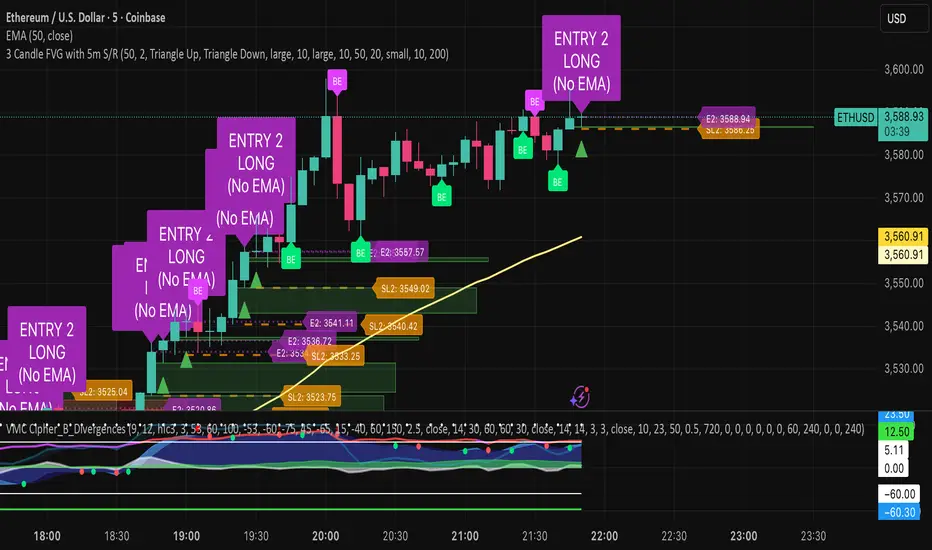
HTF MACD Dual Zero Cross + First EMA PullbackThis script aims to get the trader on the right side of the momentum and get better entries by only alerting when price pulls back to the trader's specified EMA.
This script isnt meant to catch tops or bottoms but to trade with the momentum once it starts.
This script will alert whe nthe MACD and signal line both cross the zero line, after that the script waits for price to make a pullback and then alet either a sell or buy. Ive found this works best when you trade with the trend on a higher timeframe.
You can use whatever MACD settings you prefer and really customize this to the asset youre trading.
You can also change whether you get an alert based on a wick touch of the EMA or a candle close.

TrendMaster V2TrendMaster V2 is a comprehensive Pine Script indicator designed for TradingView. It combines multiple technical indicators and an advanced scoring logic to provide actionable trading signals. The script is highly customizable, allowing users to adjust trading modes, color themes, and signal filters according to their preferences and risk tolerance.
Key Features
Composite Scoring System:
The script calculates a composite score based on trend, momentum, pattern recognition, volume, volatility, divergence, Pearson correlation, and the CCI index. This score helps identify the best buy or sell opportunities.
Customizable Parameters:
Users can choose between “Aggressive,” “Balanced,” or “Conservative” trading modes, adjust indicator periods, and customize the color scheme of all visual elements.
Confluence Analysis:
The script evaluates the number of matching bullish or bearish signals, providing a confluence summary for higher-confidence trades.
Visual Signals:
Clear visual cues (triangles, circles, crosses) are displayed on the chart for strong buy/sell signals, confluences, and divergences.
Information Panels:
Two panels display real-time data such as score, RSI, volume, volatility, Pearson, CCI, trend, signal, and mode, along with the confluence status for quick reference.
Alert Conditions:
The script supports alerts for strong buy/sell signals, confluences, and divergences.
How It Works
Main Configuration:
Users select a trading mode (Aggressive, Balanced, or Conservative) and a color theme (Dark or Light).
Custom colors can also be set for bullish, bearish, strong, neutral, and signal elements.
Technical Indicators
Moving Averages (SMA/EMA) for trend analysis.
RSI to assess momentum and overbought/oversold conditions.
MACD for trend confirmation.
Volume and Volatility (ATR) for market activity evaluation.
Advanced Indicators
Pearson Correlation to measure trend strength.
CCI for cyclic momentum analysis.
Pattern Recognition
The script identifies common bullish and bearish reversal patterns (e.g., engulfing, hammer, morning/evening star) and continuation patterns (e.g., three white soldiers/black crows).
Composite Score
Each indicator contributes to a composite score, weighted according to the selected trading mode.
The score determines the strength of buy/sell signals.
Confluence Analysis
The script counts the number of matching bullish or bearish signals, providing a confluence summary for higher-confidence trades.
Visual Signals and Alerts
Strong buy/sell signals: triangles
Confluence signals: circles
Divergences: crosses
Alerts are triggered for strong buy/sell signals, confluences, and divergences.
Usage Instructions
Add the script to your TradingView chart.
Adjust the settings in the configuration panel to match your trading style.
Monitor the information panels and visual signals to spot trading opportunities.
Set up alerts for your preferred signal types.

Trend Meter [MMT]The Trend Meter is a dynamic Pine Script indicator designed to provide traders with a clear, multi-dimensional view of market trends and momentum across different timeframes and metrics. By integrating Exponential Moving Averages (EMAs), Volume-Weighted Average Price (VWAP), higher timeframe (HTF) analysis, and Regular Trading Hours (RTH) breakouts, this indicator offers a comprehensive tool for identifying bullish, bearish, or neutral market conditions. Its customizable visual display and label system make it ideal for traders seeking actionable insights for trend-following, breakout, or reversal strategies.
Key Features:
1. Multi-Metric Trend Analysis:
- Trend Meter : Compares a Fast EMA (default: 9) and Slow EMA (default: 21) to determine short-term trend direction.
- Bias Meter : Uses a longer-term Bias EMA (default: 35) to assess the overall market bias based on the close price.
- VWAP Meter : Evaluates price position relative to the VWAP for dynamic support/resistance insights.
- HTF Meter : Analyzes higher timeframe (default: 60-minute) price action, detecting breakouts of previous highs/lows and candle direction.
- RTH Meter : Tracks price breakouts above/below the US Regular Trading Hours (09:30–16:00 EST) 15m opening range (09:30–09:45 EST).
2. Color-Coded Visuals:
- Each metric is displayed as a horizontal line with customizable colors (green for bullish, red for bearish, gray for neutral).
- Visual style options (dotted, dashed, or solid lines) allow for personalized chart clarity.
3. Dynamic Labels:
- Optional labels for each metric (Trend, Bias, VWAP, HTF, RTH) with customizable text, size (tiny to huge), and color.
- Labels update in real-time, providing clear identification of each meter’s role and current state.
4. Flexible Metric Selection:
- Toggle individual metrics (EMA, VWAP, HTF, RTH) on/off to focus on relevant indicators for your trading style.
- Option to use the previous bar’s close price for calculations, reducing noise in volatile markets.
5. RTH and Opening Range Analysis:
- Calculates the high/low of the opening range (09:30–09:45 EST) during RTH sessions.
- Signals bullish or bearish conditions when the price breaks above/below the opening range outside the initial 15-minute window.
6. Higher Timeframe Breakout Detection:
- Monitors HTF price action to identify breakouts of the previous candle’s high or low, combined with the HTF candle’s direction for trend confirmation.
How to Use:
- Trend Confirmation : Use the Trend and Bias Meters to confirm short-term and long-term market direction.
- Breakout Trading : Leverage the RTH Meter for breakout setups above/below the opening range during US trading hours.
- Support/Resistance : Utilize the VWAP Meter to identify dynamic price levels for entries or exits.
- Higher Timeframe Context : Monitor the HTF Meter for broader market trend alignment, ideal for swing or position trading.
- Customization : Adjust EMA lengths, toggle metrics, and customize visual styles and labels to suit your chart preferences.
Settings:
- Bias Settings :
- Fast EMA (default: 9), Slow EMA (default: 21), Bias EMA (default: 35).
- Higher Timeframe (default: 60-minute).
- Option to use previous close price for calculations.
- Enable/disable individual metrics (EMA, VWAP, HTF, RTH).
- Visual Settings :
- Bullish (green), bearish (red), and neutral (gray) colors.
- Line style (dotted, dashed, solid).
- Label Settings :
- Enable/disable labels.
- Customize label size (tiny, small, normal, large, huge) and text color.
- Custom text for each meter’s label (Trend, Bias, VWAP, HTF, RTH).
Notes:
- Optimized for intraday trading (e.g., 1m, 5m, 15m) but adaptable to any timeframe.
- RTH and opening range calculations are tailored for US markets (EST timezone); adjust session times in the code for other markets.
- Higher timeframe analysis enhances context for multi-timeframe strategies.
Ideal For:
- Intraday traders targeting RTH breakout opportunities.
- Swing traders aligning with higher timeframe trends.
- Traders using VWAP and EMA-based strategies for trend and momentum analysis.
- Those seeking a clean, customizable dashboard for multi-metric market analysis.

RSI MTF Table - 12 Pairs (1,5,15)
The relative strength index measures the speed and magnitude of an asset's recent price changes. Therefore, it is considered a momentum indicator in technical analysis. Essentially, the RSI is the ratio of the days an asset's value increases to decreases over a given period.
Generally speaking, if the RSI is around 50, we do not expect strong movements. RSI above 65 or below 35 are areas we expect. In this context, this chart and the general momentum in 1-5-15 minutes allow us to quickly determine the parity we will trade. It is useful for intraday trading and scalping.

Swing High Low ZigZag v3.0 BajaSwing High/Low Pivot - Designed to help easily spot peaks and bottoms for quicker drawing of trendlines and other drawings as well as alerts without needing to zoom in a whole lot.

Multi-Timeframe RSI + MA - Santosh - BangaloreThis script has a combined 5 and 15 min RSI's together in one indicator. Created using AI.

ICMR — Chrono Maker Range (v12.7.1)✅ ICMR — Chrono Maker Range (v12.7) — Description (Balanced Technical + Friendly)
ICMR — Chrono Maker Range is a hybrid market-structure tool designed to help traders clearly identify directional bias and high-quality breakouts using either Higher-Timeframe (HTF) ranges or Initial Balance (IB) ranges. The indicator automatically builds the range, colors candles by market state, and highlights breakout signals using smart filters to reduce noise.
The concept is simple:
Price is either above the range (Bullish), inside the range (Neutral), or below the range (Bearish)—and ICMR keeps this state stable and easy to follow.
🔷 How It Works
ICMR constructs a tradable range using one of two modes:
1) HTF Range Mode
Pulls the High / Low from a higher timeframe (e.g., Daily, 4H).
You can choose:
Previous HTF candle → stable, non-moving range
Current HTF candle → dynamic, expands until HTF close
Perfect for tracking market bias across smaller timeframes.
2) Initial Balance (IB) Mode
Builds the range from the first N minutes of the session (e.g., first 60 minutes).
After the IB period ends, the range locks and becomes the day’s framework.
🔷 Market State Logic
The indicator evaluates where price is relative to the range and classifies the market into:
✅ Bullish → price breaks above the range
⚪ Neutral → price stays inside
❌ Bearish → price breaks below
You can optionally enable an EMA Trend Filter (fast vs slow EMA) to ensure breakouts align with trend direction.
🔷 Smart Signal System
ICMR includes compact signal shapes (triangles/circles), but only when conditions are strong:
✔️ Minimum breakout distance beyond the range
✔️ Candle body must exceed a % of ATR
✔️ Optional volume expansion filter
✔️ Cooldown between signals to avoid over-trading
✔️ Option to trigger signals only on state flips
These filters help keep signals actionable and reduce noise.
🔷 Visual Tools
HTF/IB Range High, Range Low, Midline
Optional shaded box
Segmented extend-right lines that reset when HTF/IB changes
Bar coloring (Bull/Neutral/Bear)
Soft background tint (optional)
Built-in info panel with range & filter stats
Alerts on state flips
Everything is designed to keep the chart clean and readable.
🔷 Presets
The indicator includes two ready-to-use profiles:
Conservative
Stable HTF ranges, confirmed breaks, trend-filtered signals, and fewer alerts.
Aggressive
Dynamic HTF ranges, more flexible break rules, and more frequent signals.
Each preset can be fully customized.
🔷 How Traders Use It
Intraday traders use HTF ranges (D, 4H) for bias on 1m–15m charts.
Day traders use IB to track the opening range and breakout opportunities.
Swing traders use conservative settings to filter false moves.
Scalpers enable aggressive mode with ATR/volume filters.

Ichimoku_RSI_MACD_CleanIchimoku + RSI + MACD. A combination of three indicators. The important thing is that they have a BUY or SELL alert, so it makes it easy to understand the numbers.


Ichimoku_RSI_MACDIchimoku cloud + RSI + MACD. Combined indicators with signals, indicating whether it is bullish or bearish (BUY or SELL).
