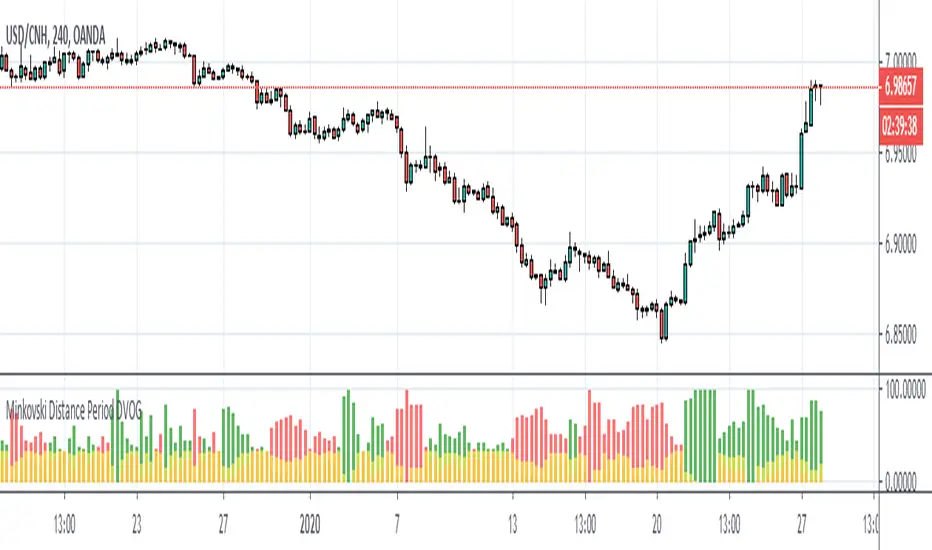
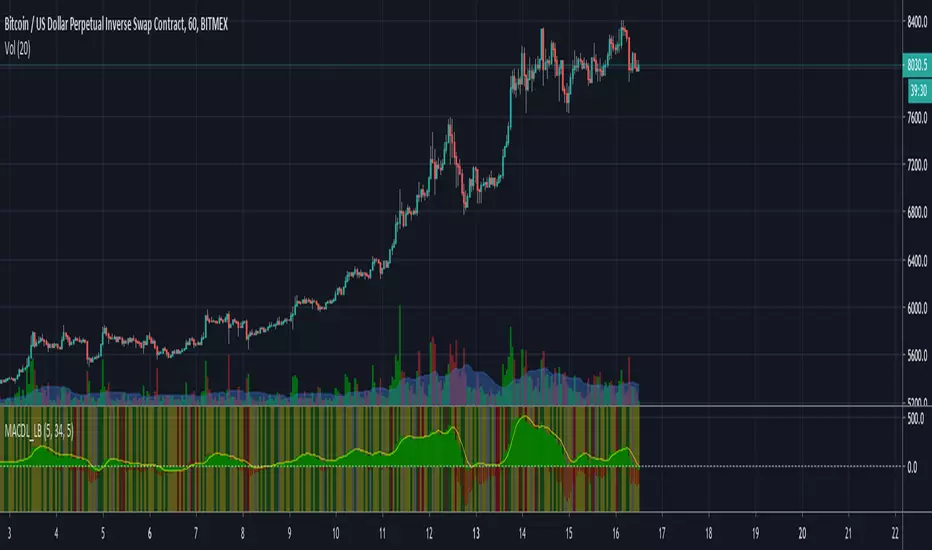
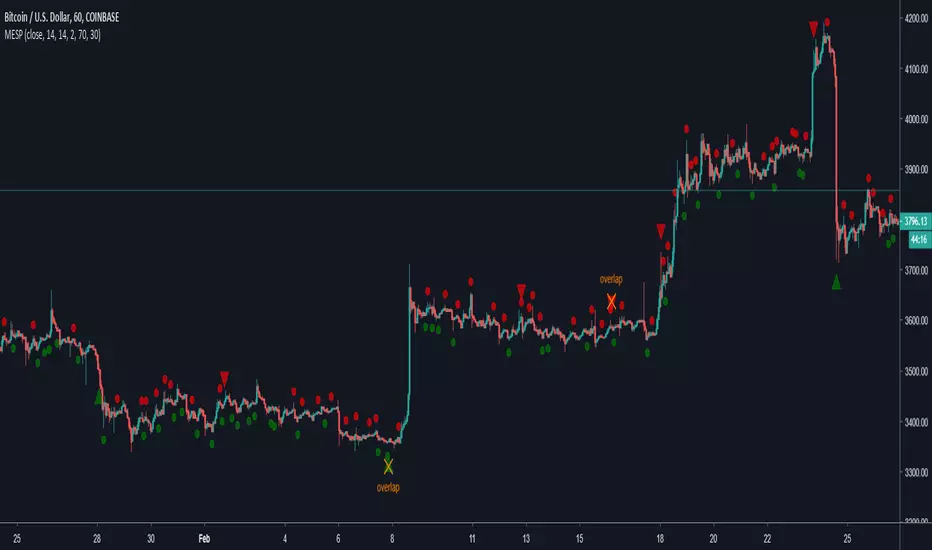
Bulls vs BearsThe script measures relative strenth of bull bars vs bear bars that complete the next rules:
1) rising price with rising volume calculates as bullish only if the next candle is higher
2) falling price with falling volume calculates as bullish only if the next candle is higher
3) rising price with falling volume calculates as bearish only if the next candle is lower
4) falling price with rising volume calculates as bearish only if the next candle is lower
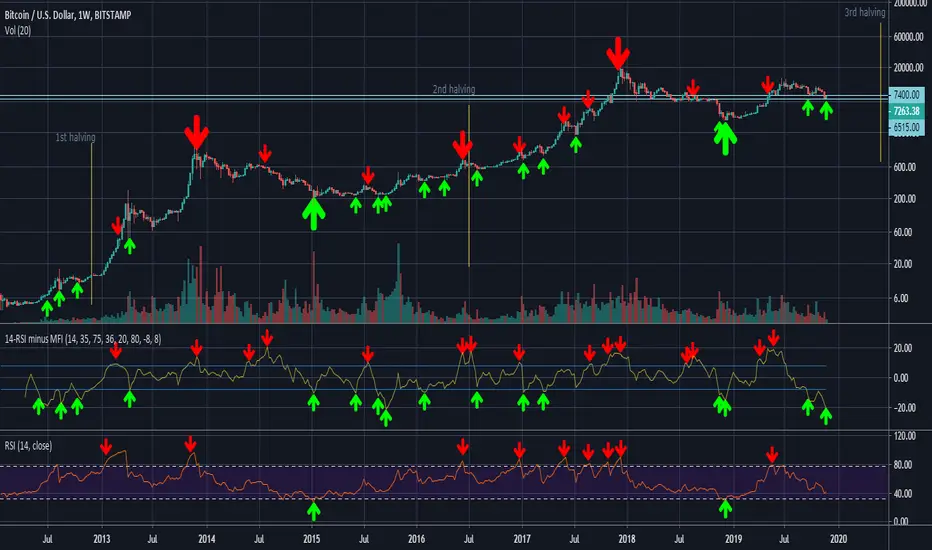
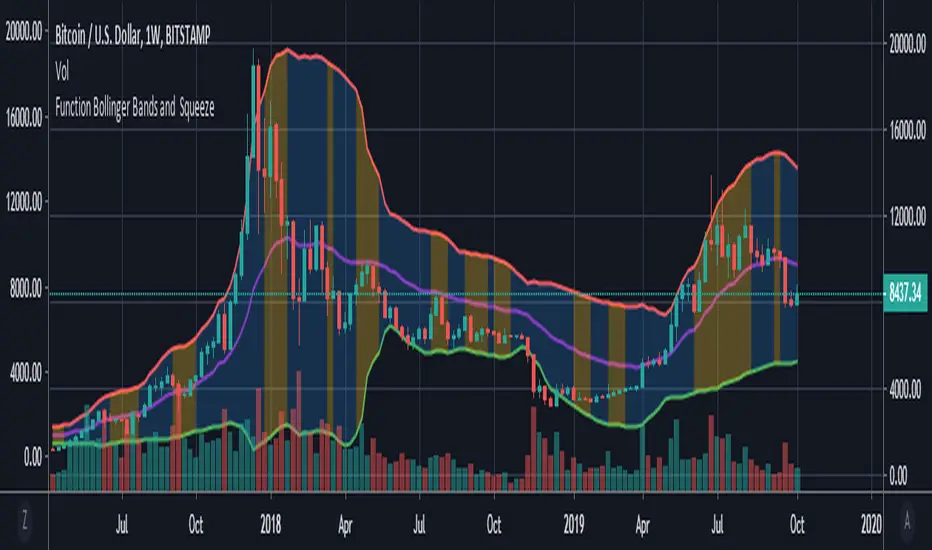
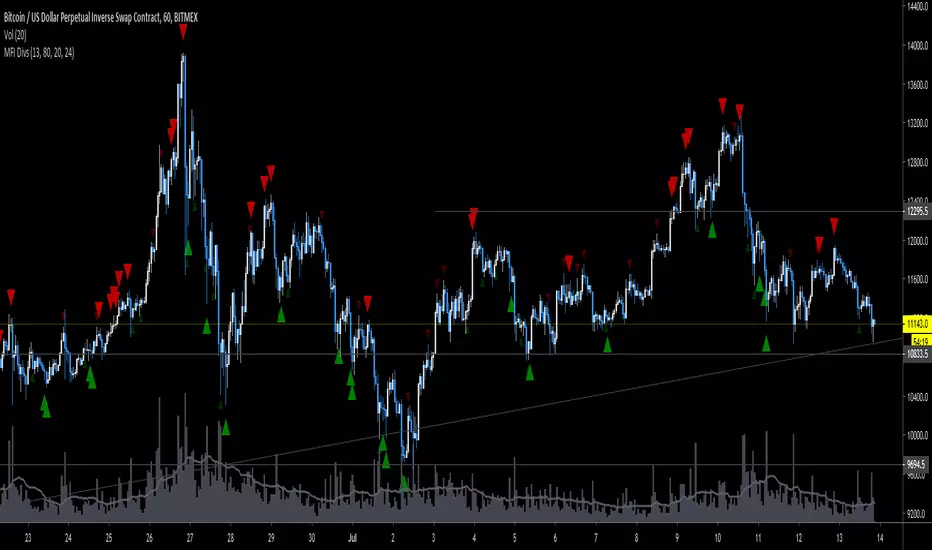
examples
ethusdt
shitperp
bsvusdt
btcusdt
อินดิเคเตอร์ Pine Script®